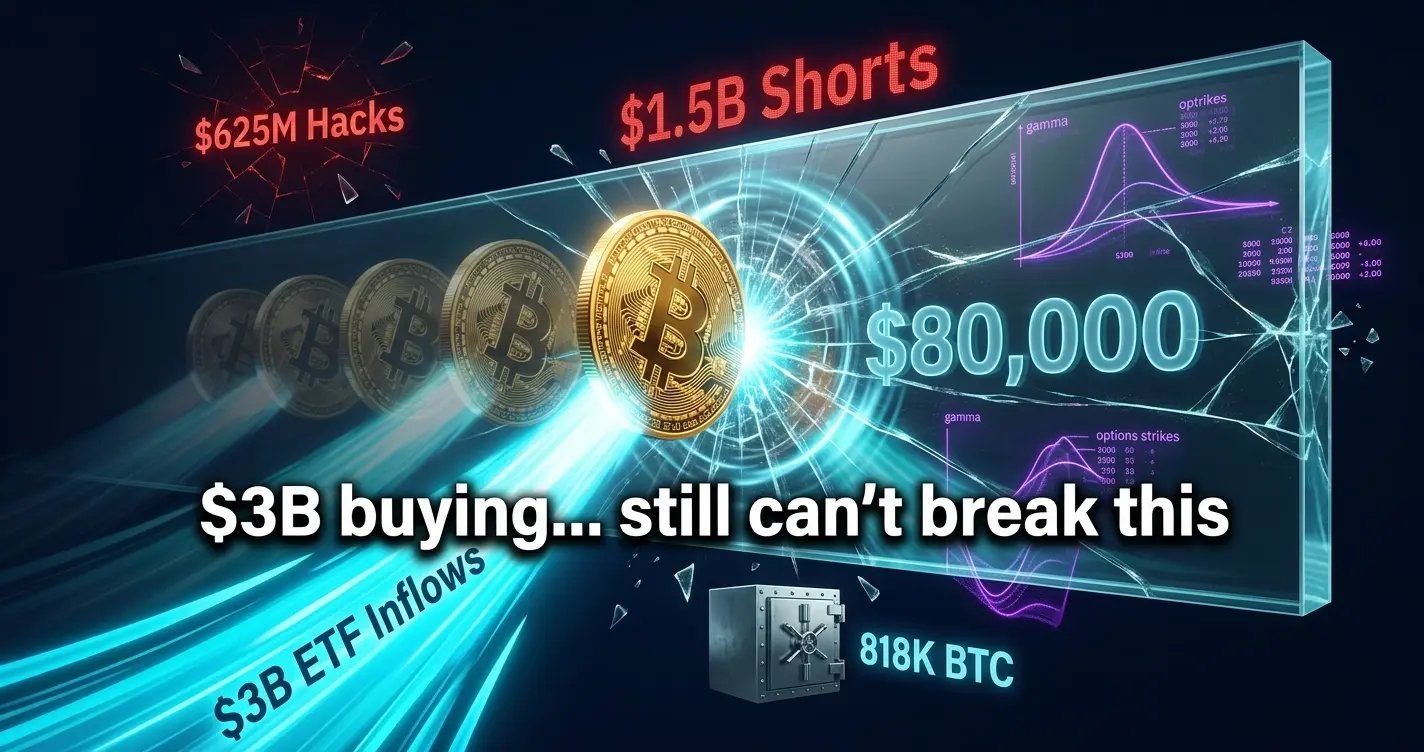
Bitcoin’s $80K Wall: Why 4 Rejections, $3B in ETF Inflows, and 818K BTC in Corporate Vaults Still Haven’t Broken It
Bitcoin has bounced off $80,000 four times since February. Institutions keep buying, exchange reserves sit at a six-year low, and prediction markets priced a May 1 close above $79,000 at just 22 cents. Something structural is holding the line.
Bitcoin traded between $78,000 and $78,700 on May 1, 2026, inching toward a resistance level that has now repelled four separate breakout attempts since February. The number is round, the psychology is obvious, and the mechanics are anything but simple. Beneath a deceptively flat price chart sits a coiled structure of options exposure, institutional order flow, and on-chain supply compression that makes $80,000 one of the most technically significant price points in this market cycle.
The week ending April 25 saw Bitcoin spot ETFs absorb a net $3.06 billion in fresh capital, the second-largest weekly inflow ever recorded, according to SoSoValue data. BlackRock’s IBIT alone pulled in $1.45 billion across those five trading days, pushing its lifetime net inflows past $41.2 billion. That buying wave didn’t push Bitcoin through $80,000. It got within $523 of the level and then reversed.
That reversal tells you more about what’s really happening than the inflow number does. This is a market where institutional demand is real, supply on exchanges has fallen to a six-year low of 2.3 million BTC, and yet a single price level keeps acting like a ceiling. Here’s why, and what it would actually take to change that.
The $80K Wall: Options, Gamma, and 7,200 BTC in Open Interest
The $80,000 level isn’t just psychologically significant. It carries real mechanical weight in the options market. According to analysis from crypto exchange Bittime, there are approximately 7,200 BTC worth of open interest clustered at or near the $80,000 strike, and the current gamma exposure at that level is positive, meaning options dealers are net short gamma and must sell into rising prices to stay hedged.
“BTC’s resistance level is at $80,000 [and] exceeding this level will trigger extreme volatility.”
On-chain analyst Murphy, cited by Bittime Research, April 27, 2026
What that means in practice: every time Bitcoin approaches $80,000, dealers sell to rebalance their books. The selling isn’t driven by conviction that the price is too high. It’s mechanical. Once price clears that level and moves into the zone above $81,000, however, the gamma flips negative. At that point dealers need to buy into rising prices, which can accelerate a move toward $82,000 and beyond with surprising speed. Bittime’s data puts the negative gamma zone at roughly 4,644 BTC of exposure above $81,000.
What is gamma exposure? Options dealers who sell calls must buy the underlying asset as prices rise to hedge their position. When gamma is positive (near a resistance strike), this hedging pressure works against the breakout. When gamma turns negative above that strike, the hedging pressure reverses and can amplify upward moves dramatically.
The April 24 intra-day high of $79,477 illustrated this exactly. Bitcoin came within half a percentage point of $80,000, touched that options resistance zone, and was sold back within hours. The rejection wasn’t a coincidence. It was the market’s options structure executing exactly as designed.
“Bitcoin must break $80,000 to exit consolidation and confirm a durable bullish regime.”
Bitfinex Research Desk, Bitcoin.com News, April 26, 2026
Bitfinex analysts have been consistent on this point since late April. Break the level with a weekly close above it, and the consolidation that began after Bitcoin’s February peak near $126,000 is structurally over. Fail again, and the range compresses further until something external forces a resolution. There’s also an estimated $1.5 billion in short positions that would be force-liquidated if Bitcoin clears $81,000, adding further fuel to any genuine breakout.
ETF Flows: A Record Week Followed by Three Days of Outflows
The $3.06 billion weekly inflow was genuinely exceptional. To put it in context, Bloomberg ETF analyst Eric Balchunas captured the trajectory well when the products first launched:
“If they can take in $22 billion when it’s raining, imagine when the sun is shining.”
Eric Balchunas, Senior ETF Analyst, Bloomberg, CryptoBriefing, January 5, 2026
That early-2026 optimism played out in April’s inflow numbers. But what the weekly headline obscured was a sharp reversal in the days that followed. After the record week ended April 25, flows turned negative almost immediately.
| Date | ETF Flow | Notable |
|---|---|---|
| Apr 21-25 (week) | +$3.06B net inflows | Second-highest week on record; IBIT +$1.45B |
| Apr 27 | -$263M outflows | Largest single-day outflow of the post-peak period |
| Apr 28 | -$89.68M outflows | Fidelity FBTC shed 1,959 BTC in one session |
| Apr 29 | -$112M (IBIT alone) | BlackRock’s flagship product posted its own net outflow day |
Three consecutive days of outflows after a record inflow week is the kind of data point that gets lost in the narrative. It doesn’t invalidate the structural bull case. But it does confirm that institutional appetite, while real, is not an unlimited conveyor belt of buying pressure. When Bitcoin failed to reward the surge of April 21-25 capital with a breakout, some of that money came back out.
Flow reversal risk: For a sustained move above $80,000, analysts say ETF outflows need to flip back to consistent net positive territory. Three consecutive days of net selling after the second-biggest weekly inflow on record suggests momentum may need a fresh catalyst to reignite.
The early-2026 picture does offer longer-term reassurance. Bitcoin ETFs pulled in $1.2 billion across their first two trading days of 2026. If that pace had been sustained over a full year, total annual inflows would have annualized toward $150 billion. It didn’t sustain at that pace, obviously. But it established a demand floor that keeps showing up during any meaningful dip.
818,334 BTC: Corporate Accumulation as a Structural Floor
Strategy, the software company turned Bitcoin holding vehicle led by Michael Saylor, now holds 818,334 BTC. That’s approximately 4.2% of the total Bitcoin supply that will ever exist, sitting in a single corporate treasury. And the buying hasn’t stopped.
On April 20, Strategy added 34,164 BTC at an average price of $74,395, spending $2.54 billion in a single transaction. One week later, another 3,273 BTC for $255 million. The consistency of this accumulation, even at prices most retail buyers would consider elevated, does two things to the market. It removes coins from circulation. And it sets a psychological floor well below current trading prices.
Strategy Holdings
818,334 BTC (~4.2% of total supply). Latest purchases averaged $74,395 per coin across two April transactions totaling $2.8B.
Exchange Reserves
2.3 million BTC on exchanges, the lowest level in six years. Less available supply means larger price swings when demand spikes.
Stablecoin Dry Powder
$317 billion in stablecoins, representing 11.73% of total crypto market cap. Potential buying power sitting on the sidelines.
BTC Dominance
57.89% of the $2.65T total crypto market cap. Institutional preference keeps flowing toward BTC over altcoins.
The structural argument is straightforward: with exchange reserves at a six-year low and a single entity holding 4.2% of supply, the available float that could meet institutional demand is genuinely constrained. That’s the supply side of the equation. The demand side, as represented by ETF inflows, has shown it can generate $3 billion in a single week. When those two forces converge with a macro catalyst, the options market’s gamma structure above $80,000 turns from headwind to tailwind almost instantly.
“The $85,000 to $88,000 zone is not a fantasy number, and it sits right at the confluence of the 200-day simple moving average and the upper boundary of the resistance band.”
Michael van de Poppe, Independent Market Analyst, Phemex Research, April 29, 2026
April’s $625M Hack Storm: The Bearish Signal Nobody’s Talking About
While Bitcoin prices climbed and ETF headlines dominated, April 2026 quietly became the worst month in crypto security history by incident count. DeFiLlama confirmed 28 to 30 separate exploits, with more than $625 million stolen across the industry. Two attacks alone accounted for 93% of the damage.
- The Drift Protocol exploit on April 1 drained $285 million from the Solana-based derivatives platform in one of the largest single DeFi hacks on record.
- The KelpDAO attack on April 18, targeting a cross-chain bridge via LayerZero, extracted $293 million, briefly setting a new single-incident record before month-end tallies put it second behind Drift on impact.
- The remaining 26-28 incidents collectively accounted for roughly $47 million, a figure that would dominate headlines in a quieter month but barely registered against April’s two landmark exploits.
Context: DeFiLlama’s confirmation of April 2026 as the most-hacked month by incident count doesn’t mean the DeFi ecosystem is collapsing. But $625 million in 30 days creates measurable headwinds for sentiment, particularly among institutional allocators who must justify exposure to their risk committees. This is a suppressive force on the upside that price charts alone don’t capture.
The timing matters. April’s hack wave coincided almost exactly with the peak ETF inflow week and the $79,477 rejection. Some portion of the selling pressure that knocked Bitcoin back from its high likely reflected DeFi participants moving funds off-chain or rotating to safer assets after major protocol failures. It’s impossible to isolate that effect precisely, but it’s also not credible to ignore it entirely.
The broader context is also troubling. The FBI reported $240 million lost to crypto ATM scams in just the first half of 2025, with total ATM-related fraud losses exceeding $333 million nationally. Tennessee has already passed legislation banning crypto ATMs entirely, effective July 2026, citing the FBI-linked fraud data. That’s a retail access restriction at a moment when institutional channels are expanding rapidly, which creates an asymmetric market structure that skews heavily toward sophisticated players.
Macro and Policy Backdrop: Risk-On, but Fragile
Bitcoin’s correlation with traditional risk assets has been consistent throughout this cycle. When equity futures rise, Bitcoin tends to follow. When the Federal Reserve tilts hawkish, crypto sells off. The current macro environment offers a cautiously supportive backdrop, but “cautious” is doing a lot of work in that sentence.
“Market conditions appear to be realigning with the broader status quo, particularly around Fed expectations. After a brief wobble driven by a hawkish tilt that unsettled risk assets, the market is once again leaning toward accommodation.”
Joel Kruger, Strategist, LMAX Group, Finance Magnates
Kruger’s observation describes the macro mechanism that keeps reasserting itself: whenever the Fed signals even a modest lean toward easier conditions, risk assets including Bitcoin catch a bid. The current setup mirrors that pattern. Bitcoin has recovered 30% from its cycle low of $60,000, and the global crypto market cap sits at $2.65 trillion to $2.7 trillion as of May 1, up more than 2% in 24 hours. That’s not explosive. But it’s directional.
Ethereum traded at $2,280 on May 1, up roughly 1.06% on the day, with an intra-day range of $2,260 to $2,300. Ethereum’s relative underperformance against Bitcoin, whose dominance now stands at 57.89%, reflects a consistent theme of this cycle: institutional capital flows into BTC first, altcoins second. Until Bitcoin establishes a clear new range above $80,000, that capital hierarchy is unlikely to shift.
Market snapshot, May 1, 2026: Bitcoin ~$78,000-$78,700 (+2-3% 24h). Ethereum $2,280 (+1.06%). Global crypto market cap $2.65T-$2.7T. BTC dominance 57.89%. BTC market cap $1.56T. Stablecoin market cap $317B (11.73% of total). Sources: CoinGecko.
The prediction markets offered their own probability assessment on May 1. Robinhood’s Bitcoin price event contracts priced a 5pm EDT close at or above $78,000 at 71 cents, above $78,500 at 43 cents, and above $79,000 at just 22 cents. Sophisticated traders put the probability of challenging the $80,000 resistance zone by end of day at roughly one in five.
3 Scenarios for May: Breakout, Grind, or Reversal
Analyst CF Benchmarks’ Gabe Selby framed the decision point plainly in late April: “$80K could be reached within days, though failure to break $88K may trigger renewed consolidation.” That’s the May range in a single sentence. What determines which scenario plays out?
| Scenario | Trigger | Price Target | Key Risk |
|---|---|---|---|
| Breakout | Weekly close above $80K + ETF outflows reverse; $1.5B short squeeze ignites above $81K | $82K-$88K (van de Poppe’s 200-DMA confluence zone) | Gamma flip to negative above $81K creates vol spike; macro shock could kill momentum mid-run |
| Grind | ETF flows remain mixed; no macro catalyst; range-bound $74K-$80K continues | $76K-$80K through May | Prolonged compression increases the probability of a violent resolution in either direction |
| Reversal | Macro deterioration (hawkish Fed surprise, equity selloff); ETF outflows accelerate | Retest $74K-$75K range support | Strategy’s average cost basis near $74K provides a structural defense; below that gets ugly |
Phemex’s market analysts laid out three specific conditions they say must all be met for a sustained push toward $88,000: ETF inflows need to return to net positive and stay there for at least a week; the macro environment needs to hold its current risk-on posture without a Fed shock; and on-chain data needs to confirm that long-term holders aren’t distributing into strength. Two of those three conditions were borderline as of May 1. The third, on-chain holder behavior, remains constructive.
The short-squeeze element adds a non-linear dimension to any breakout. An estimated $1.5 billion in short positions sit above current prices, clustered most densely between $80,000 and $82,000. A clean break above $80,000 that forces even a portion of those positions to close at a loss doesn’t just add buying pressure. It removes selling pressure simultaneously, which is why breakouts from ranges like this can happen faster than even optimistic forecasts anticipate. The options-driven negative gamma above $81,000 amplifies that further.
Frequently Asked Questions
Why does Bitcoin keep failing to break $80,000?
The $80,000 level carries significant options market resistance, with roughly 7,200 BTC in open interest at that strike. Options dealers must sell into rallies approaching $80,000 to stay hedged, creating mechanical selling pressure that doesn’t reflect fundamental bearishness. Once price clears that level, the dynamic reverses.
How much did Bitcoin ETFs bring in during April 2026?
The week of April 21-25 saw Bitcoin spot ETFs record $3.06 billion in net inflows, the second-highest weekly total ever. However, three consecutive days of net outflows followed: $263 million on April 27, $89.68 million on April 28, and $112 million from BlackRock’s IBIT alone on April 29.
How much Bitcoin does Strategy (formerly MicroStrategy) hold?
As of late April 2026, Strategy holds 818,334 BTC, representing approximately 4.2% of Bitcoin’s total eventual supply. The company added 34,164 BTC at an average of $74,395 on April 20 and 3,273 BTC one week later, spending roughly $2.8 billion across two purchases.
What happened with crypto hacks in April 2026?
April 2026 became the most-hacked month in crypto history by incident count. DeFiLlama confirmed 28 to 30 separate exploits totaling more than $625 million stolen. The Drift Protocol exploit ($285 million) and KelpDAO exploit ($293 million) accounted for 93% of losses.
What is a short squeeze and why does it matter at $80K?
A short squeeze occurs when rising prices force traders who bet against an asset to buy it back to limit losses. Approximately $1.5 billion in short positions are estimated above current Bitcoin prices. If Bitcoin clears $81,000, forced short-covering adds significant upward momentum on top of normal buying pressure.
What price targets are analysts citing for Bitcoin in May 2026?
Independent analyst Michael van de Poppe cites $85,000-$88,000 as a realistic target if Bitcoin breaks $80,000, based on the 200-day moving average and resistance band confluence. CF Benchmarks analyst Gabe Selby noted $80,000 could be reached within days but cautioned that failure to clear $88,000 risks renewed consolidation.
Is Bitcoin’s dominance rising or falling in 2026?
Bitcoin dominance sits at 57.89% of total crypto market cap as of May 1, 2026, with a market cap of $1.56 trillion out of a total $2.65-$2.7 trillion global crypto market. Institutional preference for BTC over altcoins continues to support its dominant share of flows.
What is the Tennessee crypto ATM ban and what does it signal?
Tennessee passed legislation banning crypto ATMs, effective July 2026, citing FBI data linking machines to fraud. The FBI reported $240 million in ATM-related scam losses in the first half of 2025 alone, with total losses exceeding $333 million nationally. Tennessee’s move is an early signal of a broader retail-channel restriction trend as institutional access expands.
What Comes Next
The honest read on Bitcoin’s position at the start of May 2026 is that the bulls have done almost everything right and still can’t close above $80,000. Institutional flows hit a near-record. Corporate treasury buying continued at scale. Exchange supply compressed to multi-year lows. The macro backdrop shifted toward risk-on. And Bitcoin topped out at $79,477 before reversing.
That’s not a failure of the bull case. It’s the bull case colliding with a specific, well-defined structural obstacle. Options market mechanics, not fundamental disagreement about Bitcoin’s value, are the primary force keeping price below $80,000. That’s both reassuring and frustrating: reassuring because the resistance is finite and mechanical rather than sentiment-based, frustrating because it can persist indefinitely until a catalyst with enough force to overwhelm the gamma wall shows up.
The April hack data adds a layer of complexity that most price-focused analysis ignores. Losing $625 million across 30 incidents doesn’t just affect the protocols and users directly hit. It shapes the risk conversation inside institutional treasury and compliance teams evaluating crypto allocations. If April’s security picture carries into May, it limits the marginal institutional buying that could provide the catalyst the price needs.
One other data point is worth keeping in mind: $317 billion in stablecoins sits on the sidelines, representing 11.73% of total crypto market cap. That’s buying power looking for a reason to deploy. If Bitcoin provides that reason, in the form of a clean weekly close above $80,000 with ETF outflows reversing, the chase toward van de Poppe’s $85,000-$88,000 target zone could compress into a matter of days rather than weeks.