NeuralWired is a Tier 1 technology publication delivering research-backed analysis for professional decision-makers across engineering, strategy, and investment. Our editorial standard: TechCrunch’s velocity, Wired’s depth, MIT Technology Review’s rigor. Every article is sourced from primary data, peer-reviewed research, and verified expert commentary.
AIOps / InfrastructureMarch 30, 202614 min read
Enterprises using AIOps self-healing infrastructure are cutting incident resolution time by 65% and hitting 300% ROI within 18 months. But nearly one in three teams still fail at rollout. Here’s what separates the leaders from the laggards, with a full implementation roadmap.
NW
NeuralWired Research Desk
Based on primary research, analyst reports, and verified expert interviews. Last updated March 2026.
Seventy-three percent of enterprises plan to adopt AIOps self-healing infrastructure by the end of 2026, according to a December 2025 survey of over 500 IT leaders by Gartner. The market behind that adoption sprint is now worth an estimated $25 billion, growing at a 30% annual rate per IDC’s Worldwide AIOps Forecast.
That’s a lot of money chasing a technology most teams still can’t define precisely. AIOps self-healing infrastructure sits at the intersection of machine learning, observability, and automated remediation. When it works, it cuts your mean time to resolution by 65%. When it doesn’t, you’ve spent $500,000 on a platform that generates better alert noise.
The split between the two outcomes is real. Forrester’s AIOps Wave Q1 2026 found that 28% of AIOps projects collapse because of data silos. Community practitioners on Reddit’s DevOps board describe a phenomenon they call “alert fatigue 2.0,” where self-healing fires off remediation scripts on false positives faster than any human team ever could.
73%Enterprises adopting AIOps by end of 2026
65%MTTR reduction with mature self-healing
300%ROI in 18 months for mature teams
28%Projects that still fail due to data silos
This guide covers everything decision-makers need: how AIOps self-healing infrastructure actually works at a technical level, a five-level maturity model to benchmark your team, verified vendor comparisons, a FinOps and GreenOps integration framework, a four-phase implementation roadmap, an ROI calculator, and an honest assessment of where the technology still falls short. All figures come from primary analyst reports, peer-reviewed research, or vendor-verified benchmarks.
What AIOps Self-Healing Infrastructure Actually Is
The term gets misused constantly. AIOps is not just another dashboard. Self-healing infrastructure is not simply autoscaling. The distinction matters because teams that confuse the two invest in observability tooling while ignoring the ML layer that makes autonomous remediation possible.
At its core, AIOps self-healing infrastructure is a system that can detect anomalies in telemetry data (logs, metrics, traces), predict likely failure states before they cause outages, and execute pre-approved remediation actions without human involvement. The “self-healing” label applies when all three functions run autonomously, not just one or two.
According to a January 2026 ResearchGate study on autonomous self-healing in production, which analyzed over 10,000 incidents across 50 enterprises, AI models now predict failures with 92% accuracy and resolve 82% of incidents without a human ever touching a keyboard. Those numbers were unthinkable three years ago.
“Self-healing isn’t hype. Our Davis engine predicts 92% of incidents autonomously, and that number has improved every quarter since 2024.”
The full AIOps stack typically includes four components working in sequence: a unified observability layer (collecting telemetry via tools like OpenTelemetry), an anomaly detection engine (ML models watching for deviations from learned baselines), a prediction layer (time-series forecasting to flag likely failures), and a remediation orchestrator (runbooks, Kubernetes operators, or ArgoCD workflows that execute the fix).
Half of Fortune 500 companies were already running some version of this stack in Q1 2026, per Deloitte’s AIOps Adoption Survey. For mid-market organizations, the gap to close is real but narrowing fast.
How Self-Healing Works Under the Hood
Understanding the technical mechanics separates teams that implement correctly from teams that buy licenses and call it done. Three ML patterns drive the majority of production self-healing deployments today.
Anomaly Detection
The detection layer watches incoming telemetry streams for deviations from learned baselines. Most production systems use a combination of statistical models (z-score, isolation forests) and deep learning approaches. An IEEE paper published in February 2026 benchmarked ML models for IT self-healing and found 85% average accuracy in anomaly detection across real and synthetic datasets, a figure that rises to over 90% with sufficient training data.
Predictive Failure Forecasting
Detection catches problems as they emerge. Prediction catches them before they surface. Teams running mature AIOps deployments use time-series models (Prophet, ARIMA, or LSTM networks) trained on months of historical incident data to forecast likely failure windows. Stanford’s NeurIPS 2025 proceedings on causal AIOps note, however, that prediction accuracy tends to plateau around 90% unless the model incorporates causal inference, not just correlation. False positives spike in high-noise environments without this distinction.
“AIOps prediction accuracy plateaus at 90% without causal ML. Correlation-only models work fine until your infrastructure gets complex.”
Dr. Fei Tony Liu, Professor at Stanford AI Lab, NeurIPS 2025
Automated Remediation
The remediation layer converts predictions into actions. In Kubernetes environments, this typically means operators that restart pods, adjust resource quotas, or reroute traffic. More complex flows use ArgoCD to execute YAML-defined runbooks against GitOps repositories, ensuring every automated change is auditable and reversible. The CNCF’s 2026 GitOps for AIOps whitepaper makes the case that GitOps integration is not optional for production-grade self-healing.
“Self-healing infrastructure demands GitOps integration. Without it, you’re just automating alerts with no audit trail and no rollback.”
Kelsey Hightower, Principal Engineer (former Google Cloud), KubeCon 2026
One critical pattern all mature teams share: shadow mode testing before live remediation. New runbooks run in parallel with production traffic, logging what they would have done without actually executing. Teams that skip this step report a higher rate of cascading failures triggered by overconfident automation.
The AIOps Maturity Model: Where Is Your Team?
Before deciding what to buy or build, you need an honest read on where your organization stands. Forrester analyst Analya Shah, who leads AIOps research at the firm, has a blunt warning: “By 2026, 60% of enterprises will fail AIOps without maturity models.” Her team’s Forrester Wave Q1 2026 provides the clearest picture of where enterprises actually cluster.
Level
Name
Capability
Typical Outcome
Enterprise Share
L1
Manual Alerts
Threshold-based alerts, human triage
4+ hour MTTR, high on-call burden
20%
L2
Basic Detection
Statistical anomaly detection, correlation
Reduced noise, 2-3 hour MTTR
35%
L3
Predictive Analytics
ML forecasting at 80% accuracy
Proactive incident prevention, 1-2 hour MTTR
28%
L4
Self-Healing
50%+ autonomous remediation
Sub-hour MTTR, 65% MTTR reduction
12%
L5
Full Autonomy + GreenOps
90%+ automation, carbon-aware autoscaling
ROI over 300%, 22% energy savings
5%
The Deloitte survey data behind these distribution figures is sobering. Only 17% of enterprises have reached Levels 4 or 5, where autonomous self-healing generates measurable business value. The majority of organizations, 55%, sit at Levels 1 and 2, still running largely reactive operations with basic tooling.
Practical benchmark: If your team’s MTTR is still measured in hours, you’re at Level 1 or 2. Level 3 teams measure in tens of minutes. Level 4 and above measure in minutes or seconds for most incident classes.
Best AIOps Tools for Self-Healing in 2026
The vendor market is consolidating fast. IDC’s forecast puts the AIOps segment at $25 billion, and the TechCrunch funding tracker for March 2026 logged over $500 million in new investments into the space in Q1 alone. Not all platforms offer self-healing at the same depth.
The scoring below weights detection accuracy at 30%, autonomous remediation rate at 30%, FinOps integration at 20%, cost at 10%, and ease of deployment at 10%, reflecting what production teams tell us actually matters once the pilot is over.
Dynatrace leads on prediction accuracy, driven by its Davis AI engine, which processes over a billion dependency calls per day. Splunk leads on FinOps integration, with native connectors to AWS Cost Explorer and Azure Cost Management. New Relic wins on price-to-performance for teams that don’t need the top tier of autonomous remediation. These benchmarks draw on Dynatrace’s 2026 State of AIOps Report, which benchmarked 1,200 customer deployments, and New Relic’s Observability Forecast 2026.
One vendor warning worth flagging: Forrester’s Wave report raised concerns about lock-in risk across all enterprise AIOps vendors. Before signing a multi-year contract, confirm you can export your ML model weights and historical incident data in a portable format.
FinOps and GreenOps: The Cost and Carbon Angle
Most AIOps articles stop at uptime. The smarter conversation in 2026 is about what self-healing does to your cloud bill and your carbon footprint. These are no longer side effects. They’re primary selection criteria for cloud-native organizations with both cost and sustainability mandates.
McKinsey’s Cloud FinOps Report 2026 analyzed 200 firms that integrated AIOps with FinOps tooling and found a 40% average reduction in cloud costs. The mechanism is straightforward: self-healing systems that already manage resource allocation autonomously can also rightsize instances, scale down idle workloads, and pre-emptively shift traffic to lower-cost regions during off-peak windows.
“AIOps plus FinOps auto-scales waste away, saving 30 to 50% on cloud bills. The teams doing this aren’t just cutting incidents. They’re cutting cloud spend simultaneously.”
Gene Kim, CTO at Tripwire and DevOps author, at DevOps Days 2026
The GreenOps angle is newer but growing fast. Google Cloud’s 2026 Sustainability Report, drawing on usage data from over 1,000 accounts, documented a 22% average energy reduction when organizations enabled carbon-aware autoscaling through AIOps. The model works by routing workloads toward regions with lower grid carbon intensity during periods when latency requirements allow it.
FinOps integration checklist: Before enabling AIOps-driven rightsizing, confirm your team has (1) a tagging strategy for all cloud resources, (2) defined cost anomaly thresholds, (3) approval workflows for actions above a dollar threshold, and (4) rollback policies for autoscaling decisions that affect production SLAs.
Padmasree Warrior, board advisor at Cisco with a former CTO background, summed up the dependency cleanly at the Gartner IT Symposium 2026: “AIOps self-healing will cut MTTR by 70% or more, but only with clean data pipelines.” FinOps integration collapses without unified tagging and consistent resource metadata. The data discipline problem is the same whether you’re trying to fix incidents faster or cut cloud bills.
4-Phase Implementation Roadmap for AIOps Self-Healing
Most failed deployments don’t fail because of bad vendor selection. They fail because teams skip phases or underestimate the data preparation work in phases one and two. This roadmap reflects patterns from the 500-plus deployments studied across Gartner, Dynatrace, and Forrester research.
1
Assess and Instrument
Audit your entire telemetry stack: logs, metrics, and traces. Deploy OpenTelemetry collectors across all services to establish a unified data pipeline. Baseline your current MTTR, false positive rate, and alert volume.
Prerequisite: A unified observability stack. Without this, ML models have no consistent input to learn from.
Timeline: 4 to 8 weeks.
2
Detect and Predict
Train anomaly detection models on 90 or more days of historical incident data. Integrate time-series forecasting (Prophet works well for periodic workloads). Set a 85% detection accuracy target before moving to remediation.
Common mistake: Moving to automation before models are validated. False positives at scale cause more incidents than they prevent.
Timeline: 6 to 12 weeks.
3
Remediate Autonomously
Write your first remediation runbooks in YAML and deploy them in shadow mode against production traffic. Run in shadow mode for a minimum of two weeks. Review logs with your on-call team before enabling live execution.
Governance requirement: Every remediation action must be logged, auditable, and reversible. GitOps via ArgoCD provides this out of the box.
Timeline: 8 to 16 weeks including shadow testing.
4
Optimize and Scale
Connect AIOps to your FinOps tooling for automated rightsizing. Expand runbook coverage to 70%+ of incident classes. Monitor model drift monthly and retrain quarterly. Target 70%+ autonomous resolution at this stage.
Success criteria: MTTR below 1.5 hours across all production services. Cloud cost variance under 10% month-over-month.
Timeline: Ongoing; most teams reach steady state at 6 months post-launch.
The data silo warning: Forrester found that 28% of AIOps projects fail because observability data lives in disconnected silos. If your logs are in one tool, metrics in another, and traces in a third, your ML models will produce inconsistent, low-quality signals. Unifying your telemetry pipeline before building detection models is not optional. It’s the entire foundation.
ROI Framework and Business Case for AIOps Self-Healing
The business case math is straightforward once you have three numbers: your current MTTR, your average incident frequency, and your cost per hour of degraded service. Teams that don’t measure these before starting an AIOps deployment can’t demonstrate value to leadership after, which is a primary cause of budget cuts in year two.
ROI Calculator Template
Annual Savings = (MTTR Reduction % × Incidents Per Year × Cost Per Incident Hour)
minus Platform Cost
Example calculation: A team running 1,000 incidents per year at $5,000 per incident-hour, achieving a 65% MTTR reduction on a $1.5M platform.
Savings = 0.65 × 1,000 × $5,000 = $3.25M gross savings
Net annual savings = $3.25M minus $1.5M = $1.75M per year
These aren’t hypothetical figures. Splunk’s AIOps Impact Study 2026, drawing on ROI models from 100 customer deployments, found an average of $1.2 million in annual savings per enterprise. IBM Instana’s 2026 case studies across 50 customers documented a 300% ROI within 18 months for organizations that reached Level 4 maturity.
The key qualifier in both datasets: ROI numbers improve dramatically with maturity level. Teams stuck at Level 2 report near-zero measurable return. Teams at Level 4 and above hit the headline numbers. This is why the maturity model matters as a planning tool, not just a diagnostic.
For C-suite justification, the Dynatrace benchmark data offers the clearest single number: average MTTR drops from 4 hours to 1.4 hours with mature AIOps. At enterprise scale, that 2.6-hour difference across hundreds of incidents per year generates the million-dollar savings figures consistently.
The Contrarian View: Real Limits of AIOps Self-Healing
Every article covering AIOps self-healing should include this section, and most don’t. The technology works, and the numbers are real. They’re also conditional, and understanding the conditions is what separates realistic project planning from expensive disappointment.
The 90% Accuracy Ceiling
Dr. Fei Tony Liu’s research at Stanford, published in NeurIPS 2025 proceedings, found that prediction accuracy in AIOps systems plateaus around 90% without causal inference. Correlation-based models learn patterns in historical data well, but fail on novel failure modes. In high-change environments, where infrastructure evolves faster than models can be retrained, false positive rates climb materially.
The Data Quality Tax
The MIT Technology Review’s February 2026 analysis of self-healing limits focused specifically on data quality as the primary bottleneck. Inconsistent labeling, gaps in telemetry coverage, and legacy systems that don’t emit structured logs all degrade model quality faster than any vendor feature set can compensate. The hidden cost of AIOps is often not the platform license. It’s the six-to-twelve months of data infrastructure work that has to happen first.
The Total Cost of Ownership Gap
McKinsey’s research estimates that total cost of ownership runs approximately two times the sticker price, after model tuning, integration engineering, and retraining operations are accounted for. Platform license: $500,000 per year. Realistic TCO including people and process: $1 million plus. Organizations that budget only for the license typically run out of runway before reaching the maturity level where ROI materializes.
Skills reality check: Moving to AIOps requires a shift toward causal ML skills, data pipeline engineering, and Python-fluent SRE practitioners. This isn’t a tool you buy and hand to your existing Level 1 support team. Budget for at least $200,000 in retraining or new hires before the platform delivers on its headline numbers.
The Greenfield Advantage
The 50-70% automation figures cited in most vendor literature apply to greenfield Kubernetes environments with modern telemetry stacks. Legacy systems, monolithic architectures, and environments without structured logging consistently underperform these benchmarks by a wide margin. If your infrastructure predates 2020, plan for a longer runway and more conservative ROI projections.
Frequently Asked Questions
Self-healing infrastructure refers to systems that automatically detect anomalies, predict failure states, and execute remediation actions without requiring human intervention. The process runs on machine learning models that analyze telemetry data including logs, metrics, and distributed traces in real time.
A practical example: a Kubernetes deployment that detects memory pressure on a pod, predicts that it will hit an OOM event in the next 15 minutes based on historical patterns, and automatically schedules a restart during a low-traffic window before the event occurs. According to a ResearchGate study from January 2026, mature self-healing systems autonomously resolve 82% of incidents at this level.
AIOps enables self-healing through three sequential capabilities: detection (anomaly ML models that identify deviations from learned baselines), prediction (time-series forecasting models that flag likely failure windows before they occur), and remediation (orchestrated runbooks or Kubernetes operators that execute pre-approved fixes automatically).
The integration with Kubernetes operators and GitOps tools like ArgoCD is what makes remediation auditable and reversible, which is a prerequisite for production-grade deployment. The CNCF GitOps whitepaper 2026 covers the integration standards in detail.
Dynatrace leads on raw prediction accuracy (92%) and is the best fit for large Kubernetes environments running complex microservices. Splunk’s IT Service Intelligence platform is the strongest choice for organizations with a FinOps focus and hybrid cloud estates. New Relic offers the best price-to-performance ratio for mid-market teams.
IBM Instana is the default for heavily regulated industries or organizations already running IBM infrastructure. Rankings are derived from Forrester Wave Q1 2026 combined with vendor benchmark reports.
Data silos are the primary failure cause, accounting for 28% of failed projects per Forrester Q1 2026. When logs, metrics, and traces live in disconnected systems, ML models receive inconsistent training data and produce unreliable results.
The next major challenges are skills gaps (teams need ML and data pipeline engineering capabilities that most traditional SRE teams don’t have), false positive rates in noisy environments, and total cost of ownership that typically runs 2x the platform license price when integration and retraining costs are included.
Mature AIOps self-healing reduces MTTR by an average of 65%, cutting resolution time from 4 hours to approximately 1.4 hours, according to Dynatrace’s 2026 State of AIOps Report, which benchmarked 1,200 production deployments.
These figures apply to organizations at Level 4 maturity or above. Teams at Level 2 see modest improvements. The benchmark also assumes modern, cloud-native infrastructure. Legacy environments with gaps in telemetry coverage typically see 30 to 45% MTTR reductions rather than 65%.
Yes, for teams with the right infrastructure prerequisites. Half of Fortune 500 companies are already running AIOps in production as of Q1 2026, per Deloitte’s AIOps Adoption Survey.
The practical recommendation for teams not yet at Level 4: deploy in shadow mode first. Run autonomous remediation in parallel with production traffic for a minimum of two weeks, logging every action the system would have taken without executing it. Review those logs with your on-call team before enabling live automation. This approach catches misconfigured runbooks before they cause cascading failures.
Organizations at Level 4 AIOps maturity achieve a 300% ROI within 18 months, according to IBM Instana case studies across 50 enterprise customers. The average annual saving across Splunk’s 100-customer benchmark is $1.2 million per enterprise.
The ROI formula is: Annual Savings = (MTTR Reduction Percentage × Incidents Per Year × Cost Per Incident Hour) minus Platform Cost. A team running 1,000 incidents yearly at $5,000 per incident-hour and achieving 65% MTTR reduction generates $3.25 million in gross savings before platform costs.
AIOps integrates with DevOps via two primary pathways. GitOps integration (using tools like ArgoCD) stores remediation runbooks in version-controlled repositories, ensuring every autonomous action is tracked, reviewed, and reversible. CI/CD integration allows ML models to be updated and validated through the same deployment pipelines as application code.
The practical effect is a self-healing pipeline: when a deployment introduces a regression, the AIOps layer detects the anomaly, the GitOps runbook rolls back the change, and the CI/CD pipeline flags the build automatically. The CNCF GitOps for AIOps whitepaper provides the integration standards most production teams follow.
The Infrastructure-First Conclusion
The pattern across every dataset reviewed for this article is consistent. AIOps self-healing infrastructure works, and it works well, but only after the foundational data work is done. The 65% MTTR reductions and 300% ROI figures are real. They belong to the 17% of enterprises currently at Level 4 or 5 maturity, not to the 55% still running reactive operations with fragmented telemetry.
For technologists, the path forward runs through OpenTelemetry unification, causal ML skill development, and shadow-mode discipline before live remediation. For C-suite decision-makers, the budget conversation needs to include TCO, not just license cost. For founders building in this space, the greenfield opportunity is in mid-market organizations that enterprise vendors have underserved. For investors, a $25 billion market growing at 30% annually with a 28% failure rate is exactly the kind of space where implementation-focused companies can build durable moats.
Three developments are worth watching closely through the rest of 2026: vendor consolidation accelerating as smaller AIOps players get acquired into observability platforms, regulatory pressure from frameworks like NIST’s AI Risk Management Framework requiring auditability for autonomous IT actions, and edge AI bringing self-healing capabilities to distributed infrastructure outside the data center. Organizations that build solid data pipelines and GitOps discipline now will be positioned to absorb all three shifts without starting from scratch.
Disclaimer
This article is produced for informational purposes only. All statistics, vendor performance figures, and ROI projections cited are sourced from publicly available analyst reports, peer-reviewed research, and vendor-published benchmarks as of March 2026. NeuralWired does not receive compensation from any vendor mentioned in this article. Vendor rankings are based on independently weighted criteria and do not constitute a purchasing recommendation. Market conditions, product capabilities, and pricing may have changed since publication. Readers should conduct independent due diligence before making procurement or investment decisions. Links to third-party sources are provided for reference; NeuralWired is not responsible for the accuracy or availability of external content.
Most enterprise AI projects die between the proof of concept and production. This is not a technology problem. It is an operational one. Here is the framework that separates companies stuck in pilot purgatory from those capturing real revenue.
NW
NeuralWired Editorial Team
Research-Backed Analysis · Enterprise AI
70%
of enterprise AI projects fail to scale beyond pilots
4/33
prototypes reach production in many enterprise environments
3×
revenue impact when AI is embedded into core workflows
Somewhere between the impressive demo and the production dashboard, most enterprise AI projects disappear. Not with a bang, but quietly: a pilot that never graduated, a proof of concept that “needs more work,” a steering committee that stopped meeting. This is pilot purgatory, and in 2026, it is where the majority of corporate AI investment ends up.
This analysis breaks down exactly why that happens, and what the companies that do scale AI successfully do differently. You will find a root-cause taxonomy of pilot failure, a practical workflow redesign playbook, an ownership framework, a 5-level maturity scorecard, and a 90-day sprint plan you can use immediately. Every section is grounded in research from IBM, Harvard Business School, KPMG, Gartner, and MIT SMR.
The thesis is simple: learning how to scale AI in business is not primarily a technology challenge. It is an operational design challenge. And that is both the bad news and the good news — because operational design is something you can actually fix.
The Pilot Purgatory Problem
The term “pilot purgatory” describes a specific organizational failure mode: AI projects that have working proofs of concept but cannot transition into stable, enterprise-grade production. They linger. Teams get reassigned. Budgets dry up. The technology gets blamed, even though the technology was never the real bottleneck.
It is more widespread than most executives want to admit. A 2026 analysis citing Gartner data found that only about 4 of 33 prototypes make it into production across enterprise portfolios. Astrafy’s practitioner research puts the production success rate at roughly one third. The range across studies varies, but the direction is consistent: most AI initiatives stall before they generate real business value.
AI pilots that stall before production67-88%
GenAI POCs abandoned after prototype30%
Companies investing in GenAI by 202672%
SMBs reporting revenue growth from AI93%
The gap between the 72% of businesses expected to invest in generative AI and the small fraction that will actually derive sustained value from it represents one of the most significant misallocations of corporate capital in the current technology cycle.
The conventional diagnosis of pilot failure focuses on model quality, data availability, or compute costs. Those factors are real, but they rarely explain why a working pilot does not make it to production. The deeper causes are organizational. Here are the six that appear most consistently across research.
01
No Hard Business Owner
Pilots run as IT experiments without a P&L-owning sponsor accountable for outcomes. When no one owns the result, no one fights for the resources to scale.
Either no guardrails exist and compliance blocks rollout, or overly rigid policies make experimentation impossible. Both kill momentum in different ways.
“Scaling AI effectively is not about the technology alone. It is about aligning the potential of AI with the core of your business.”
Board of Innovation strategy team, Scaling AI: 5 Practical Steps
Notice what is absent from that list: bad model performance, insufficient data volume, or inadequate compute. Those are solvable technical problems. The six causes above are organizational design problems — and they are far more persistent because they require leadership commitment, not just engineering effort.
How to Scale AI in Business: Workflow Redesign First
The most common implementation mistake is treating AI as a task replacement rather than a workflow transformation. A company that deploys an AI model to generate draft emails has automated a step. A company that redesigns its entire customer communication process around AI-assisted drafting, human review triggers, and outcome tracking has actually changed how work gets done. Only the second approach generates compounding returns.
KPMG’s From Pilots to Production framework stresses that the transition from experimentation to scaled value requires redesigning end-to-end processes, not patching individual tasks. Here is a four-step approach to doing that:
1
Map the Current Process End to End
Document every step, system, handoff, and role in the workflow you are targeting. Do not skip this. Most pilots fail because teams automate based on assumptions about the process rather than how it actually runs.
2
Identify AI Intervention Points
Where in the flow can an AI agent change a decision, accelerate a handoff, or surface information that currently requires manual lookup? These are your high-value insertion points.
3
Redesign Roles and Handoffs
Define what AI agents own, what humans supervise, and what triggers escalation. Build a clear RACI. If nobody owns the output of an AI step, adoption will crater regardless of model quality.
4
Instrument the Workflow
Attach specific KPIs to each AI-assisted step: cycle time, error rate, user satisfaction, and margin impact. Align incentives so that the teams using AI are rewarded for the outcomes it enables, not just for using the tool.
Harvard Business School research highlights that adoption rates in initial pilots are the primary predictor of scale-up success. If users are not actually using the pilot, no amount of technical refinement will fix it. The workflow redesign step is where you address the root cause of low adoption before it becomes a production problem.
Ownership and Operating Models That Work
One of the clearest findings across enterprise AI research is that the organizational structure you choose determines scaling outcomes as much as any technical decision. Companies that scale AI successfully do not leave it in IT. They build dedicated operating structures that connect technology, business ownership, and governance.
The AI Studio / Center of Excellence Model
PwC recommends a centralized “AI studio” approach that brings together talent, tools, and governance under one structure, even for smaller organizations. IBM calls this an AI Center of Excellence. The naming varies; the principle does not.
The core roles that need to be defined:
Business Sponsor: A P&L-owning executive who is accountable for the ROI of each AI product. Not a cheerleader — an owner.
AI Product Owner: Manages the roadmap, prioritizes use cases, and maintains the bridge between technical teams and business stakeholders.
Tech Lead (MLOps/Engineering): Owns the pipeline, model registry, deployment infrastructure, and monitoring systems.
Risk and Compliance Representative: Embedded from the start, not called in at the end. Governance retrofitted after deployment is the most expensive kind.
Change Manager: Owns training, communication, and the adoption programs that determine whether employees actually use the AI products you build.
The structure that tends to work at scale is a hybrid: a centralized AI studio that owns platform, standards, and governance; combined with federated product teams that own domain-specific AI applications but conform to the common guardrails the studio sets. The CoE does not build every AI product. It makes every product team capable of building well.
“We are past the demo phase. Companies that built foundational infrastructure in 2024 and 2025 are now seeing real ROI. Those that did not are stuck in pilot purgatory.”
Iavor Bojinov, Professor of Business Administration, Harvard Business School — Scaling AI: A 6-Part Framework
MLOps: The Assembly Line Most Companies Skip
A model that works in a notebook is not a product. The gap between a working prototype and a reliable production system is where most AI programs die, and the discipline that bridges that gap is MLOps: machine learning operations.
Model Registry: A version-controlled catalog of every model in development and production, with metadata, performance benchmarks, and lineage.
CI/CD for Models: Automated testing and deployment pipelines so that updates can be pushed safely and quickly without manual intervention each time.
Monitoring and Drift Detection: Real-time tracking of model performance against production data, with alerts when accuracy degrades or data distributions shift.
Data Pipeline Reliability: Production-grade data ingestion, validation, and lineage tracking so models are always working with the data quality they need.
Audit Logging: A complete record of model decisions and system behavior, essential for governance, compliance, and incident response.
Astrafy’s practitioner research frames MLOps as the “assembly line” that separates AI factories from AI hobbyists. Organizations that treat model deployment as a one-time engineering task rather than a repeatable operational process will keep rebuilding from scratch with every new use case, multiplying costs and compounding risk.
Governance Guardrails in Practice
Governance is the word that makes AI teams nervous because it sounds like the thing that will slow everything down. Done badly, it does. Done well, it is what allows you to move fast without creating compliance emergencies that shut your program down entirely.
The key insight from IBM’s enterprise AI guidance is that governance needs to be integrated from the outset, not retrofitted after pilots. Retrofitting governance is expensive, disruptive, and usually means tearing apart systems that were built without it in mind.
A governance stack that actually works has four layers:
Policy
High-level principles covering fairness, transparency, data use, and the conditions under which humans must remain in the decision loop. These should be written in plain language and signed off by the board or a senior leadership committee, not buried in IT policy documents.
Controls
Approval workflows, model risk classification (low, medium, high impact), mandatory testing gates before production deployment, and specific requirements around human oversight for high-stakes decisions.
Tooling
The technical infrastructure that enforces controls: model registry with risk classification, audit logging, explainability tools for regulated use cases, and data lineage tracking that lets you answer “where did this model output come from?”
Metrics
IBM recommends tracking three categories of KPIs simultaneously: model KPIs (accuracy, drift, latency), business KPIs (revenue, cost, user satisfaction), and risk KPIs (incident count, policy violations, audit findings). If you are only tracking the first category, you are missing the signals that matter to the people approving your budget.
Reality Check
Emerging regulatory frameworks including the EU AI Act and NIST AI Risk Management Framework are beginning to reward organizations with strong, documented governance. KPMG’s analysis notes that governance infrastructure built today becomes a competitive asset as regulation tightens.
AI Maturity Scorecard: Levels 1 to 5
Before you can plan a path forward, you need an honest assessment of where you are. This five-level maturity framework synthesizes guidance from IJERET’s academic research, HBS’s governance framework, IBM, and KPMG. Use it as a diagnostic, not a report card.
Level
Label
Ownership
MLOps
Governance
Outcome
L1
Ad-Hoc Pilots
IT experiments, no sponsor
None
None
Isolated demos, no production
L2
Repeatable Pilots
Some shared tooling
Minimal
Ad hoc
Faster pilots, still no scale
L3
Production Islands
Fragmented by team
Basic monitoring
Partial
A few AI products live
L4
Managed Portfolio
Central AI CoE, clear roles
Consistent pipelines
Documented, enforced
Measurable ROI, expanding
L5
AI-Native Operations
Board-level oversight
Automated, optimizing
Continuous improvement
AI embedded in core workflows
Most enterprises that have been running AI programs for a year or more are sitting at Level 2 or Level 3. The jump from Level 3 to Level 4 is where the operational transformation actually happens, and it requires deliberate investment in ownership structure, MLOps, and governance simultaneously. Companies that try to move only one dimension at a time tend to stall.
Diagnostic questions to locate yourself honestly: Do you have a model registry? Are adoption rates for AI features tracked and reviewed by leadership? Does each AI product have a named business owner with a budget line? Can you answer a compliance audit question about any model in production within 24 hours? If the answer to any of these is no, you are probably not yet at Level 4.
The 90-Day Scale-Up Sprint
Strategy without execution is just a document. This 90-day sprint template translates the frameworks above into a concrete sequence, drawing on guidance from Harvard Business School and IBM’s scaling playbook. It is designed for organizations currently sitting at Level 2 or Level 3 and targeting Level 4.
W1
Weeks 1 to 3: Portfolio Triage and Sponsor Assignment
Review your existing AI pilots and score them on two dimensions: business impact potential and current adoption rate. Select one to two pilots that have demonstrated genuine user engagement. Assign a named business sponsor to each with explicit accountability for the outcome. Define three to five measurable KPIs for each initiative before moving forward.
W2
Weeks 4 to 6: Workflow Redesign and MLOps Foundation
Run the four-step workflow redesign process for each selected pilot. Simultaneously, stand up a minimal MLOps stack: a model registry, basic CI/CD pipelines, and monitoring dashboards. Document your risk controls for each initiative and get sign-off from compliance and legal before proceeding to production integration.
W3
Weeks 7 to 9: Controlled Production Rollout
Integrate your selected pilots with production systems. Use a canary deployment approach: roll out to 10 to 20% of users or transactions first, monitor the KPIs you defined in Week 1, and only expand when the data confirms the system is performing as expected. Track adoption rates weekly.
W4
Weeks 10 to 12: Harden, Expand, and Codify
Harden governance documentation, expand rollout to full user base or additional markets, and run a retrospective that captures what worked. Turn the lessons into reusable templates and standards that your AI CoE can apply to the next wave of initiatives. This is how you build the compounding capability advantage.
Measuring the ROI of AI in Business
One of the most consistent problems in enterprise AI programs is that ROI is declared based on theoretical efficiency gains rather than measured business outcomes. A model that could save 10 hours per week per analyst is not delivering ROI unless those hours are being redirected to higher-value work and that value is being captured somewhere.
HBS’s governance framework emphasizes linking AI initiatives to specific business KPIs from the start of the program, not after the fact. Here is what that looks like in practice:
Category
Example KPIs
Measurement Approach
Revenue
Conversion rate, deal size, upsell rate
A/B comparison of AI-assisted vs. baseline cohorts
Cost
Process cycle time, error rate, headcount efficiency
The companies that do not see those returns are typically measuring the wrong things, or not measuring at all. Adopting an outcomes-first measurement framework from the beginning is one of the simplest structural changes a program can make with outsized impact on long-term success.
Frequently Asked Questions
These are the questions decision-makers ask most frequently when working through how to scale AI in business.
Most AI pilots fail to scale because they lack a clear business owner, are not embedded into redesigned workflows, and operate without robust MLOps and governance. The result is low adoption, model drift, and eventual abandonment.
MIT Sloan Management Review research found that 65% of failed scaling efforts attributed the failure to organizational and people-related challenges, not technical limitations. Only about one third of AI initiatives reach production across industries.
AI pilot purgatory describes the state where AI projects have working proofs of concept but cannot transition into stable, enterprise production. They linger in experimentation indefinitely, consuming budget without generating business value.
Gartner-cited analysis shows only 4 of 33 prototypes may reach production in some enterprise environments, and 30% of generative AI projects are abandoned after the proof-of-concept phase.
The most reliable path starts with selecting pilots that already have strong user adoption, then redesigning the surrounding workflow rather than just automating isolated tasks. From there, organizations need to establish a clear ownership structure (AI CoE or AI studio), build a minimal MLOps pipeline, and embed governance from day one.
Frameworks from IBM, KPMG, and Harvard Business School all emphasize phased scaling, governance, and operational readiness as prerequisites, not nice-to-haves.
An AI operating model defines how an organization structures roles, processes, and technology to develop, deploy, and govern AI products. It covers ownership, funding, decision rights, and how AI capabilities are distributed across business units.
MLOps provides the “assembly line” that moves AI models from experimentation to reliable production through automated versioning, testing, deployment, and monitoring. Without it, deployments are manual, models drift without detection, and retraining is reactive rather than systematic.
ROI should be measured by linking AI initiatives to specific business KPIs, revenue growth, cost reduction, productivity gains, or risk mitigation — and tracking those metrics against pre-AI baselines. Adoption rate is also a critical leading indicator.
Research summarizing Upwork and PwC data found that 93% of SMBs using operationalized AI reported revenue growth and 82% reported cost reductions, demonstrating what measured, embedded AI can deliver.
Effective AI scaling requires a four-layer governance stack: policies for responsible use (fairness, transparency, data rights), risk-based model classification and mandatory testing controls, technical tooling (model registry, audit logging, explainability), and continuous metrics tracking across model performance, business outcomes, and risk indicators.
IBM and HBS both stress integrating governance from the start of the program, not retrofitting it after pilots are already in production.
A well-resourced organization moving from Level 2 or 3 to Level 4 maturity can achieve meaningful production deployments within 90 days using the sprint framework outlined in this article. Moving to Level 5 (AI-native operations) typically takes multiple years, especially in regulated industries.
KPMG’s analysis and academic frameworks both suggest that the jump from managed portfolio to AI-native operations requires sustained multi-year commitment to platform, culture, and governance, not just a series of sprints.
The Operational Gap Is the Competitive Gap
The pattern across enterprise AI research is consistent: success in scaling AI depends less on which model you chose than on whether your organization was operationally prepared to carry it into production. Companies that build the ownership structures, workflow redesign disciplines, MLOps pipelines, and governance guardrails before they need them are the ones generating real returns. Everyone else is running expensive demos.
This matters beyond any single AI program. As autonomous systems become embedded across industries, the competitive advantage shifts from access to technology, which commoditizes, to organizational readiness to deploy it reliably. The gap between prepared and unprepared organizations will define market positioning through the remainder of this decade. Gartner expects 72% of businesses to invest in generative AI by 2026. The fraction that will actually scale it is far smaller, and that fraction will capture disproportionate value.
Three things to watch as this dynamic plays out: first, vendor consolidation around MLOps and governance platforms as enterprises demand integrated operational infrastructure rather than point solutions. Second, regulatory pressure intensifying around AI explainability and audit trails, rewarding organizations that built governance early. Third, a growing talent premium on the skills that actually drive scaling, MLOps engineers, AI product managers, and change specialists, rather than pure model researchers. Organizations that build those capabilities now, not when they feel urgent, will be best positioned to compound the advantage.
The 90-day sprint framework in this article is a starting point. The real work is building the organizational muscle to repeat it, refine it, and apply it across an expanding portfolio of AI use cases. That is what separates pilot experiments from genuine transformation.
About NeuralWired
Research-backed analysis for technology decision-makers.
NeuralWired is a Tier 1 technology publication covering artificial intelligence, enterprise software, and the policy landscape shaping the digital economy. Our editorial mission sits at the intersection of TechCrunch’s velocity, Wired’s depth, and MIT Technology Review’s rigor. We write for technologists, executives, founders, policy professionals, and investors who need analysis that holds up, not headlines that inflate and vanish. Every article is grounded in primary sources, quantified data, and perspectives from practitioners working at the frontier. If you found this analysis useful, explore our full coverage at neuralwired.com.
Editorial Disclaimer
This article is produced by NeuralWired’s editorial team for informational and analytical purposes only. It does not constitute financial, legal, or professional advice. Statistics and research findings are cited from publicly available sources as noted in the article; readers are encouraged to consult primary sources directly for the most current data. NeuralWired does not have commercial relationships with any organizations mentioned in this article, and no part of this analysis constitutes a product endorsement. Views expressed represent the editorial team’s synthesis of available research as of the publication date. Technology landscapes evolve rapidly; specific figures and forecasts should be verified against current sources before informing business decisions.
Hybrid Quantum-Classical Computing: The Enterprise Entry Point to Quantum in 2026NeuralWiredEnterprise Technology · March 2026
Quantum Computing · Enterprise Strategy
Forget the “quantum someday” narrative. Hybrid quantum-classical architecture is now the default infrastructure model, and the enterprises running pilots on IBM, AWS Braket, and Azure Quantum are building durable competitive advantage right now.
By NeuralWired StaffMarch 28, 2026Reading time: ~14 minCategory: Enterprise Quantum
The most expensive mistake enterprise technology leaders make with quantum computing is not investing too early; it is waiting for a “pure quantum” future that is not coming anytime soon. Hybrid quantum-classical computing, the model where classical processors handle orchestration and data while quantum hardware executes targeted computational kernels, has quietly become the industry’s working architecture. And 2026 is the year the evidence became impossible to ignore.
This article gives you what vendor marketing will not: a vendor-neutral playbook for understanding hybrid quantum-classical computing, selecting the right workloads, choosing between IBM, AWS, and Azure, designing your first pilot, and managing the real costs and risks. Whether you are a CTO asking how quantum plugs into your cloud stack, a Chief Data Officer evaluating which workflows benefit now, or a strategy lead stress-testing timelines, this is the guide you need.
2026Year Fujitsu predicts hybrid becomes the industry standard
4Key 2026 quantum trends by Quandela, hybrid is #1
10hMax managed hybrid job runtime on Amazon Braket
3Cloud platforms (IBM / AWS / Azure) with production hybrid services today
1. What Hybrid Quantum-Classical Computing Actually Means for Your Business
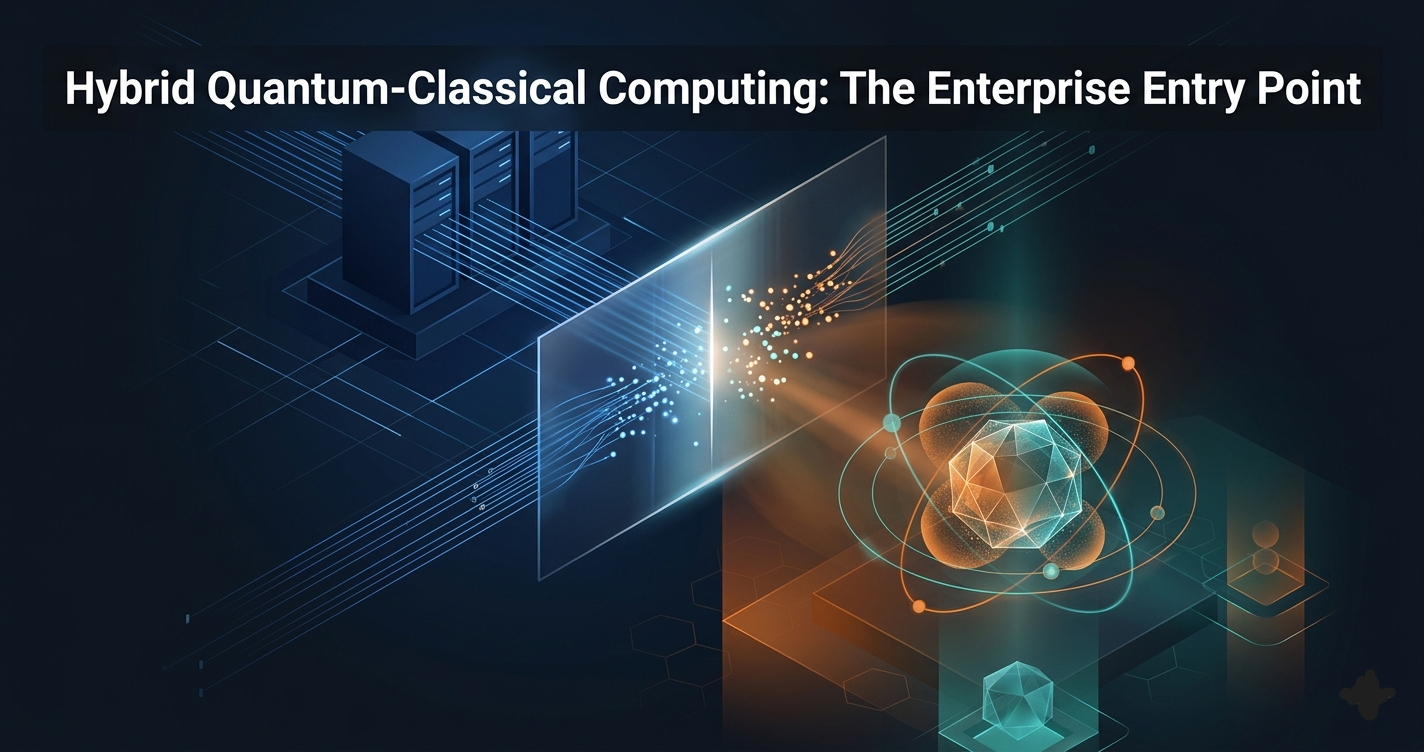
Strip away the physics and hybrid quantum-classical computing follows a surprisingly intuitive logic. A classical system, running on your existing cloud or HPC infrastructure, handles the heavy lifting of data preparation, parameter management, and result interpretation. A quantum processor is invoked for specific sub-tasks it handles exceptionally well: evaluating a cost function over a combinatorial search space, simulating molecular energy states, or computing a high-dimensional kernel. The two systems exchange information in a loop until the solution converges.
A 2025 enterprise strategy analysis describes this precisely: classical systems embed quantum kernels within larger workflows for combinatorial optimization, quantum chemistry simulation, and machine learning feature spaces. The quantum device does not replace your stack. It accelerates the hardest slice of a well-defined problem.
“Some really interesting features of quantum computing start to become available if you can do classical computation at the same time you’re doing quantum computation. You’re just alternating between the two.”
Joe Fitzsimons, Founder & CEO, Horizon Quantum Computing, via InformationWeek
Fitzsimons’s framing is useful because it reframes hybrid not as a workaround for immature hardware but as a principled architectural pattern. Classical computers avoid decoherence and can access large datasets; quantum processors offer computational advantages for specific problem classes. Hybrid loops exploit both strengths simultaneously.
Current NISQ (Noisy Intermediate-Scale Quantum) devices make hybrid practically mandatory: limited qubit counts and error rates mean quantum hardware cannot run most problems end-to-end. Classical systems handle error mitigation, pre-processing, and post-processing around a quantum core. But even in fault-tolerant regimes years from now, most real-world workloads will still require hybrid architectures. The nature of business problems almost always involves classical data pipelines, governance layers, and integration requirements that quantum hardware alone cannot satisfy.
Orchestration on AWS Lambda/EC2, IBM Cloud, or Azure Functions: scheduling, parameter optimization, retry logic, logging
↕
✦
Quantum Execution Layer
Gate-based QPUs or annealers (or high-fidelity simulators) invoked via Qiskit Runtime, Amazon Braket, or Azure Quantum APIs
↕
☷
Data Layer
Classical storage (S3, databases, warehouses): summarizes problem instances into quantum-compatible representations and collects outputs
2. Which Enterprise Use Cases Benefit from Hybrid Quantum-Classical Today
Not every hard problem is a quantum problem. The honest answer is that most workloads running in your organization today have no near-term quantum angle. But a meaningful subset, particularly those with combinatorial explosion, quantum-mechanical structure, or high-dimensional feature spaces, are legitimate candidates for hybrid acceleration right now.
Optimization: The strongest near-term signal
Combinatorial optimization is where hybrid quantum approaches have the most production evidence. Case studies involving BASF’s use of D-Wave hybrid quantum solvers for logistics and production scheduling showed results competitive with industry-grade classical solvers. This is a significant finding: not dramatically better, but comparable, and the performance gap is expected to widen as hardware improves. For organizations where logistics, vehicle routing, supply chain scheduling, or financial portfolio construction represent a core cost driver, that competitive parity today translates into meaningful advantage as the technology matures.
Chemistry and materials simulation
IBM’s 2026 quantum-centric supercomputing blueprint specifically targets chemistry and materials science as a key workload domain, with hybrid workflows already operating in production-adjacent settings alongside RIKEN’s environment and the Fugaku supercomputer. Pharmaceutical companies, materials manufacturers, and energy firms running classical density functional theory or molecular dynamics simulations should treat hybrid quantum chemistry as a near-term R&D investment, not a 2030 concept.
Quantum-enhanced machine learning
A 2024 reference architecture for hybrid quantum-classical business intelligence describes practical integration of quantum neural networks, quantum SVMs, quantum PCA, and QAOA-based optimization into classical ML pipelines. This is early-stage but no longer theoretical; it is being formalized into reference architectures that engineering teams can implement today.
3. IBM vs. AWS vs. Azure: Choosing Your Hybrid Quantum-Classical Platform
One gap that existing content almost never fills is a vendor-neutral comparison of how the three major cloud platforms actually differ in their hybrid quantum offerings. They are not interchangeable, and choosing the wrong platform for your organization’s existing stack creates integration overhead that can swamp the performance benefits you are chasing.
Dimension
IBM Quantum (Quantum-Centric)
AWS Braket
Azure Quantum
Primary model
Orchestrated hybrid workflows via Qiskit Runtime, integrated with IBM Cloud and HPC environments (RIKEN, Fugaku)
Managed Hybrid Jobs with QPUs and simulators, tightly integrated with AWS services (EC2, Lambda, S3)
Multi-vendor quantum backends with Azure Resource Manager integration; orchestration via Azure Functions and Logic Apps
Key hybrid features
Middleware for Quantum, unified CPU/GPU/QPU workflows, open Qiskit framework
Hybrid Jobs, embedded simulators (SV1, DM1, TN1), prioritized QPU access, job run times up to 10 hours
Research-heavy orgs, IBM Cloud-invested enterprises, HPC-adjacent workloads in chemistry or materials
Cloud-native AWS shops, data-science teams running variational algorithms, teams wanting managed infrastructure
Microsoft-centric IT organizations, Azure-heavy environments, teams wanting hardware vendor diversity
Cost model
Per-QPU-second, subscription tiers, access via IBM Cloud credits
Per-task / per-shot pricing; simulators billed per minute; Hybrid Jobs billed on runtime
Credits plus pay-per-use; pricing varies by hardware provider backend
The AWS angle deserves specific attention for cost-conscious pilots. Braket’s embedded simulators, SV1 (state vector), DM1 (density matrix), and TN1 (tensor network), let teams run and refine algorithms at simulation cost before committing to QPU pricing. This “pay-as-you-simulate” model is the most practical cost-control lever available to enterprise teams today. You validate circuit designs, tune hyperparameters, and establish classical baselines entirely in software, then selectively move to quantum hardware for benchmarking runs.
IBM’s approach is architecturally different: its Middleware for Quantum platform treats orchestration as a first-class concern, with unified scheduling and logging across classical and quantum compute. For enterprises where hybrid workflows need to integrate with existing HPC environments or where reproducibility and auditability are non-negotiable, this middleware layer matters more than raw QPU performance.
The architecture brings quantum and classical systems together into a unified computing environment, with coordinated workflows spanning both, and open frameworks like Qiskit providing access through familiar tools.
IBM Research Team, IBM 2026 Quantum-Centric Supercomputing Blueprint
4. The 4-Step Enterprise Pilot Framework for Hybrid Quantum-Classical Computing
The largest gap in existing coverage is not technical explanation; it is actionable guidance on how to actually run a hybrid quantum pilot without burning budget on a poorly scoped experiment. Here is a structured framework grounded in current best practices from IBM, AWS, and enterprise strategy research.
4-Step Hybrid Quantum Pilot Framework
Step 1: Identify and prioritize candidate workloads
Apply a three-axis filter: (1) does the problem have combinatorial explosion, quantum-mechanical structure, or high-dimensional feature spaces? (2) can it tolerate approximate or heuristic answers? (3) can data be summarized into compact quantum-compatible representations without streaming massive datasets to the quantum device? Shortlist 2 to 3 candidates with clear classical baselines already in production.
Step 2: Design the hybrid experiment
Select a cloud platform based on your existing cloud commitments and data residency requirements, not quantum hardware specifications. Decide whether to start with simulators (recommended) or QPUs. Define time budgets per job, number of optimization iterations, and your accuracy or objective-function target. Document all design decisions for governance purposes before running a single job.
Step 3: Run controlled benchmarks
Execute both classical and hybrid versions on an identical, standardized dataset. Measure time-to-solution, solution quality (objective function value), cost per run, and energy if you have carbon reporting obligations. Run multiple iterations to account for quantum noise and stochastic behavior. Collect all logs; these become your audit trail and the foundation for any future governance review.
Step 4: Evaluate ROI and decide next steps
Assess benefits including solution quality improvement, speed gains, and new capabilities against incremental cost and integration complexity. If results are promising, advance to a second-stage pilot with tighter production integration, more stringent governance, and KPI alignment to a specific business outcome. If results are inconclusive, document the negative result and revisit in 12 to 18 months as hardware improves.
Workload selection: the three-axis filter
The first step is the highest-leverage decision in any pilot. Enterprise strategy research on hybrid workloads consistently shows that the most common failure mode is selecting problems with the wrong mathematical structure, specifically problems where classical solvers are already near-optimal and quantum provides no meaningful search space advantage.
The three axes to evaluate are: Structure and complexity (combinatorial explosion, quantum-mechanical modeling, or high-dimensional ML spaces); tolerance for approximate answers (logistics cost reduction does not require exact optimality, because better heuristics are valuable); and integration feasibility (data must be summarizable into small quantum-compatible state representations, and data loading overhead is one of the primary performance bottlenecks in current hybrid systems).
Cost model: budgeting your pilot
Costs on quantum cloud platforms depend on device type (simulator vs QPU), job duration, number of shots per circuit, and priority queueing. Amazon Braket positions Hybrid Jobs as an advanced service optimized for teams running variational algorithms at scale. The cost-control path is to prototype entirely on simulators, tune parameters until convergence behavior is stable, then run a bounded set of QPU runs for benchmarking. Total cost for a well-scoped pilot should be comparable to a small ML infrastructure experiment, not a capital budget item.
AWS architecture guidance also recommends using high-CPU/GPU classical instances for heavy numerical pre/post-processing and minimizing data transfer between quantum and classical components. These two design decisions can meaningfully reduce both latency and cost in production-adjacent pilots.
5. Governance, Risk, and the Compliance Realities Nobody Mentions
Vendor content almost universally underplays organizational risk in hybrid quantum deployments. The emerging research on hybrid quantum governance challenges identifies several issues that technology leaders should address before any pilot reaches production.
Governance checklist
Hybrid Quantum Governance Checklist
Model validation: Maintain classical reference methods and compare outputs statistically on every run. Track performance over time as hardware calibration, compiler versions, and cloud service configurations change. Quantum results are not stable across firmware updates.
Data governance: Clarify where data is stored and processed (region, provider), how it is anonymized or aggregated before quantum device access, and how outputs are retained. Hybrid architectures can span multiple jurisdictions; confirm compliance with GDPR, CCPA, or sector-specific data residency requirements.
Operational risk: Define failure modes for quantum devices (queue delays, calibration drift, device unavailability) and codify fallback policies to classical execution paths. Implement change management for algorithm and parameter updates, as these affect output validity and may require re-validation.
Auditability: Design pilots to be auditable from day one. Log all job parameters, device identifiers, shot counts, and result distributions. Quantum-enhanced decision systems will face growing scrutiny from regulators, particularly in financial services, healthcare, and critical infrastructure.
Energy and sustainability: A hybrid intelligence framework proposes dynamically routing workloads between simulators and quantum hardware based on energy budgets and carbon thresholds. For organizations with ESG reporting obligations, this layer matters because quantum hardware is cryogenically cooled and energy-intensive.
The jurisdictional complexity deserves extra attention. In a typical hybrid deployment, data may reside in an S3 bucket in one AWS region, classical control logic runs on EC2 in another, and quantum execution happens on a QPU physically located in a third geography. This multi-location architecture raises questions about compliance, data transfer, and sovereignty that legal and compliance teams need to resolve before production deployment, not after.
Contrarian Perspective: What the optimists get wrong
Fundamental limits are real.Theoretical results show hybrid cannot beat known complexity bounds. For search problems, no hybrid approach outperforms Grover’s optimal quadratic speedup unless the classical component can already solve the problem independently. Hybrid does not create advantage from nothing.
Integration overhead is often underestimated. Data loading, orchestration complexity, and monitoring infrastructure can consume a significant portion of any performance gain in early pilots. QuEra’s technical analysis of hybrid challenges identifies bottlenecks in noise sensitivity, optimization convergence, and scalability that will not disappear with incremental hardware improvements.
Hidden costs accumulate quickly. Talent with combined quantum tooling and cloud/HPC orchestration skills commands a premium. Governance overhead, monitoring infrastructure, and the organizational change management required to integrate hybrid results into existing decision workflows may exceed cloud compute fees, especially in regulated industries.
Timeline realism matters. Fault-tolerant quantum advantage on broad enterprise workloads remains a multi-year prospect. Many organizations will stay in “advanced pilot” territory through the late 2020s. That is not a reason to avoid hybrid; it is a reason to scope pilots as learning investments, not transformation programs.
Frequently Asked Questions
What is hybrid quantum-classical computing in simple terms? +
It is a computing model where classical computers handle data preparation, parameter management, and result processing, while quantum processors execute specific high-value sub-tasks such as optimization steps or molecular simulations in a repeating loop. Enterprise strategy research describes this as embedding quantum kernels within larger classical application workflows.
Which enterprise use cases benefit most from hybrid quantum-classical workflows today? +
The strongest near-term evidence is in combinatorial optimization (routing, scheduling, portfolio construction) and quantum chemistry simulation. Fujitsu’s applied research shows early industrial traction in these categories. Quantum-enhanced ML is promising but still mostly pre-production.
Do I need a quantum supercomputer to run hybrid workflows? +
No. Enterprises access quantum devices and simulators via managed cloud services: Amazon Braket Hybrid Jobs, IBM Qiskit Runtime, and Azure Quantum all provide access without owning hardware. Equinix frames this access model as the foundation of enterprise-ready quantum deployment in 2026.
How do AWS, IBM, and Azure differ in their hybrid quantum offerings? +
How much does it cost to run hybrid quantum jobs in the cloud? +
Costs depend on device type (simulator vs QPU), job duration, and number of measurement shots. AWS’s embedded simulators offer a low-cost prototyping path before committing to QPU pricing. Well-scoped pilots should be budgeted comparably to a small ML infrastructure project, not a capital program.
What are the main challenges of deploying hybrid quantum-classical systems? +
The core technical challenges are qubit noise, data loading overhead, and optimization convergence bottlenecks. Organizationally, the harder challenges are governance (validation, auditing, compliance), talent (combined quantum and cloud skills), and integration with existing data pipelines. QuEra’s technical analysis covers the hardware-layer challenges in detail.
Will hybrid quantum-classical computing still matter once fault-tolerant quantum computers exist? +
Yes. Even in fault-tolerant regimes, most real-world workflows will combine classical data infrastructure with quantum subroutines. The hybrid architecture is not a temporary workaround; it reflects how enterprise applications are actually structured, with data pipelines, governance layers, and integration requirements that classical systems will continue to handle.
How should I frame hybrid quantum computing for my board or executive team? +
Frame it as the quantum entry point that does not require betting on future hardware. Approach budget like early AI pilots: constrained investments tied to specific business KPIs, not open-ended R&D. Quandela’s 2026 trends analysis supports positioning hybrid as a “no-regrets” option where you build organizational capability while waiting for hardware to mature.
The Bottom Line: Hybrid Quantum-Classical Computing Is Now an Infrastructure Decision, Not a Research Bet
Three things have become clear in 2026. First, hybrid quantum-classical computing is the practical architecture, the one that runs on today’s hardware, integrates with today’s cloud platforms, and produces measurable results on real optimization, simulation, and ML problems. Second, the cloud access model removes the capital barrier: IBM, AWS, and Azure all offer managed hybrid services that enterprises can pilot without owning a qubit. Third, the organizations building capability now, even through inconclusive pilots, will hold a meaningful advantage over those waiting for a “pure quantum” moment that is not coming.
The broader implication is competitive. Quantum computing is no longer a uniform horizon that all enterprises will reach simultaneously. It is becoming a capability curve, and the curve is already bending. Chemistry, logistics, finance, and any sector where combinatorial optimization drives cost structure are the early impact zones. Governance, talent, and integration, not hardware, are the real constraints on enterprise adoption speed.
What to watch next: IBM’s 2026 blueprint and the RIKEN/Fugaku deployment represent the leading edge of production-scale hybrid infrastructure. AWS’s continued expansion of Braket Hybrid Jobs and Azure’s multi-vendor backend strategy will define the competitive cloud landscape through 2027. For enterprise decision-makers, the action item is simple: identify one optimization workload, run a scoped pilot against a classical baseline, and let the data guide your roadmap. That is how every durable technology capability in enterprise history has actually been built.
Disclaimer: This article is produced by NeuralWired editorial staff for informational purposes only and does not constitute financial, legal, or technology procurement advice. Vendor capabilities, pricing, and platform features referenced herein are subject to change without notice. Readers should independently verify all specifications and conduct their own due diligence before making any technology investment decisions. All third-party trademarks, product names, and company names mentioned are the property of their respective owners. NeuralWired has no commercial relationship with IBM, AWS, Microsoft Azure, or any other vendor referenced in this article.
Chatbots answer questions. Copilots suggest next steps. AI agents actually do the work, and 44% of enterprises are already deploying them. Here’s what that means for your organization, your risks, and your next move.
By NeuralWired EditorialMarch 202614 min read
Here is a number worth sitting with: 44% of enterprises are currently deploying or actively evaluating AI agents as a core part of their AI roadmap, according to a Google Cloud survey of 3,466 global executives. That’s not a research curiosity. It’s a competitive signal. If you’re still treating AI as a chatbot upgrade, you’re already behind the organizations that have moved on to software that doesn’t just respond to instructions, but acts on them.
This is the essential distinction between the AI of 2023 and the AI agents reshaping operations in 2026. What are AI agents explained simply? They are software systems that use AI to perceive context, reason about what to do next, and take autonomous action through tools and external systems, all in pursuit of a goal you define. They don’t wait to be prompted on every step. They plan, execute, adapt, and loop back.
That shift, from AI as a conversational interface to AI as an operational actor, has profound implications for how businesses are structured, how decisions get made, and where competitive advantage will be built over the next three years. This guide cuts through the hype to give you a working definition, a clear taxonomy of enterprise agent types, concrete adoption data, and practical frameworks your teams can use today. By the end, you’ll know whether to build, buy, or wait, and what governance guardrails to put in place before you deploy anything.
44%of enterprises deploying or assessing AI agents (Google Cloud, 2026)
40–60%faster operational cycles reported by early adopters
33%faster operations for businesses leveraging AI agents vs. those that aren’t (Microsoft)
What Are AI Agents, Exactly? A Definition That Actually Holds Up
Every major technology platform now offers something called an “AI agent.” Microsoft has Copilot agents. Salesforce has Agentforce. Google Cloud has Agent Builder. The terminology is proliferating faster than the understanding of what these systems actually do, which creates real risk for leaders making procurement and strategy decisions on incomplete mental models.
Start with a working definition that synthesizes the clearest thinking from IBM, Google Cloud, and BCG: an AI agent is software that uses AI to understand a situation, decide what to do next, and take actions through tools or external systems in order to achieve a defined goal. What distinguishes an agent from any other piece of software is its autonomy over the decision-action loop. It doesn’t need a human to approve every step.
The anatomy of that loop is worth understanding. Google Cloud describes AI agents as systems that exhibit “reasoning, planning, and memory” with “a level of autonomy to make decisions, learn, and adapt.” In practice, this means: the agent perceives inputs (a user query, a database record, a system event), reasons about what action is required, calls the appropriate tool or API, observes the result, and updates its understanding before taking the next step. It’s a continuous loop, not a single response.
The contrast with chatbots and copilots is sharper than most coverage acknowledges. Here’s the honest breakdown:
Tool
What It Does
Who Drives Each Step
Memory Across Steps
Can Take Action
Chatbot
Answers questions in conversation
Human at every turn
Limited or none
Rarely
Copilot / Assistant
Suggests next steps, drafts content
Human reviews and approves
Within session
With explicit approval
AI Agent
Executes multi-step workflows toward a goal
Agent plans; human sets guardrails
Persistent, cross-session
Yes, within defined permissions
Microsoft’s WorkLab team frames it cleanly: agents can think or reason, remember context across interactions, be trained on proprietary data, and know when to escalate to a human. That last capability, knowing when to stop and ask, is what separates a well-designed agent from one that causes expensive mistakes.
“Just as every employee will have an AI assistant like Copilot, every business process will soon be transformed by agents.”
Microsoft WorkLab, “AI at Work: What Are AI Agents, and How Do They Help Businesses?” (2024)
The 4 Types of Enterprise AI Agents (And Which One You Actually Need)
Most industry taxonomies describe agents through a technical lens: reflex agents, model-based agents, goal-based agents. That framing is useful for engineers and useless for everyone else making deployment decisions. What business leaders need is a taxonomy mapped to operational reality. Here’s one that works.
Type 1: Task Agents
These automate a single, well-defined task: summarize this document, triage this support ticket, draft a response to this email. They’re narrow, fast to deploy, and low-risk. Most organizations already have these running whether they call them “agents” or not. The ROI is real but modest, primarily efficiency gains on repeated individual actions.
Type 2: Workflow Agents
Workflow agents string multiple tasks into a coherent process. An intake form triggers validation, which triggers routing, which triggers a notification and a status update, all without a human touching each handoff. This is where cycle-time gains compound. Agilesoft Labs reports that enterprises deploying workflow-level agents see 40–60% faster operational cycles and the ability to scale operations 2–3x without proportional headcount growth.
Type 3: Decision-Support Agents
These agents analyze data and propose actions with confidence scores and explanatory reasoning. Think pricing recommendations, fraud risk alerts, or clinical decision prompts. They keep a human in the loop for the final call but drastically reduce the cognitive load and time required to reach that decision. Snowflake highlights a representative use case: an agent that answers “What caused last quarter’s revenue dip?” by autonomously querying data sources, running analysis, and surfacing a structured recommendation.
Type 4: Orchestrator / Multi-Agent Systems
These are the most complex, and the most powerful. An orchestrator agent coordinates other agents, systems, and humans to complete an end-to-end goal. A loan origination orchestrator might direct a document-parsing agent, a credit-assessment agent, a compliance-check agent, and a customer-communication agent in sequence or in parallel. BCG describes this tier as “a new era in AI” that far surpasses traditional software automation in both flexibility and capability.
Agent Type
Typical Use Cases
Deployment Complexity
Time-to-Value
Task Agent
Summarization, triage, drafting
Low
Weeks
Workflow Agent
Invoice processing, onboarding, support escalation
Medium
1–3 months
Decision-Support Agent
Pricing, risk scoring, medical decision prompts
Medium-High
2–6 months
Orchestrator / Multi-Agent
End-to-end loan origination, supply chain, R&D
High
6–18 months
Where AI Agents Are Creating Real Business Value Right Now
The most credible evidence for agent ROI comes not from vendor white papers but from the pattern of consistent results across different industries and deployment contexts. The use cases below represent areas where agents are delivering quantifiable outcomes today, not in a future roadmap.
Customer experience and support.Talkdesk research shows that 81% of customers now prefer self-service options before reaching a human agent. AI agents are closing that gap, not just routing queries but resolving them end-to-end: checking order status, processing returns, updating account details, and escalating only genuine exceptions. The result is measurable improvement in CSAT scores alongside reduced cost-per-resolution.
Finance and back-office operations. Invoice reconciliation, accounts-payable workflows, and expense classification are high-frequency, rules-driven processes that agents handle well. Early enterprise deployments report 30–50% more consistent decision-making in these workflows compared to manual processing. Consistency matters here because it reduces audit risk and compliance exposure, not just throughput.
Sales and marketing intelligence.Modern marketing AI agents can analyze thousands of keyword variations, cluster content opportunities by intent, and prioritize them by difficulty, search volume, and business value. Work that previously required a team of analysts hours to complete manually. The same architecture applies to competitive monitoring, lead scoring, and campaign performance analysis.
IT and software development.IBM notes that agents using advanced NLP from large language models are solving complex tasks in software design, IT automation, and code generation. DevOps teams are deploying agents to monitor infrastructure, respond to incidents at tier-one severity, and generate pull requests for routine maintenance tasks.
“I think we’re going to live in a world where there are going to be hundreds of millions or billions of different AI agents, eventually more AI agents than there are people in the world.”
Mark Zuckerberg, CEO, Meta
The strategic implication extends beyond individual use cases. Search Engine Land data shows AI assistants now account for 56% of global search-engine-like query volume, with approximately 45 billion monthly sessions. Gartner forecasts a 25% decline in traditional search engine volume by end of 2026 as users shift to AI interfaces. Agents aren’t just internal operations tools. They’re becoming the gatekeepers through which customers and partners discover and interact with your business.
Build, Buy, or Wait: A Decision Framework That Actually Works
The “build vs buy” question for AI agents is more nuanced than for standard enterprise software because the wrong answer in either direction has serious consequences. Build when you shouldn’t and you’ll sink six months of engineering time into something a vendor already solved. Buy when you shouldn’t and you’ll hand your most sensitive data and differentiated process logic to a third party you can’t fully audit.
The cleanest way to structure this decision is a 2×2 matrix using two axes: strategic differentiation (how central is this process to your competitive advantage?) and implementation complexity and regulatory risk (how hard and how dangerous is this to get wrong?).
Low Complexity / Risk
High Complexity / Risk
High Differentiation
Co-build: use a vendor platform with your proprietary data (e.g., internal knowledge agents, sales-playbook agents)
Build strategically with specialized teams and strong governance (e.g., core underwriting, medical decision support)
Low Differentiation
Buy or configure off-the-shelf (e.g., CX triage agents, standard FAQ bots)
Avoid or wait: pilot in a sandbox only; monitor vendor landscape for maturation
Before committing to any quadrant, work through this readiness checklist:
Data sensitivity and residency requirements are documented and understood
Integration complexity with legacy systems has been scoped and estimated
Specialized vertical vendors have been evaluated for off-the-shelf fit
Internal AI/ML engineering capacity and tooling maturity have been assessed honestly
Change-management readiness across affected teams has been evaluated
Regulatory and compliance obligations for the use case are mapped
A baseline of current performance metrics exists to measure against
Governance and Safety: The Framework Most Organizations Are Missing
The single most consistent gap across IBM, Microsoft, BCG, and Google Cloud’s public materials on AI agents is governance. It gets a paragraph. It deserves a playbook. Here’s why: as agents operate more autonomously in finance, healthcare, and other regulated domains, accountability becomes genuinely unclear when something goes wrong. Who is responsible when an agent approves a transaction it shouldn’t have, or shares data it wasn’t meant to share?
The failure modes are real: hallucinated actions (agents acting on incorrect assumptions about the world), security boundary violations (agents accessing systems beyond their intended scope), and poor escalation decisions (agents proceeding autonomously in situations that require human judgment). Jim Yu, CEO of BrightEdge, notes that with agentic crawlers already active across the web, brands need structured data, clear content hierarchies, and machine-readable information in place now, because agents are already interacting with your systems whether you’ve invited them or not.
Organize your governance approach around five pillars:
5-Pillar AI Agent Governance Framework
Purpose and Scope
Document what the agent is allowed to do and, critically, its explicit non-goals. An agent built for invoice processing should have no access to HR systems, full stop.
Permissions and Boundaries
Apply the principle of least privilege across all connected systems. Use sandbox environments for testing. Require explicit, auditable tool-access policies before any production deployment.
Human-in-the-Loop Controls
Define in advance which actions require human review before execution. High-value transactions, regulatory submissions, and customer-facing communications in sensitive contexts should always have a human checkpoint.
Monitoring and Auditability
Log every tool call, decision rationale, and outcome. This isn’t optional in regulated industries. It’s the baseline for demonstrating compliance. Design your logging architecture before deployment, not after an incident.
Incident Response and Rollback
Build playbooks for shutting down or rolling back agents when they misbehave. This includes circuit-breakers in your architecture, defined escalation paths, and regular drills. An agent you can’t turn off quickly is a liability.
Your First AI Agent: A 5-Step Pilot Process
The organizations seeing the strongest early returns from AI agents share one characteristic: they started narrow and instrumented everything. They didn’t try to transform an entire department in the first deployment. They picked one workflow, measured it carefully, learned, and expanded from there.
5-Step Enterprise Agent Pilot
Pick one narrow, high-friction workflow
Good candidates: invoice reconciliation, tier-1 support triage, marketing campaign QA, or contract clause extraction. The process should be repetitive, measurable, and not catastrophic if the agent makes occasional errors.
Instrument your baseline
Document current cycle time, error rate, and cost per transaction. You cannot prove ROI without a credible before-state. Target improvements of 40–60% cycle-time reduction and 30–50% more consistent decision-making, based on published enterprise benchmarks.
Prototype with a constrained agent in shadow mode
Use a vendor platform or open-source stack. Restrict permissions ruthlessly. In shadow mode, the agent only recommends actions; a human still executes them. This phase reveals where the agent’s reasoning breaks down before it can cause harm.
Move to supervised production
Allow the agent to execute low-risk steps automatically. Require human sign-off for high-impact or irreversible actions. Define “high-impact” explicitly in advance, not in the moment of a crisis.
Scale, standardize, and feed the loop
Use learnings to define reference architectures and governance templates. Feed logs and outcomes back into model fine-tuning and process improvement. The agent should get better over time, so design for that from day one.
Frequently Asked Questions About AI Agents
An AI agent is software that uses AI to understand a situation, decide what to do next, and take action through tools or external systems to achieve a goal on your behalf. Unlike a chatbot, it doesn’t wait for instructions on every step. It plans and executes autonomously within defined boundaries. IBM’s documentation emphasizes the key role of step-by-step reasoning and tool-calling in making this work.
A chatbot primarily answers questions in conversation, requiring a human to drive each exchange. An AI agent can also act, calling APIs, updating records, triggering workflows, and coordinating multi-step tasks without continuous human prompting. Google Cloud describes the distinction as the agent’s capacity for planning and memory across interactions, not just single-turn response generation.
Today’s AI agents are most reliably deployed in customer support triage, back-office workflows like invoice processing and contract review, sales and marketing analytics, and internal knowledge search and summarization. These are well-structured processes with clear success criteria, which makes them strong candidates for early agentic deployments with measurable outcomes.
The practical taxonomy breaks into four categories: Task Agents (narrow, single-action automation), Workflow Agents (multi-step process execution), Decision-Support Agents (data analysis with human-in-the-loop for final decisions), and Orchestrator or Multi-Agent Systems (coordinating other agents and systems for end-to-end complex goals). Most enterprises start with the first two and expand from there.
They can be, but only with rigorous governance in place. This means strict permissions on what systems the agent can access, data residency controls, human review checkpoints for high-risk actions, comprehensive logging for audit purposes, and documented incident-response playbooks. Treat governance design as a prerequisite to deployment, not an afterthought.
Build when the process is central to your competitive differentiation and you have the engineering capacity and data infrastructure to support it. Buy when specialized vendors already solve the problem well and the process isn’t a source of competitive advantage. Wait or sandbox-only when complexity and regulatory risk are high but strategic value is low. That quadrant destroys more value than it creates when rushed.
The evidence so far points toward role transformation rather than wholesale elimination. Agents absorb repetitive, rules-driven steps and speed up decision cycles, which shifts human work toward exception handling, strategic judgment, and relationship-intensive tasks. Workforce planning should account for the need to reskill people toward agent oversight, prompt engineering, and process design.
Task and workflow agents in well-structured processes can show measurable ROI within 90 days of deployment. Decision-support agents typically require 2–6 months to calibrate reliably, depending on data quality. Multi-agent orchestration for complex end-to-end processes should be planned over a 6–18 month horizon with clear milestones. Front-load your investment in data quality and change management, as these are more often the bottleneck than the AI technology itself.
What Business Leaders Should Do This Quarter
The window for deliberate, well-scoped AI agent adoption is open right now, but it won’t stay open indefinitely. The 44% of enterprises already deploying or evaluating agents aren’t moving on enthusiasm alone. They’re responding to real competitive pressure and early-mover ROI. The question for every business leader in 2026 isn’t whether to engage with what AI agents explained means for your operations. It’s how quickly you can move from understanding to disciplined action.
Three things are true simultaneously: the upside is real and quantifiable, the risks are manageable with proper governance, and the organizations that wait for perfect certainty will find that their competitors have already built the institutional knowledge required to scale. The technology advantage at this stage doesn’t belong to whoever has the most AI. It belongs to whoever builds the most repeatable internal playbook for responsible agent deployment.
Your immediate priorities: audit your most friction-heavy workflows for agent viability, establish governance standards before the first deployment, and assign ownership of agent architecture to a named leader with both technical and operational authority. Watch the multi-agent orchestration space closely. The complexity-to-value ratio is improving rapidly, and the organizations building orchestration competency now will have a significant head start when that technology matures into mainstream enterprise reliability over the next 18 months.
The agents are coming regardless. The only real choice is whether you’re the one directing them.
Disclaimer: This article is provided for general informational and educational purposes only. Statistics, forecasts, and expert perspectives cited are drawn from publicly available third-party sources as referenced throughout the text. NeuralWired does not independently verify all third-party claims and makes no warranty regarding their ongoing accuracy or completeness. Nothing in this article constitutes legal, financial, regulatory, or technology implementation advice. Readers should conduct independent due diligence and consult qualified professionals before making decisions based on any information presented here. Mention of vendors, products, or services is for illustrative purposes only and does not constitute an endorsement or recommendation by NeuralWired.
NeuralWiredResearch-backed technology analysis for professional decision-makers
Cybersecurity·March 26, 2026·
Only 24% of enterprises have fully deployed zero trust. The rest are stuck, burned, or still planning. Here’s what separates the ones that make it from those that don’t.
Sixty-five percent of enterprise zero trust deployments collapse before they reach scale. Not because the security model is flawed. Because organizations scope it wrong, sequence it wrong, or skip identity entirely, then wonder why three years later their network still behaves like it’s 2015.
According to Forrester’s Zero Trust research, only 24% of enterprises have fully implemented zero trust architecture. Meanwhile, Cisco’s 2025 Annual Cybersecurity Report found that 82% of organizations now operate across hybrid and multi-cloud environments, where the traditional perimeter model has already collapsed. The gap between necessity and execution is real, and expensive.
This guide covers what that 24% did differently. We break down the NIST 800-207 seven-pillar framework, lay out a 12-month enterprise implementation roadmap, expose the five failure patterns that sink 65% of projects, and examine where AI agents fit into a zero trust model in 2026. Based on government standards, analyst data, and real deployment case studies, this is the zero trust implementation guide that replaces six browser tabs.
The Case Is Already Closed: Why Zero Trust Isn’t Optional Anymore
The “why zero trust” debate is over. The question now is why so few have actually done it.
IBM’s Cost of a Data Breach Report 2025, which analyzed 600-plus confirmed breaches, found that zero trust adopters reduced breach impact costs by 50% compared to organizations relying on perimeter controls. ESG’s economic validation puts the 3-year ROI at 248% across 15 studied organizations. And according to a SecurityWeek survey of 350 CISOs, 76% ranked zero trust as their top priority for 2026.
The business case isn’t ambiguous. But execution pressure is real.
“Zero trust is shifting from ambition to necessity. Eighty percent of enterprises will adopt by 2027, but most fail without identity-first sequencing.”
Chase Cunningham, VP Analyst, Gartner (February 2026)
Cunningham’s point on sequencing isn’t a footnote. It’s the crux of why deployments stall. Organizations treat zero trust as a technology purchase when it’s actually an architectural transformation. They buy ZTNA tools before they’ve mapped their identity posture, then get stuck when legacy systems can’t enforce dynamic policies.
The MarketsandMarkets forecast puts the zero trust architecture market at $30.4 billion in 2025, growing to $96.5 billion by 2030 at a 26% CAGR. Zscaler’s State of Zero Trust 2026 report found 92% of Fortune 100 companies now use ZTNA tools in some form. The adoption curve is steep. The full-deployment rate is not.
The gap comes down to one thing: skipping the foundations.
NIST 800-207 and the 7 Pillars of Zero Trust Architecture
Before scoping, budgeting, or buying tools, every enterprise needs a shared definitional framework. NIST SP 800-207 provides exactly that. It defines seven pillars that together constitute zero trust architecture, each assuming breach by default and enforcing least-privilege access dynamically.
“The seven pillars must be implemented iteratively to avoid common pitfalls like over-scoping.”
Rose Schulte, Sr. Director of Zero Trust, NIST (January 2026)
Schulte’s caution about iteration is exactly where most enterprises go wrong. They read the pillars as a checklist to complete simultaneously, which is why 65% end up over-scoped before they hit month four. The pillars are best understood as a sequenced architecture, not a parallel deployment plan.
PillarCore FunctionPrimary ToolsKey Metric
1. User
Verify every user explicitly via MFA and behavioral analytics
Policy as code, dynamic response, SOAR orchestration
Palo Alto XSOAR, Tines, OPA
MTTD < 1 hour
The order matters. Identity and device (pillars 1 and 2) are prerequisites for everything downstream. You can’t enforce network segmentation policies without knowing who owns which device. You can’t write application access rules without a coherent user identity fabric. Start there.
The CISA Zero Trust Maturity Model v2.0 provides a companion measurement framework with four stages: Traditional, Initial, Advanced, and Optimal. Most enterprises entering a zero trust program sit at Traditional or Initial. A realistic 12-month goal is reaching Advanced, defined by consistent policy enforcement across at least 80% of traffic.
The 12-Month Zero Trust Implementation Roadmap
IDC research based on interviews with 200 enterprises puts the average implementation timeline at 12 to 18 months. The faster end of that range belongs to organizations that sequenced correctly from day one. The 18-month end belongs to those that didn’t.