How to Measure AI ROI in Enterprise: The Framework CFOs and CTOs Actually Agree On (2026)
Only 25% of enterprise AI initiatives delivered their expected ROI in 2025, yet budgets keep growing. Here’s the measurement framework that closes the gap between engineering logic and P&L reality.
Only 25% of enterprise AI initiatives delivered their expected ROI in 2025, according to IBM’s CEO Study. Yet global AI spending surpassed $301 billion in 2026, and 65% of enterprises increased their AI budgets year-over-year. The math doesn’t add up, and it’s because most organizations are measuring AI ROI the wrong way.
The problem isn’t the technology. CTOs are building business cases in the language of engineering while CFOs think in the language of P&L. This guide gives you the framework that closes that gap: a 3-layer ROI model, a full cost accounting checklist of variables most teams undercount, and a ready-to-use ROI scorecard you can bring into your next budget review.
Why Most AI ROI Calculations Fail: The Vanity Metric Trap
Only 47% of IT leaders said their AI projects were profitable in 2024. A further 33% broke even, and 14% recorded outright losses, according to an IBM-commissioned report from 2025. Boards keep approving AI budgets anyway, because the ROI numbers they’re seeing are built on pilot economics, not production reality.
The root cause is a reliance on four vanity metrics that inflate AI ROI on paper without producing anything verifiable on the P&L. These are: time-saved-per-employee projections that never get audited against actual output, accuracy improvement percentages disconnected from any revenue figure, user adoption numbers that count logins rather than business outcomes, and model benchmark scores that measure lab performance against real-world deployment complexity.
The credibility gap is wide. Only 51% of organizations said they could confidently evaluate the ROI of their AI spend, according to the CloudZero State of AI Costs 2025, even as average monthly AI spend reached $62,964 per month. The gap between spending confidence and measurement confidence is where most AI investment goes to die.
“Organizations that account for technical debt in their AI business cases project 29% higher ROI than those that don’t. That single discipline explains most of the performance gap between AI winners and losers.”
IBM Institute for Business Value, CEO Study 2025 — ibm.com
That 29% gap from technical debt accounting alone tells you everything. The AI projects that never reach production almost universally share one trait: they were greenlit on pilot economics and then surprised their sponsors with production costs nobody had modeled.
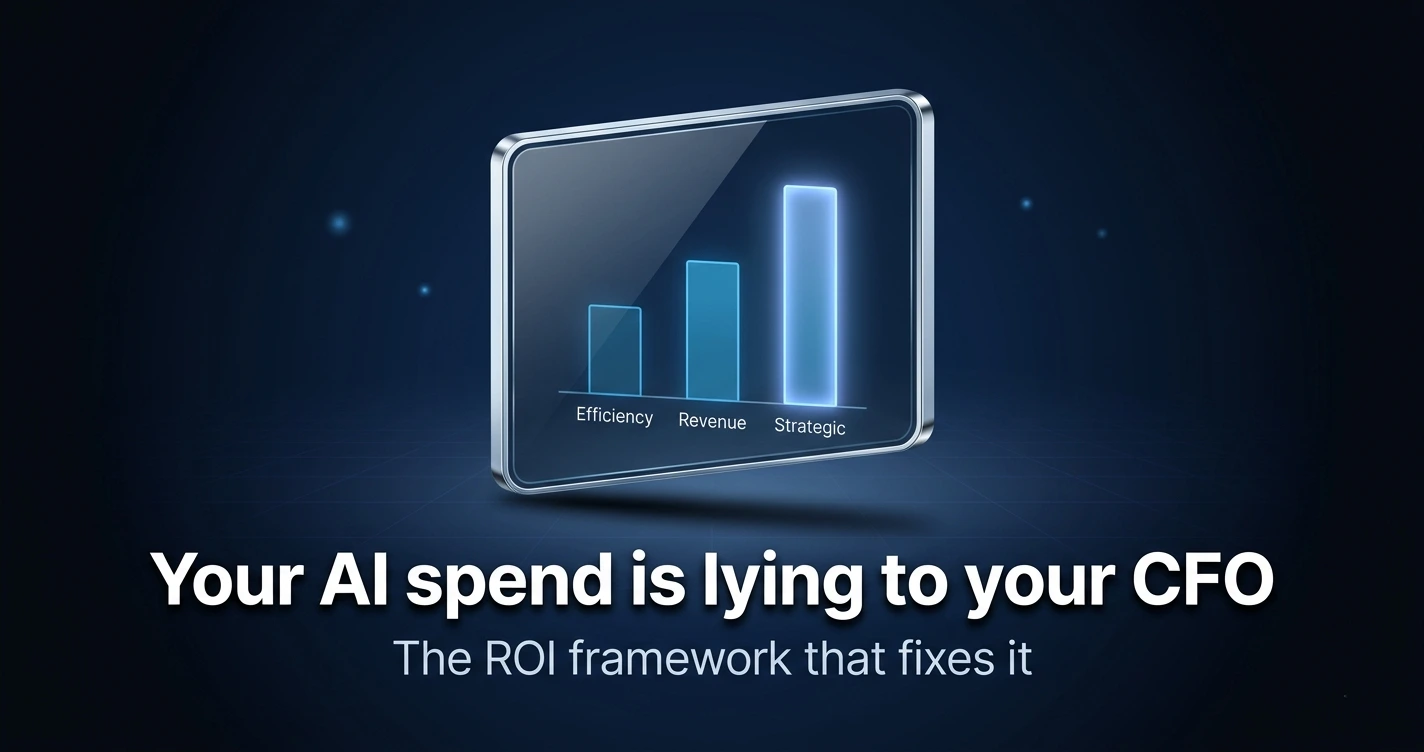
The 3 ROI Layers: Efficiency, Revenue Impact, and Strategic Value
Most enterprise AI ROI frameworks collapse everything into a single number. That’s the wrong structure. There are three distinct layers of return, each with a different measurement timeline, owner, and ceiling. Conflating them is how you end up with a CFO who thinks the AI program is underperforming and a CTO who thinks it’s working fine. They’re measuring different things.
| Layer | What It Measures | Time to Realize | Who Owns It |
|---|---|---|---|
| Layer 1: Efficiency ROI | Cost per task reduction, headcount reallocation, error rate reduction, processing speed gains | 3–9 months | CTO / COO |
| Layer 2: Revenue Impact ROI | Faster time-to-market, customer retention uplift, upsell from personalization, churn prediction revenue recovery | 12–24 months | CRO / CMO |
| Layer 3: Strategic Value ROI | Competitive positioning, talent attraction, data asset accumulation, capabilities unlocked for future initiatives | 24+ months | CEO / Board |
Layer 1: Efficiency ROI
This is the fastest and most measurable layer. It includes cost per task reduction, headcount reallocation, error rate reduction, and processing speed gains. According to Deloitte’s 2026 State of AI report, surveying 3,235 business leaders, 66% of organizations report productivity and efficiency gains from AI. This is where most enterprise AI ROI lives today, and it’s the only layer most CFOs ever see.
Layer 2: Revenue Impact ROI
This layer is harder to measure but carries a significantly higher ceiling. It covers faster time-to-market, improved customer retention, upsell and cross-sell from AI personalization, and revenue recovered through churn prediction. Deloitte found that 74% of organizations aim to grow revenue through AI, but only 20% are already doing so. That gap is a measurement problem, not a technology one. Teams that don’t define revenue attribution before deployment never close it.
Layer 3: Strategic Value ROI
This is the most important and least measured layer. It includes competitive positioning, talent attraction, data asset accumulation, and optionality: the capabilities unlocked for future initiatives that don’t exist yet. McKinsey’s AI high performers, the 6% of enterprises where 5% or more of EBIT is attributable to AI, invest in this layer intentionally. Most organizations treat it as an afterthought.
Cross-study meta-analysis from MasterOfCode (2026) finds that visionary AI adopters show 1.7x revenue growth, 3.6x three-year total shareholder return, and 2.7x return on invested capital versus laggards. That performance spread is the 3-layer ROI model working as designed: efficiency funding the case, revenue expanding it, and strategic value compounding it.
How to Calculate Time-to-Value for an AI Initiative
Time-to-Value (TTV) and payback period are not the same thing, and most enterprise AI teams conflate them in ways that produce wildly optimistic board presentations. TTV is the time from project approval to the first measurable business impact. Payback period is the time until cumulative returns exceed total investment. Both matter. Confusing them skews your planning horizon by months.
The TTV Formula
TTV = Development Time + Integration Time + Change Management Time + Stabilization Period. Each phase carries hidden time costs that teams routinely underestimate, particularly change management, which pilots consistently treat as a rounding error.
The industry median for AI agent deployments is 5.1 months from approval to first measurable business impact, based on BCG and Forrester 2026 surveys. But that median masks significant variation by function. Sales and SDR agents pay back in 3.4 months. Finance and operations agents average 8.9 months. If your team is planning a finance automation initiative with a 4-month payback model, the benchmarks say you’re off by more than half.
The Three TTV Killers
Data Readiness
Data preparation consumes 30–50% of AI project budget and time. It’s the single most underestimated phase in every enterprise AI business case.
Integration Complexity
60% of enterprises name legacy system integration as their top AI challenge (Deloitte 2026). The API layer looks simple in the architecture diagram. It never is in production.
Adoption Lag
The human change curve that pilots always ignore. Users resist new workflows regardless of tool quality. Change management is not a soft cost; it’s a hard timeline driver.
Forrester data shows 44% of AI projects that move to production achieve positive ROI within 12 months. That number sounds encouraging until you flip it: 56% of production AI deployments take longer than 12 months to reach positive ROI, or never do. Proper TTV planning is the difference between being in the 44% and explaining to the board why you’re in the 56%.
Cost Variables CTOs Always Undercount
Companies underestimate total AI costs by 30% or more, according to analysis from the Ramsey Theory Group published in April 2026. The hidden costs tied to inference at scale, data engineering, model monitoring, and continuous retraining now surpass initial model development costs in most production AI systems. The business case looks clean at approval. The invoice looks very different 18 months later.
Operating cost exceeds build cost within 18–24 months in many production AI systems. Hidden costs add 30–50% beyond initial estimates across multiple independent analyses. This is not an edge case. It’s the default outcome for teams that treat AI like a capital project rather than a permanent operating expense line.
Hidden Cost 1: Inference at Scale
A support assistant handling 50,000 conversations per month at $0.01 per turn costs $5,000 per month. Add multi-step reasoning and retrieval-augmented generation and that number multiplies. Enterprise LLM inference costs run $5,000 to $50,000 per month at production scale, per CloudZero’s State of AI Costs report. The critical detail most AI ROI models miss: agentic workflows trigger 10–20 LLM calls per user task versus one call for a standard chatbot, according to Gartner’s March 2026 analysis. If your business case was built on chatbot-level consumption economics, your actual inference bill will arrive as a shock.
This is where hybrid cloud AI cost strategy becomes a practical requirement rather than an architectural preference. Teams that model inference costs at agentic call volumes before deployment avoid the budget revision conversation entirely.
Hidden Cost 2: Model Retraining
Budget $15,000 to $40,000 per year for a moderately complex model running quarterly retraining cycles. Most initial business cases budget exactly $0 for this line item. Annual AI maintenance runs 15–25% of the initial build cost and should be treated as a permanent operating expense, not a one-time project cost. That framing matters for how the CFO categorizes it: CapEx at approval, OpEx forever after.
Hidden Cost 3: Data Pipeline Maintenance
Continuous data ingestion, cleansing, and labeling don’t stop when the model goes live. Enterprise AI projects add $500 to $3,000 per month in data infrastructure costs that don’t appear in initial estimates. When you combine this with the 30–50% of project budget that data preparation consumed during build, data is easily the largest single cost category in any AI initiative over a three-year horizon.
Hidden Cost 4: Human-in-the-Loop Operations
High-stakes AI deployments in legal, medical, and customer-facing contexts require human review workflows. The cost of building, staffing, and managing these pipelines is real and almost never in the initial estimate. Teams that skip this step don’t avoid the cost. They discover it during a compliance review or a customer escalation, at which point the retrofit bill is higher.
Hidden Cost 5: MLOps Retrofit
Teams that skip monitoring deploy blind. Emergency remediation and retroactive MLOps build costs $40,000 to $100,000, which is more than the cost of implementing monitoring correctly from the start, according to Azilen’s 2026 analysis. This cost category doesn’t appear in the P&L until something breaks. It then appears all at once.
“The shift to agentic AI workflows changes the cost calculus entirely. A task that triggered one LLM call as a chatbot now triggers 10–20 calls as an agent. Most enterprise ROI models weren’t built for that volume.”
Gartner, March 2026 Agentic AI Cost Analysis
The CFO Conversation: Translating AI Metrics into P&L Language
CTOs speak in tokens, latency, accuracy, and model size. CFOs speak in EBIT margin, payback period, net present value, and OpEx versus CapEx. These are different languages, and most AI initiatives die in the translation. The technology works. The business case doesn’t survive the budget review.
The board pressure signal is already shifting the dynamic. CFOs are now killing more AI projects than CTOs launch, according to Solutions Review’s Enterprise AI Predictions for 2026. The era of approving AI spend on future potential is over. CFOs now require P&L impact in quarters, not years. If your CTO can’t speak that language, the initiative won’t get funded, regardless of how good the model is.
The Translation Table: CTO Metrics to CFO Equivalents
| CTO Metric | CFO Equivalent | How to Calculate |
|---|---|---|
| Model accuracy improvement | Reduction in error-resolution cost | Error volume × average cost per error × accuracy delta |
| Inference cost per query | AI-specific OpEx line item | Monthly queries × cost per query × 12 |
| Time-to-resolution reduction | Revenue protected from churn | Retention rate uplift × annual contract value |
| Token throughput at scale | Unit economics per automated transaction | Cost per 1,000 tokens × average tokens per task × monthly task volume |
| Model F1 score improvement | Reduction in false positive remediation cost | False positive volume × handling cost × F1 delta |
The alignment check that surfaces misalignment fastest: ask the CFO and the business unit leader, without the CIO in the room, to explain what the company is doing with AI and why. If only technical leaders can describe the AI strategy, it’s still a tech project, not an enterprise transformation. CIO.inc’s 2026 enterprise maturity benchmarking makes this the single clearest indicator of whether AI has crossed from pilot to program.
A well-prepared CTO should be able to deliver three specific sentences about any AI initiative going into a budget review. First: “This initiative will reduce [specific process] cost by $Y over 18 months.” Second: “Our payback period is Z months, assuming [clearly stated assumptions].” Third: “If adoption reaches only 50% of forecast, ROI is still positive at [X] months.” Those three sentences answer the questions a CFO asks before the CFO asks them. That’s how AI programs survive budget season.
The governance model that sits behind this conversation matters as much as the metrics themselves. Organizations with formal AI governance structures consistently report higher CFO confidence in AI spend, because there’s an auditable process behind the numbers, not just engineering judgment.
The Enterprise AI ROI Scorecard (Use This Template)
This scorecard condenses the full framework into a single reference you can bring to your next budget review or board presentation. Each metric maps to a measurable data point, a benchmark drawn from current research, and a health indicator that flags when a deployment is drifting off track.
| Metric | What to Measure | Target Benchmark | Health |
|---|---|---|---|
| Time-to-Value | Months from approval to first measurable business impact | 5.1 months or less (BCG/Forrester median) | 5 mo or less ✓ |
| Efficiency ROI | % reduction in cost per task or process | 26–31% cost reduction (McKinsey supply chain benchmark) | Above 20% ✓ |
| Inference cost per query | Total monthly inference bill divided by total AI-processed events | Below $0.01 per query for standard tasks | Monitor ⚠ |
| Hidden cost ratio | Actual total cost divided by original budget estimate | 1.35x or less (warning above 1.5x) | 1.3–1.5x ⚠ |
| Productivity uplift | % performance improvement in AI-augmented roles | 37% average uplift versus 12% from traditional automation | Above 25% ✓ |
| Payback period | Months until cumulative returns exceed total investment | 14 months or less (McKinsey 5.8x ROI baseline) | 14 mo or less ✓ |
| Revenue layer ROI | $ revenue impact attributable to AI initiative | Positive within 24 months | Measure ⚠ |
| Model maintenance cost | Annual retraining and monitoring as % of build cost | 15–25% of build cost (industry norm) | Above 30% = risk ✗ |
| Adoption rate | % of target users actively using AI tool after 90 days | 60% or more for copilot tools; 80% or more for agentic systems | Measure ⚠ |
| CFO alignment score | Can CFO describe AI initiative value without CTO present? | Yes = mature program; No = still a tech project | Yes ✓ |
Update this scorecard quarterly. McKinsey found that AI high performers review ROI metrics 3x more frequently than average adopters. A quarterly review cadence turns this static template into a living management tool and gives CFOs the audit trail they need to approve next year’s AI budget without a fight.
This framework connects directly to your broader AI strategy. The scorecard is only as useful as the governance process that feeds it with accurate data. Teams that instrument their deployments properly from day one generate the numbers this scorecard needs automatically. Teams that don’t are estimating, which is how you end up in the 75% of AI initiatives that disappointed their board.
Real Examples: Where Enterprises Saw 3x+ ROI and Why
Case studies are only useful if they’re specific enough to map your use case onto. The three examples below represent different industries, different function types, and different ROI timelines. What they share is more instructive than what separates them.
Example 1: IT Ticket Automation at Getronics
Getronics automated one million IT tickets annually using AI agents integrated directly with ServiceNow and Systrack Diagnostics. The result was faster resolution times, reduced human agent workload, and measurably better customer experience scores. The ROI profile here is ideal for a first enterprise AI deployment: high volume, highly repetitive process, clear baseline metric, and existing workflow integration that eliminated change management friction.
Example 2: Campaign Brief Generation at Databricks
Databricks’ marketing team built “Briefbot,” an AI agent that generates 80% of a campaign brief in approximately five minutes. A task that previously consumed half a day of senior marketer time became a review-and-edit process. At scale, this translates directly to either cost savings or increased output capacity across hundreds of briefs per year. The measurable input and output made ROI calculation straightforward from day one.
Example 3: Predictive Maintenance in Manufacturing
AI-driven predictive maintenance reduces equipment downtime by 45% and maintenance costs by 25% in manufacturing settings, based on current industry deployment data. For an organization running a $10 million annual maintenance budget, that’s $2.5 million in annual savings. The payback period in this category is typically measured in months rather than years, which makes it one of the strongest ROI profiles available in enterprise AI today.
What These Three Have in Common
All three succeeded for the same four reasons. First, they targeted a measurable, high-volume process rather than a vague transformation goal. Second, ROI metrics were defined before deployment, not after. Third, they integrated into existing workflows rather than requiring parallel system adoption. Fourth, they established clear human handoff protocols so that edge cases didn’t escalate into reliability incidents.
The macro benchmark that ties this together: McKinsey reports a 5.8x ROI on AI investment within 14 months of production deployment for high-performing implementations. The qualifier “high-performing” is doing real work in that sentence. That result comes from organizations with governance, data readiness, and measurement frameworks in place before the first model goes live. This article gave you that framework. Now the measurement gap is yours to close.
CFO veto activity on AI budgets will increase through Q3 2026 as first-generation deployments hit their 18-month cost inflection point and operating expenses exceed build costs on the books. Organizations without a hidden cost accounting framework will face the largest revision requests.
Agentic AI inference cost benchmarks will emerge as a formal category by Q4 2026, with Gartner and Forrester publishing per-workflow cost norms for sales, finance, and IT operations agents. These will become the standard comparison points in CFO presentations replacing current per-query metrics.
Revenue layer ROI attribution tooling is the next major enterprise AI category. The 20% of organizations currently capturing revenue impact from AI (Deloitte 2026) share one capability: purpose-built attribution pipelines. Vendors offering this natively will see accelerated enterprise procurement cycles starting H2 2026.
Frequently Asked Questions
What is a good ROI benchmark for enterprise AI in 2026?
McKinsey reports high-performing enterprises achieve 5.8x ROI within 14 months of production deployment. A more conservative baseline: 44% of AI projects that reach production achieve positive ROI within 12 months (Forrester). For most enterprise AI investments, a payback period under 18 months is a reasonable target; anything beyond 24 months requires a compelling strategic value argument to survive CFO review.
How do you calculate AI ROI for a CFO presentation?
Translate technical metrics into P&L terms first. The core formula is: (Total value generated minus Total AI costs) divided by Total AI costs, multiplied by 100. Total costs must include inference at production scale, model retraining cycles, maintenance, and integration, not just build cost. Present the payback period alongside a conservative scenario where adoption reaches 50% of forecast; CFOs trust numbers that come with a downside model.
What hidden costs do CTOs most often miss in AI ROI calculations?
The most underestimated costs are inference at production scale ($5,000 to $50,000 per month for enterprise LLM deployments), model retraining cycles ($15,000 to $40,000 per year), data pipeline maintenance (30–50% of project budget), and MLOps monitoring retroactively implemented post-launch ($40,000 to $100,000). Together these add 30–50% beyond initial estimates. Agentic workflows compound the inference cost specifically, triggering 10–20 LLM calls per task versus one for a standard chatbot.
How long does it take to see ROI from enterprise AI?
The median time-to-value for AI agent deployments is 5.1 months from approval to first measurable business impact (BCG and Forrester 2026). Revenue impact typically materializes within 12–24 months. Sales AI agents pay back fastest at 3.4 months; finance and operations agents average 8.9 months. Data readiness and change management are the biggest timeline drivers. Teams that underestimate these phases routinely miss their payback projections by six months or more.
Why do most AI initiatives fail to deliver expected ROI?
IBM’s 2025 CEO Study found only 25% of AI initiatives delivered expected ROI. The main causes are pilot economics applied to production business cases, absence of a formal governance model, data quality issues (52% cite this as the primary blocker), and poor change management that produces low adoption regardless of technology quality. The 29% ROI gap between organizations that account for technical debt and those that don’t is the clearest single diagnostic for why most programs underperform.
What is the difference between time-to-value and payback period for AI?
Time-to-value (TTV) is the time from project approval to the first measurable business impact. Payback period is the time until cumulative returns exceed total investment. TTV can be 5 months while payback period is 14 months; they measure different things. Conflating them in business cases produces overly optimistic payback projections because the costs continue accumulating after initial impact, particularly maintenance and retraining expenses that most teams don’t model.
How do you build the CFO-CTO alignment needed to approve an AI budget?
The fastest alignment test is to ask the CFO to describe the AI initiative’s value without the CTO present. If they can’t, the program is still a technology project rather than a business investment. Alignment requires translating every technical metric into a P&L equivalent before any board presentation: model accuracy becomes error-resolution cost reduction, inference cost becomes an OpEx line item, and resolution speed becomes revenue protected from churn. Three specific sentences covering projected savings, payback period, and the conservative scenario close most CFO objections before they surface.
What AI use cases have the fastest ROI payback in enterprise settings?
Sales and SDR AI agents pay back in 3.4 months on average (Forrester 2026), making them the fastest-returning enterprise AI category. IT ticket automation and predictive maintenance in manufacturing also show strong early returns because they target high-volume, repetitive processes with measurable baselines. Finance and operations agents take significantly longer at 8.9 months average, partly due to integration complexity with legacy financial systems and higher human-in-the-loop requirements in regulated environments.