Google Post-Quantum Cryptography 2029 Deadline Explained
Enterprise Security · Post-Quantum Cryptography
Google Just Moved Its Quantum Deadline to 2029
By NeuralWired Staff | Published June 21, 2026 | Last updated June 21, 2026
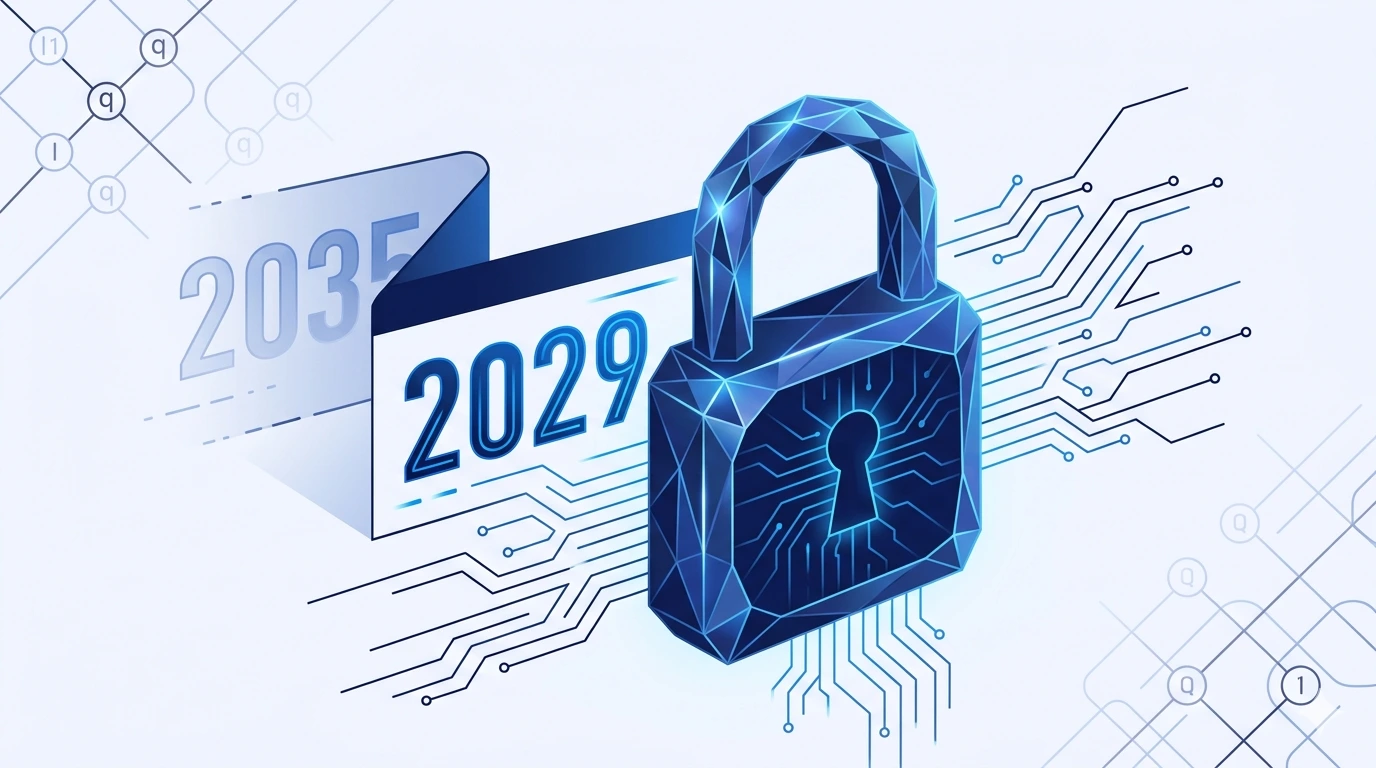
Your cryptography migration roadmap probably says 2035. Google’s doesn’t anymore. On March 25, 2026, Google set a new post-quantum cryptography 2029 deadline for its own systems, six years ahead of the federal backstop most enterprise security teams have been planning around for the past two years.
That’s not a marketing decision. It’s a response to math. Six days later, Google Research published the resource estimates behind it, and they’re the kind of numbers that make a CISO reread an email twice (and then forward it straight to the budget committee).
If you’re responsible for cryptographic risk at your organization, here’s exactly what happened, what the new research means and doesn’t mean, and what NIST’s separate, still-unfinished post-quantum cryptography deadline requires of you in the meantime.
“We’re setting a timeline for post-quantum cryptography migration to 2029.”
Heather Adkins & Sophie Schmieg, Google Security Engineering
That’s a specific, internal, engineering-driven deadline, not a regulatory mandate. Google ties it directly to faster than expected progress in quantum hardware, error correction, and updated estimates of what it actually takes to break current encryption standards.
The first concrete product step: Android 17 is integrating ML-DSA-based digital signature protection, on top of post-quantum support already shipping in Chrome and Google Cloud. Google is treating signature and authentication migration as the more time-sensitive half of the problem, ahead of encryption. The logic is straightforward once you sit with it: forging a signature only requires the attacker to break the math at the moment of the attack, so there’s no advance window. Encrypted data, by contrast, can be captured and stored today, then decrypted years later once the hardware catches up, which is the harvest-now, decrypt-later risk we’ll come back to in a moment. Both problems are urgent. They’re just urgent on different clocks.
The Math That Convinced Google to Move Early
Six days after the deadline announcement, on March 31, 2026, Google Research published the paper that explains why. Ryan Babbush, Director of Research for Quantum Algorithms, and Hartmut Neven, VP of Engineering at Google Quantum AI, laid out two optimized quantum circuits for solving the elliptic curve discrete logarithm problem at the 256-bit security level, the math underneath ECDSA, the signature scheme securing most TLS connections, SSH sessions, code signing, and the majority of cryptocurrency wallets, including Bitcoin and Ethereum.
The numbers: one circuit uses fewer than 1,200 logical qubits and roughly 90 million Toffoli gates. The second uses fewer than 1,450 logical qubits and about 70 million Toffoli gates. Run on a superconducting quantum computer, Google estimates either circuit could complete the attack with fewer than 500,000 physical qubits in a matter of minutes, an approximately 20-fold reduction from prior estimates of what the attack would require.
It’s not an isolated revision either. Craig Gidney, also at Google Quantum AI, updated his RSA-2048 factoring estimate in 2025 to under 1 million physical qubits and less than a week of runtime, down from his own 2019 estimate of 20 million qubits and roughly eight hours. Same researcher, same category of algorithm, same order-of-magnitude drop. Two separate 20-fold reductions in attack-resource estimates, from the same research group, inside a single decade, is arguably more significant than either individual number. That’s the trend that moved Google’s internal calendar, not one paper.
One more detail worth knowing: Google didn’t publish the actual attack circuits. It used a zero-knowledge proof, developed in coordination with the U.S. government, that lets outside researchers verify the resource estimate without releasing a usable attack blueprint, an approach modeled on standard coordinated vulnerability disclosure practice.
NIST’s Slower, Still-Unfinished Deadline
Google’s 2029 timeline is the freshest news, but the post-quantum cryptography schedule most compliance teams actually have to plan against still comes from NIST. NIST finalized its first three post-quantum standards back in August 2024: FIPS 203 (ML-KEM, for key encapsulation), FIPS 204 (ML-DSA, for digital signatures), and FIPS 205 (SLH-DSA, a hash-based signature scheme). A fourth standard, FIPS 206, based on the Falcon algorithm, is still in draft and isn’t expected to finalize until late 2026 or early 2027. A fifth, HQC, selected as a backup key-encapsulation method in March 2025, won’t see a final standard until 2027 at the earliest.
The 2030 and 2035 dates you’ve probably seen cited everywhere actually come from a separate document, NIST Internal Report 8547, which proposes deprecating 112-bit-security algorithms like RSA-2048 and ECC P-256 by 2030, and disallowing all quantum-vulnerable public-key algorithms by 2035. Here’s the part that doesn’t get repeated often enough: IR 8547 is still an initial public draft. It was released in November 2024, public comment closed in January 2025, and it has not been finalized as of this writing. Treat the 2030 and 2035 dates as the most likely outcome of an open process, not as settled law, especially if your organization sits outside direct U.S. federal scope.
National security systems run on a separate, tighter clock. The NSA’s CNSA 2.0 guidance sets preference dates as early as 2025 for some categories, required adoption between 2030 and 2033, and full quantum resistance by 2035, with ML-KEM-1024 and ML-DSA-87 specified as the mandated parameter sets. If you’re a defense contractor or anywhere in that supply chain, this is the schedule that actually governs you, not IR 8547.
Where Other Governments Stand
Canada, the EU, and the UK are each running parallel post-quantum cryptography tracks, on slightly different clocks. If your organization operates across any of these jurisdictions, the deadline that matters is whichever one applies to your weakest-governed system, not the most generous one.
Authority
Key Deadline(s)
Status
NIST (U.S. civilian federal)
Deprecate by 2030, disallow by 2035
Draft (IR 8547), not finalized
NSA CNSA 2.0 (U.S. national security systems)
Required adoption 2030 to 2033, full by 2035
Active guidance
Google (internal corporate policy)
2029
Announced March 2026
Canada (federal departments)
Migration plans due April 2026
Active mandate
European Union (NIS Cooperation Group)
Critical infrastructure by end of 2030, medium-risk systems by end of 2035
Endorsed by 18 member states, June 2025
United Kingdom (NCSC)
Map dependencies by 2028, complete migration by 2035
Phased guidance, March 2025
Not Everyone Is Convinced This Is Urgent
Worth saying plainly: no quantum computer capable of breaking today’s public-key encryption exists yet. CISA’s own Post-Quantum Cryptography Initiative says so directly, while still flagging harvest-now-decrypt-later as a present-tense risk for long-lived data. Both statements are true at the same time, which is exactly why the expert debate over urgency hasn’t settled.
Scott Aaronson, the Schlumberger Centennial Chair of Computer Science at the University of Texas at Austin and one of quantum computing’s most consistent public skeptics, wrote in comments reported in early May 2026 that people whose hardware judgment he trusts more than his own now think a fault-tolerant, attack-scale quantum computer “ought to be possible by around 2029.” That’s a notable shift for Aaronson. It’s also worth knowing his own caveat: an earlier prediction of his would technically count as fulfilled even by a trivial demonstration, like factoring 15 into 3 times 5, a calculation a human can do faster by hand than any quantum computer currently running. Most headline coverage drops that part.
Matthew Green, a cryptography professor at Johns Hopkins University, takes a more grounded stance. In comments reported by CyberScoop in April 2026, Green called the recent research a useful precautionary exercise, but questioned whether quantum computing has enough near-term, lucrative applications to accelerate past foundational research into deployed attacks on the timeline implied by recent coverage. He raises a sharper point too: several of NIST’s own earlier post-quantum candidates turned out to have classical, non-quantum vulnerabilities. SIKE, one of the standardization process’s later-round finalists, was broken in 2022 using ordinary computers. Calling something “post-quantum” doesn’t automatically make it secure against everything else.
Adam Back, CEO of Blockstream and one of the cypherpunk movement’s earliest figures, pushed back specifically on cryptocurrency alarm following Google’s paper, telling Bloomberg the practical threat to Bitcoin remains decades off.
“The biggest calculation it’s performed is factoring 21 into 7 times 3.”
Adam Back, CEO, Blockstream
Back still thinks Bitcoin and other chains relying on the same elliptic curve signatures, the kind of dependency that also shows up in cross-chain bridge designs, should start migrating to quantum-resistant signatures now. He just doesn’t think anyone should be panicking about it this month.
The research group a16z crypto goes further, arguing the field isn’t close to a cryptographically relevant quantum computer by any reasonable reading of public progress data. Even reporting on Google’s own resource-estimate reduction tends to include the same caveat: shrinking the qubit count on paper doesn’t solve the unsolved systems-engineering problem of running hundreds of thousands of physical qubits with real-time error correction at scale. Reducing one bottleneck just exposes the next one.
What This Actually Means for Your Organization
Strip out the deadline debate and the actual post-quantum cryptography adoption gap is the unglamorous part. A Propeller Insights survey of 1,042 senior cybersecurity managers, commissioned by DigiCert and published in 2025, found that 69% of respondents recognize the quantum risk to current encryption, but only 5% have actually implemented quantum-safe encryption anywhere in their environment. Nearly half, 46.4%, believe a substantial share of their own encrypted data could eventually be compromised.
A separate Ponemon Institute study of 1,426 IT and security practitioners across the U.S., EMEA, and Asia-Pacific found 61% don’t expect to be ready, only 30% have allocated budget, and just 52% have even started a cryptographic inventory, the mandatory first step in any migration. A more recent Omdia survey of over 400 senior IT leaders, published in early June 2026, puts the share who’ve fully assessed their systems for cryptographic risk at just 22%.
None of that requires believing a quantum computer will exist next year. It requires believing harvest-now-decrypt-later is real today. Adversaries can capture encrypted traffic now and simply wait. Anything with a confidentiality requirement stretching into the mid-2030s, financial records, legal archives, government communications, long-lived intellectual property, is exposed under today’s encryption the moment it’s intercepted, regardless of when the decryption key eventually becomes breakable.
The takeaway isn’t “panic.” It’s “inventory now.” You can’t migrate what you haven’t found. NIST’s own migration methodology treats the inventory phase alone as a six-to-twelve-month project for a complex enterprise, before remediation even starts, which is exactly why most organizations need to begin before they feel ready.
This is the same regulator setting the clock on zero trust security architecture, so if your team is already mapping NIST-aligned controls for that initiative, cryptographic inventory belongs on the same project plan rather than a separate one.
A Practical Migration Checklist
Here’s the post-quantum cryptography migration sequence security teams are actually using, in order:
Run a cryptographic inventory. Find every system, certificate, library, and hardcoded dependency using RSA, ECDSA, ECDH, DSA, or Diffie-Hellman. Most teams underestimate how many places this math is buried.
Prioritize by data lifespan, not system criticality. A low-priority system with 20-year data retention requirements is a higher quantum risk than a high-priority system that only handles short-lived sessions.
Deploy hybrid cryptography first. Pairing a classical algorithm with a post-quantum one means you stay protected even if one half is later broken, which matters given Matthew Green’s point about unproven new candidates.
Treat signatures as time-sensitive on their own clock. Migrate authentication and signing separately from encryption, since forged signatures become possible the moment a capable quantum computer exists, with no advance-harvest grace period.
Wait on unfinished standards. Hold off building production dependencies on FIPS 206 (Falcon) or HQC until they’re finalized, expected sometime between 2026 and 2027.
Budget against the four-year window. Use Gartner’s “unsafe by 2029, fully breakable by 2034” framing as a planning heuristic for budget approval, not a precise countdown.
The Real Timeline vs. the Headlines
So which date should actually go on your roadmap? Probably more than one. Google’s 2029 is the most concrete forcing function available right now, especially since it comes from the organization that’s done the most original research on how hard this attack actually is. NIST’s 2030 and 2035 dates remain the closest thing to a regulatory backbone, even in draft form, and they’re the dates auditors, cyber insurers, and procurement teams will most likely reference once IR 8547 finalizes. The skeptics aren’t wrong that no cryptographically relevant quantum computer exists today. They’re just answering a different question than “when should my migration start.”
Our read: the binding constraint here isn’t compute, it’s organizational inertia. Most enterprises won’t miss the 2029 or 2030 deadlines because the cryptography isn’t ready. They’ll miss it because the inventory phase alone quietly eats two of the four years they thought they had.
The Y2K comparison shows up constantly in coverage of this story, and it’s useful shorthand with one real flaw: Y2K had a single, fixed, universally agreed date. Q-Day doesn’t. The Global Risk Institute’s seventh annual Quantum Threat Timeline Report, built from structured input from 26 named quantum-computing experts, puts a full-scale cryptographically relevant quantum computer at “quite possible” within 10 years and “likely” within 15. That’s a probability distribution, not a deadline. Plan accordingly.
Frequently Asked Questions
When will quantum computers be able to break encryption?
No cryptographically relevant quantum computer exists yet. The Global Risk Institute’s expert survey puts a full-scale version at “quite possible” within 10 years and “likely” within 15. Google’s own internal deadline targets 2029, six years ahead of NIST’s 2035 federal backstop.
What is NIST’s deadline for RSA-2048?
NIST’s draft document IR 8547 proposes deprecating RSA-2048 and ECC P-256 by 2030 and disallowing all quantum-vulnerable public-key algorithms by 2035. The document remains an unfinalized draft as of mid-2026, so treat the dates as a likely outcome, not finished law.
Why did Google move its quantum deadline to 2029?
Google cited faster than expected progress in quantum hardware and error correction, plus new research showing elliptic curve cryptography could be broken with roughly 20 times fewer qubits than previously estimated, published alongside its March 2026 deadline announcement.
What is harvest now, decrypt later?
It is an attack pattern where adversaries capture encrypted data today and store it, planning to decrypt it once a powerful enough quantum computer exists. It makes long-lived encrypted data vulnerable right now, even though no quantum computer can currently break it.
Is Bitcoin vulnerable to quantum computers?
Bitcoin’s signature scheme relies on the same elliptic curve math Google’s research targeted, so it is theoretically exposed long term. Most cryptographers, including Bitcoin advocate Adam Back, consider the practical threat years to decades away, but support migrating gradually now.
What to Watch Next
Here’s what you didn’t know a few minutes ago: the urgency in this post-quantum cryptography story isn’t coming from a finished government deadline. It’s coming from a trend line, two separate 20-fold reductions in attack-resource estimates from the same Google research group inside a decade, that’s compressing every other timeline built around it.
Over the next 6 to 18 months, watch three things. First, whether NIST finally finalizes IR 8547 or pushes the date again, the way an earlier proposed target was already revised once before. Second, whether other major infrastructure operators follow Cloudflare’s reported move to align with Google’s 2029 date, which would turn one company’s internal policy into something closer to an industry standard. Third, whether FIPS 206 and HQC actually land in their projected 2026 to 2027 window, since both are needed before several hybrid deployment strategies can fully mature.
None of this requires belief in an imminent Q-Day. It requires an honest inventory, a realistic budget conversation, and a migration plan that survives whichever date turns out to be the right one.
By NeuralWired Staff · June 20, 2026 · 12 min read
In April 2026, Uber’s engineering organization ran out of its entire annual AI coding budget two-thirds of the way through the year. Two months later, Microsoft pulled back most internal developer access to Claude Code over the same problem: cost. Neither company is careless with money. Both got caught by the same math now hitting finance teams across the industry: token prices are falling, but the bill keeps climbing.
If part of your job in 2026 is figuring out how to reduce LLM inference cost across an enterprise deployment, “wait for prices to drop further” stopped being a strategy the moment it failed at Uber and Microsoft. What works instead is an actual cost architecture, built from seven specific moves. Some you can ship this week. Some take a quarter to stand up properly.
Quick answer: Per-token LLM prices have fallen as much as 280-fold since 2022, yet enterprise AI bills keep rising. The reason is agentic workflows, which burn 5 to 30 times more tokens per task than a simple chatbot query, according to Gartner, with adoption accelerating faster than unit prices fall. Cutting your real bill takes architecture, not patience: prompt caching, smart model routing, inference-stack tuning, agentic spend controls, sound self-host-versus-API math, FinOps-grade attribution, and pre-deployment cost modeling.
Why Falling Token Prices Won’t Reduce Your LLM Inference Cost
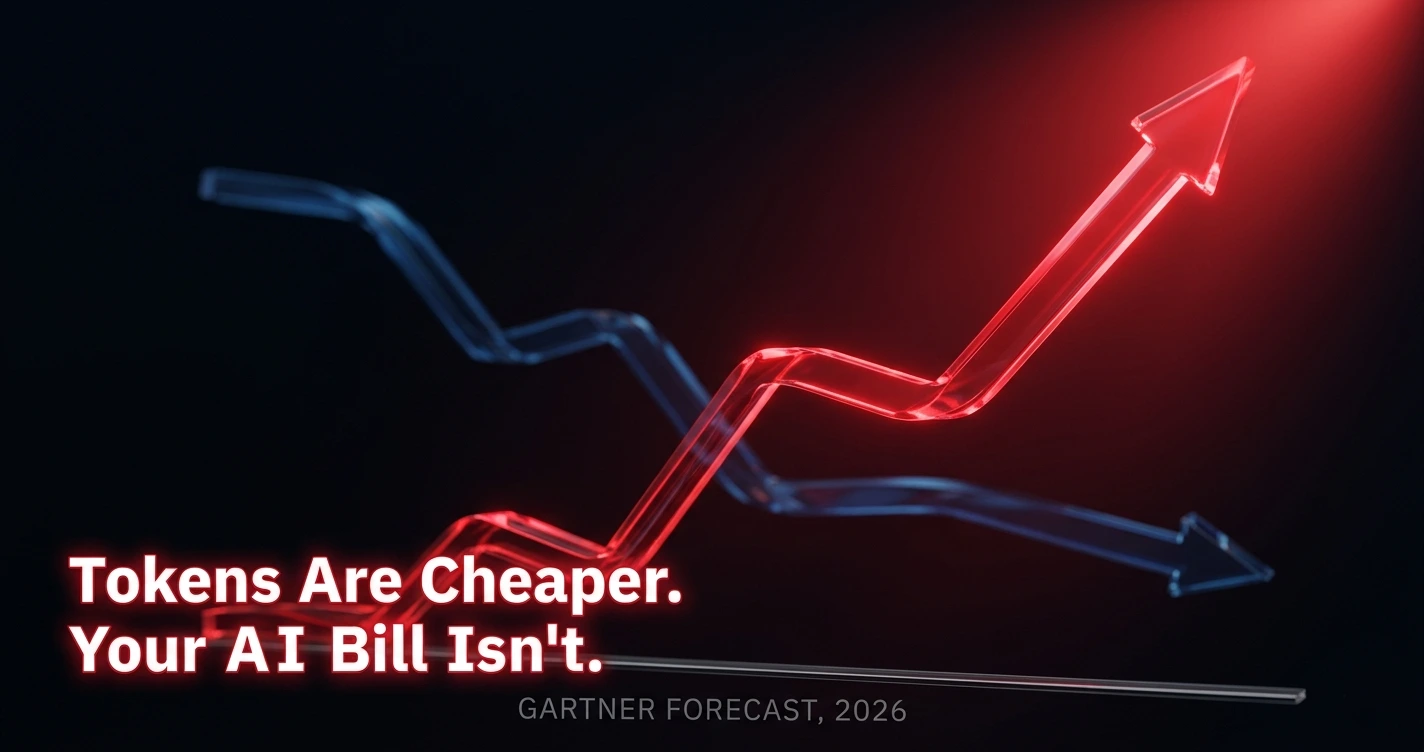
Here’s the number every “AI is getting cheaper” headline traces back to. Gartner forecasts that by 2030, running inference on a one-trillion-parameter model will cost providers more than 90% less than it did in 2025, with LLMs overall becoming up to 100 times more cost-efficient than the earliest 2022-era models of similar size, per Gartner’s March 2026 forecast. Stanford’s AI Index already clocked a 280-fold drop in GPT-3.5-equivalent inference pricing between late 2022 and late 2024.
None of that is showing up as savings on enterprise invoices. Gartner says so explicitly, and so does the analyst who built the forecast.
“Chief Product Officers (CPOs) should not confuse the deflation of commodity tokens with the democratization of frontier reasoning.”
Will Sommer, Senior Director Analyst, Gartner, via Gartner
Translation: cheap tokens fund better models, not smaller bills. Demand, meanwhile, is exploding underneath the price drop. Agentic models require 5 to 30 times more tokens per task than a standard chatbot exchange, per Gartner, and Goldman Sachs projects global token consumption will climb roughly 24-fold by 2030, reaching something like 120 quadrillion tokens a month. That’s Jevons Paradox playing out in real time: a 160-year-old economic principle stating that efficiency gains tend to increase total consumption rather than reduce it. Cheaper tokens have historically unlocked more AI usage, not lower total spend.
This has also stopped being a quiet, internal cost-center problem. An AI consultant told Axios that one unnamed enterprise reportedly burned through roughly $500 million in Claude API spend in a single month after failing to set employee usage limits (treat that figure as reported, not officially confirmed; no company has put its name on it). What is confirmed: the Linux Foundation announced a new standards body, the Tokenomics Foundation, in the first week of June 2026, modeled directly on how the FinOps Foundation standardized cloud-cost discipline a decade earlier. When an industry spins up a dedicated standards body to police a cost problem, that problem has stopped being optional to manage.
The 7-Step Framework to Reduce LLM Inference Cost at Enterprise Scale
Treat the list below as a stack, not a checklist. The first two steps are mechanical and fast, most teams see results within days. The last three are organizational and slower, taking a quarter to stand up properly, but they’re what stops the bill from doubling again next year.
Step
What it fixes
Time to first results
1. Prompt caching
Repeated context reprocessed on every single call
Days
2. Model routing & cascading
Frontier pricing applied to tasks a small model could handle
1–2 weeks
3. Inference-stack tuning
Batching and decoding choices mismatched to traffic
2–4 weeks
4. Agentic token-sprawl control
Ungoverned agents multiplying spend with no budget ceiling
2–4 weeks
5. Self-host vs. API math
Hidden personnel costs erasing on-paper savings
4–6 weeks
6. FinOps-grade attribution
No one can say which team or agent is spending what
1–2 quarters
7. Pre-deployment cost modeling
Cost surprises discovered after a feature ships
Ongoing
Step 1: Turn On Prompt Caching First
If you do exactly one thing this week, do this one. Prompt caching stores the computed representation of a prompt’s repeated prefix, things like system instructions, tool definitions, and reference documents, so later calls skip reprocessing it from scratch. Anthropic made it generally available on December 17, 2024, pricing cached input tokens at roughly 10% of standard input cost, with cache writes running 1.25 to 2 times standard pricing depending on how long the cache is held.
Anthropic’s own figures claim up to 90% cost reduction and 85% latency reduction on long prompts. Vendor claims are easy to discount, except this one has independent backing: a 2026 academic evaluation titled “Don’t Break the Cache” ran the first comprehensive third-party test across three major LLM providers on long-horizon agentic tasks and found real-world savings of 41 to 80%. That’s the single most defensible number in this whole article: a vendor claim and an independent study landing in the same range.
“We’re excited to use prompt caching to make Notion AI faster and cheaper, all while maintaining state-of-the-art quality.”
Simon Last, Co-founder, Notion, via Anthropic
Implementation here is an engineering task, not a procurement project. Most teams can audit their cache hit-rate and restructure prompts (static content first, variable content last) inside a single sprint.
Step 2: Route and Cascade, Don’t Just Pay Frontier Prices for Everything
Routing sends each request to the cheapest model that can actually handle it. Cascading starts cheap and escalates only when a quality check fails. Stanford’s FrugalGPT, the paper that founded this whole technique, showed up to 98% cost reduction while matching the best individual model’s performance. UC Berkeley’s RouteLLM project later trained a classifier that hit 95% of GPT-4-level quality at 85% lower cost on MT-Bench, and comparable quality at 45% lower cost on MMLU.
Treat those percentages as proof the technique works, not as a number to promise finance. Both figures are tied to one specific model pairing on two specific benchmarks. Your prompts and your traffic will produce a different result, so run the eval on your own workload before it goes into a budget deck.
We already broke down the small-versus-frontier pricing tables, the self-hosting break-even math, and named enterprise case studies in our companion piece, GPT-5 vs Small Language Models: 2026 Enterprise Cost. If routing is the step you want to go deep on, that’s where the depth lives. Here, the point is narrower: routing is one piece of a seven-piece architecture, not the whole fix.
Step 3: Tune the Inference Stack to Your Actual Traffic
This is where “obvious” optimizations get dangerous. Speculative decoding is marketed as a clean win: predict several tokens ahead, verify them in parallel, cut latency and cost together. At small batch sizes (16 or fewer concurrent requests), independent energy-efficiency research found it cuts cost by up to roughly 29%. At large batch sizes (128 concurrent requests), the same technique increased total energy cost by roughly 25.65%.
Same technique, opposite result, depending entirely on traffic pattern. Batching, hardware allocation, and decoding strategy aren’t settings to copy from a blog post. They’re decisions that need your own load data behind them, and most teams haven’t measured their traffic closely enough to know which side of that line they’re actually on.
Step 4: Put a Leash on Agentic Token Sprawl
This is the fastest-growing line item, and the one with the least governance attached to it. EY’s analysis found the cost of a single agentic customer-service interaction rose from roughly $0.04 in 2023 to $1.20 in 2026, a roughly 30-fold increase, driven by orchestrated multi-tool agent workflows replacing simple linear chatbot exchanges.
The fix is governance, not a model swap: per-agent token budgets, hard ceilings on tool-call chains, and visibility into which agent, team, or feature is generating which slice of the bill. We covered the broader shadow-AI version of this problem, agents spun up without IT’s knowledge, quietly multiplying spend nobody’s tracking, in AI Agent Sprawl: The Shadow AI Crisis Hitting Enterprise. If ungoverned agent proliferation is your specific problem, start there.
Step 5: Get the Self-Host vs. API Math Right
Self-hosting looks cheaper on a per-token spreadsheet, and often isn’t, once the team required to run it gets added in. Maintaining a fine-tuned or self-hosted model typically costs $180,000 to $300,000 a year per ML engineer, and round-the-clock coverage adds another $800,000 to $1.2 million annually. Run that math forward and the break-even point lands around 500,000 tokens per day of sustained load. Below that, API-based smaller models beat self-hosting on total cost. Above it, self-hosting can pay off, assuming the team is already in place rather than hired specifically for this.
(If you’re staffing up purely to bring a model in-house, you’ve likely already lost the math before writing a line of code.)
Step 6: Build FinOps-Grade Cost Attribution
The share of FinOps teams managing AI spend rose from 31% to a projected 98% in two years, according to a survey of 1,192 practitioners representing more than $83 billion in annual cloud spend. That’s not a niche trend. That’s an entire discipline getting rebuilt around one new line item.
“In April and May, I started hearing from companies: ‘Oh my god, we are 3x over our entire 2026 token budget and it’s only April.’ We started hearing existential crises, and the whole conversation shifted from tokenmaxxing and ‘go fast’ to ‘we need guardrails, how do we control this?’”
J.R. Storment, Executive Director, FinOps Foundation, via TechCrunch
The Tokenomics Foundation, announced by the Linux Foundation in the first week of June 2026 and set to formally launch in July, exists to standardize exactly this: canonical metrics like cost-per-intelligence and tokens-per-watt, the same way the FinOps Foundation standardized cloud-cost discipline a decade ago.
“AI is forcing FinOps to answer a harder question. It’s not ‘what did we spend?’, it’s ‘what did we actually get out of that spend?’ The hardest part of AI isn’t building it, it’s proving it was worth it.”
Rajeev Laungani, Head of Product, Virtasant, via Virtasant
Practically, this means cost attribution by team, feature, and agent, not just one line on a monthly invoice. Build it before finance asks for it. At this point, they will.
Step 7: Model Cost Before You Ship, Not After
Engineering platform Jellyfish analyzed production usage data across its customer base and found the developers consuming the most AI tokens were roughly twice as productive, but used ten times the tokens to get there. Per-developer token consumption rose roughly 18.6-fold in nine months.
Is that a good trade? Nobody actually knows yet, and that’s the real problem with treating cost optimization as a purely engineering exercise.
“Whether extreme spend pays off comes down to the ultimate business value of shipped code (e.g. revenue), which most companies still can’t measure.”
Nicholas Arcolano, Head of Research, Jellyfish, via TechCrunch
The shift this forces: a cost model needs to exist before a feature ships, not get reconstructed from an invoice afterward. Our deeper reporting on why so many AI deployments never get to prove that value lives in Enterprise AI Failure Rate 2026: MIT Says 95% Miss ROI.
Where This Framework Breaks Down
Every one of the seven steps above is real and verifiable. None of them reverses the underlying economics, and an honest article says so.
Jevons Paradox is the structural problem. Efficiency gains increase total consumption rather than reducing it, and that’s exactly what’s happening with token pricing. Optimization slows the rate at which your bill grows. It does not reliably make the bill go down once agentic adoption is already underway across your organization.
Gartner’s own analyst makes the sharpest version of this argument, and it’s worth taking seriously precisely because it comes from the firm that published the optimistic 90%-by-2030 number in the first place. Token deflation, in his framing, helps providers fix their own margins long before any of it reaches the enterprise customer.
“The customer isn’t going to see all of this money.”
Will Sommer, Senior Director Analyst, Gartner, via CIO Dive
Measurement itself is still broken, too, which undercuts any specific savings percentage offered without an attribution system already in place.
“Even getting clarity on relatively basic metrics, like the number of tokens being used, works differently in different areas. It’s very fragmented across providers and even across services within a single provider.”
Jon Thompson, CTO, Virtasant, via Virtasant
Our read: this framework will slow your bill’s growth rate. It will not reliably shrink the bill itself, not while agentic adoption is still in its land-grab phase across the industry. The honest claim is “stop runaway growth and start measuring,” not “halve your invoice by next quarter.” Anyone promising the second one is selling something.
What to Watch Over the Next 6 to 18 Months
July 2026: The Tokenomics Foundation formally launches. Watch whether its proposed metrics, cost-per-intelligence and tokens-per-watt, actually get adopted by vendors, or stay aspirational.
Late 2026 into 2027: Goldman Sachs projects token consumption climbing toward 24 times current levels by 2030. If that holds even roughly, expect more public “3x over budget” stories like Uber’s, not fewer.
Ongoing: Whether Anthropic, OpenAI, and Google start publishing standardized, comparable token-accounting data, the same shift cloud computing went through when FinOps forced billing transparency a decade ago.
Frequently Asked Questions About Enterprise LLM Cost Optimization
Why are AI inference costs rising if token prices are falling?
Per-token prices have fallen as much as 280-fold since 2022, but total enterprise spend is rising because agentic workflows use 5 to 30 times more tokens per task than simple chatbot queries, according to Gartner, and adoption is accelerating faster than unit prices decline.
What is prompt caching and how much does it save?
Prompt caching stores a prompt’s repeated prefix, such as system instructions, tools, and documents, so later requests skip reprocessing it. Anthropic reports up to 90% cost reduction and 85% latency reduction on long prompts; independent academic research confirms 41 to 80% real-world savings on agentic workloads.
What is LLM model routing or cascading?
Routing sends each request to the cheapest capable model; cascading starts small and escalates only if a quality check fails. Stanford’s FrugalGPT framework demonstrated up to 98% cost reduction using this approach while matching the performance of the best individual model.
Is it cheaper to self-host an LLM or use an API?
It depends on volume. Below roughly 500,000 tokens a day of sustained load, API-based smaller models typically beat self-hosting once you account for ML engineer salaries and round-the-clock operations coverage. Above that threshold, self-hosting can pay off.
How much does GPT-5-class inference cost in 2026?
OpenAI’s frontier model runs roughly $5.00 per million input tokens and $30.00 per million output tokens as of mid-2026, while budget-tier alternatives like Microsoft’s Phi-4 cost roughly $0.065 to $0.14 per million tokens, a difference of more than 70 times for tasks that don’t need frontier-level reasoning.
The Bottom Line on Reducing Enterprise LLM Inference Cost
Here’s what changes once you’ve read this far: you stop waiting for token prices to fix your budget, because they won’t, not at the rate agentic adoption is growing. You start treating LLM cost the way mature engineering organizations treat any other infrastructure spend, with caching turned on by default, routing decisions backed by your own evals instead of someone else’s benchmark, agent budgets that exist before an agent ships, and a cost model built before a feature launches instead of reconstructed from an invoice afterward.
Three things to do this week: pull your prompt-caching hit-rate and see how far it sits from Anthropic’s claimed ceiling. Set a hard per-agent token budget on whatever’s currently ungoverned. And ask finance whether anyone owns AI cost attribution yet, because if the FinOps Foundation’s numbers hold, 98% of FinOps teams will own a piece of it within the year, whether or not engineering looped them in first.
Reducing enterprise LLM inference cost in 2026 was never going to be about waiting for cheaper tokens. It’s about building the architecture that makes the token price you already have work for your budget instead of against it.
Want the next breaking development on enterprise AI economics before your competitors see it? Subscribe to The Neural Loop at neuralwired.com/newsletter.
How Often Should You Retrain an ML Model? Google’s Data
MLOps / Production ML
How Often Should You Retrain an ML Model? Google’s Data
A 450,000-model study out of Google and UC Berkeley just answered a question most MLOps teams have been guessing at for years, and the answer has almost nothing to do with drift schedules.
Somewhere inside Google, an ML pipeline retrained itself nine times before lunch and shipped exactly one of those runs to production. That is not a glitch in someone’s dashboard. It is the production reality behind a question every CTO funding a machine learning team eventually asks: how often should you retrain a machine learning model? A study from Google and UC Berkeley researchers, built on provenance data covering 3,000 production pipelines and more than 450,000 trained models, finally answers it with real numbers instead of conventional wisdom. The answer is stranger, and more useful, than picking a calendar cadence or chasing drift alerts.
Most retraining advice circulating online treats cadence like a calendar problem: pick weekly, monthly, or quarterly, and move on. The Google data suggests the real bottleneck isn’t how often models get retrained. It’s how rarely those runs actually matter once they’re finished.
The study behind these numbers comes from Doris Xin, Hui Miao, Aditya Parameswaran, and Neoklis Polyzotis, who analyzed the full provenance graph of production ML pipelines inside Google over a four-month window: 3,000 pipelines, 450,000-plus trained models, every training run and every push tracked end to end. It’s one of the largest empirical looks anyone has published at what production ML actually does, as opposed to what teams assume it does.
The numbers don’t match the “quarterly refresh” mental model most engineering orgs still budget around.
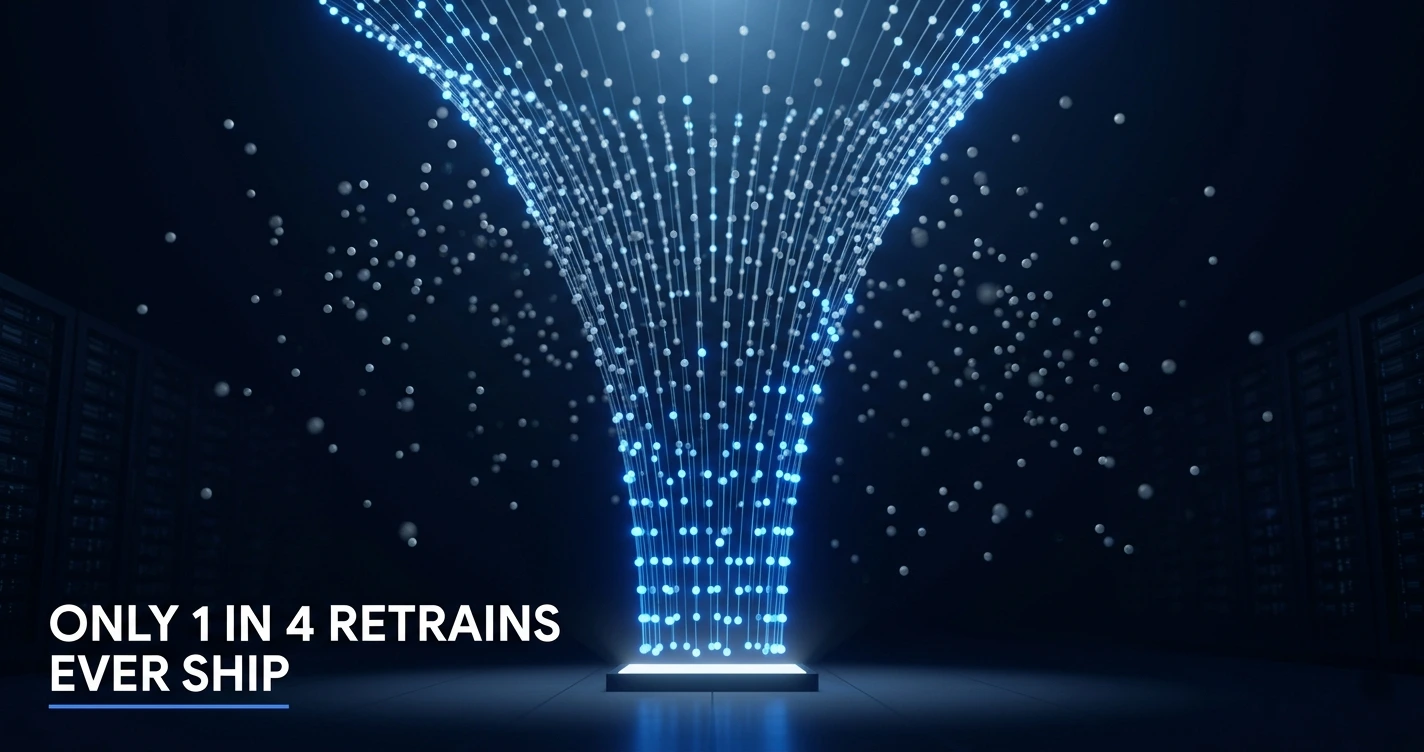
If your team is retraining far less than seven times a day, that’s not necessarily a problem. Google’s pipelines include extremely high-velocity systems (ad ranking, search relevance) that skew the average up. But the second number matters regardless of your industry: only about one in four of those models ever ships. The rest, roughly 80 percent, get trained and quietly discarded.
The Habit Nobody Budgets For
Most retraining compute buys nothing
For every four models retrained inside Google’s pipelines, only one reached production. The other three consumed GPU hours, engineering attention, and CI capacity, then went nowhere. At a mean training time of 168 hours per model, that’s not a rounding error. It’s a budget line most platform teams don’t separate out, because most dashboards only track “models trained,” not “models trained and discarded.”
This is the number that should reframe the cadence conversation. The question isn’t “are we doing this often enough.” It’s “what happens to the three out of four runs that don’t ship, and why.”
Why Drift Might Be the Wrong Villain
The instinctive answer is drift: the model degraded, the data moved, the model didn’t keep up, so it got rejected. The Google researchers tested that instinct directly, and it didn’t hold up.
They compared models that got pushed to production against models that didn’t, looking specifically at input-data similarity and code-change rates between the two groups. If drift or code changes were driving the decision to deploy, you’d expect a clear gap. There wasn’t one: data similarity scored 0.101 for pushed models versus 0.099 for unpushed ones, and code-match rates came in at 84.6% versus 83.8%. Statistically, that’s noise, not signal.
So if drift isn’t the reason most runs die quietly, what is? The researchers point to pipeline-level inefficiency and push-rate throttling instead, meaning the bottleneck sits in process and infrastructure, not in the data the model is learning from.
“Or another aspect is model drift. Things change over time.”
Chip Huyen, ML engineer and author, TechTarget
Huyen’s point is correct and worth holding alongside the Google data rather than against it: drift is real, and it’s common. A 2022 study in Scientific Reports by Vela et al. tested 128 model-dataset combinations across healthcare, weather, airport traffic, and finance, and found measurable temporal degradation in 91% of pairs. That figure is genuine and peer-reviewed (read more in our breakdown of the underlying drift mechanics), but it measures whether degradation happens at all, not whether degradation is what’s killing your discarded retrains specifically. Those are two different claims, and conflating them is how “drift” becomes the catch-all explanation for problems that are really about pipeline design.
Our read: if your team explains every discarded retrain as “drift,” you’re probably explaining away a pipeline problem, not a data problem. Researchers Shreya Shankar, Rolando Garcia, Joseph Hellerstein, and Aditya Parameswaran reached a related conclusion from a different angle: in 18 interviews with practicing ML engineers at companies running chatbots, autonomous vehicles, and finance systems, they found that engineers consistently treat production behavior as something that can’t be fully known until the model is live, which is precisely why monitoring infrastructure, not retrain frequency, ends up being the deciding factor in whether a model ships.
There’s a second failure mode hiding in here too: alert fatigue. Statistical drift tests like the Population Stability Index and the Kolmogorov-Smirnov test routinely flag distribution shifts that never translate into a measurable performance drop, a pattern confirmed across multiple independent analyses (arXiv:2003.12808). Teams that don’t tune thresholds to actual business impact eventually start ignoring alerts altogether, real ones included. That’s arguably a bigger operational risk than drift itself, and it’s a pipeline-design problem too, not a data problem.
This lines up with broader patterns we’ve tracked in MLOps pipeline failures: the infrastructure layer, not the model layer, is where most production ML actually breaks.
Building a Retrain Schedule That Matches Production, Not a Calendar
If push-rate, not how often you retrain, is the real lever, your policy should be instrumented around it instead. Four steps, in order:
1. Baseline your own push rate first
Before touching your retrain schedule, measure how many of your team’s runs actually reach production today. That number, not your calendar, is your true starting point.
2. Track “retrained” and “deployed” as separate metrics
Most teams report retrain count as a proxy for ML activity. Splitting it into trained versus deployed exposes exactly the gap Google’s data found, and tells you where compute is leaking.
3. Instrument the deploy decision itself
Log the reason every retrained model did or didn’t ship: performance gate, manual review, throttling, rollback. That log tells you more about your real bottleneck than a drift dashboard ever will.
4. Use the 40-hour benchmark as a sanity check, not a target
Google’s pipelines averaged roughly 40 hours between deployed models. If your gap looks wildly different in either direction, investigate that gap before you touch the retrain calendar at all.
Decisions like these tend to fall on whoever owns ML infrastructure, a role that, per our reporting on the enterprise AI skills gap, many organizations still haven’t clearly assigned.
When Nobody Catches It in Time
Process gaps like these aren’t abstract. Zillow’s iBuying arm, Zillow Offers, shut down in November 2021 after its pricing models systematically overvalued homes the company then had to sell at a loss. The numbers, from Zillow’s own Q3 2021 SEC filing, were stark: a $304 million quarterly operating loss, $175 to $230 million in additional impairment costs, and a roughly 25 percent workforce reduction.
“We were unintentionally purchasing homes at higher prices.”
Rich Barton, Co-founder & CEO, Zillow Group, GeekWire
We’ve covered the full Zillow case study in detail elsewhere, so we won’t retell it here. The relevant point for this article: Zillow’s failure wasn’t primarily a story about retraining too rarely. It was a story about a pricing signal that kept degrading without anyone instrumenting the gap between “the model said X” and “X turned out to be wrong,” which is the exact same blind spot the Google study found at much smaller, less catastrophic scale across thousands of unremarkable pipelines.
Frequently Asked Questions
What is model drift in machine learning?
Model drift is the gradual decline in a deployed model’s predictive accuracy as real-world data or relationships diverge from training conditions. It shows up as data drift, where inputs change, or concept drift, where the relationship between inputs and outputs changes entirely.
How often should you retrain a machine learning model?
There is no universal schedule. Production data from a 450,000-model Google study shows pipelines retrain roughly seven times a day on average, but only about one in four of those retrained models ever gets deployed, so cadence matters less than your deploy-decision process.
What is the difference between data drift and concept drift?
Data drift means the distribution of input features shifts while the relationship between inputs and outputs stays the same. Concept drift means that relationship itself breaks, so an input that looked normal now warrants a different correct answer, which makes it harder to catch.
Does model drift cause most ML deployment failures?
Not necessarily. A Google and UC Berkeley study of 450,000 production models found no meaningful difference in data similarity or code changes between models that got deployed and models that did not, suggesting pipeline inefficiency, not drift, explains most discarded retrains.
How do you detect model drift?
Compare live production data against a training baseline using statistical tests like the Population Stability Index or the Kolmogorov-Smirnov test, paired with direct performance tracking against labeled outcomes. Watch for alert fatigue: poorly tuned thresholds flag shifts that never affect real accuracy.
The Bottom Line
The number worth carrying out of this article isn’t 91 percent (how often models drift) or even seven times a day (how often Google’s pipelines retrain). It’s one in four: how often a retrain actually earns its compute. Most conversations skip straight from “is our model degrading” to “how often should we retrain,” without ever asking whether that cadence was the bottleneck in the first place.
Over the next 6 to 18 months, expect this question to get more urgent, not less. Gartner forecasts worldwide AI spending will hit $2.59 trillion in 2026, up 47% year over year, and the same firm predicts that 40% of organizations deploying AI will adopt dedicated observability tooling by 2028. Budget is arriving faster than judgment about where to point it. The teams that benchmark their own push rate now, before the next wave of tooling spend, will be the ones who can tell the difference between buying real visibility and buying a more expensive version of the same blind spot.
It’s also worth keeping this separate from the broader AI-project failure narrative. The 70 to 95 percent failure-rate figures that get cited from MIT, Gartner, and RAND research on AI ROI are measuring pilot-to-production failure broadly, for reasons that often have nothing to do with this issue specifically. Treating them as the same problem inflates the apparent size of the drift issue and obscures the much narrower, much more fixable pipeline question this study actually answers.
Three things to watch from here: whether more vendors start publishing push-rate benchmarks the way this Google study did, whether the EU AI Act’s risk-monitoring provisions start requiring documented retrain-versus-deploy decisions rather than just drift scores, and whether the same questions get applied to hosted LLM and agent pipelines, where there’s often no training data to inspect at all. That last one is where this entire conversation is heading next.
95% of Enterprise AI Pilots Fail to Deliver ROI | NeuralWired
Enterprise AI • Research Analysis
95% of Enterprise AI Pilots Fail to Deliver ROI. Four Research Teams Just Confirmed It.
By NeuralWired Editorial • June 19, 2026 • 12 min read
Your company just spent six months and a million dollars on a generative AI pilot. The vendor demos looked flawless. The internal presentations sparked genuine excitement. Then the results came in, and nothing moved. Not revenue. Not costs. Not customer retention.
If that sounds familiar, you are in the majority. A large, expensive, embarrassingly well-funded majority.
Four major research institutions, using four separate methodologies, all landed on the same uncomfortable finding about enterprise AI investment in 2025: somewhere between 60% and 95% of organizations are spending real money on AI and producing nothing measurable in return. The AI ROI crisis is not a pessimist’s talking point anymore. It is the consensus position of the best-sourced data in the field.
Here is what the research actually shows, why the failures keep happening, and what the small group of winners is doing that everyone else isn’t.
The Real Numbers: What Four Independent Studies Found
The most important thing to know before citing any AI failure statistic is that several of the most-shared numbers online are not traceable to real research. A figure that circulated widely in early 2026, claiming “$684 billion invested with 80.3% producing nothing,” appears across dozens of content sites but traces back to no primary dataset, no named methodology, and no actual report. It is not from RAND. It is not from Gartner. It does not exist in the primary literature.
What does exist is more interesting, and more damning.
95%
of GenAI pilots show zero measurable P&L impact
MIT Project NANDA, July 2025
39%
of organizations report any enterprise-wide EBIT impact from AI
McKinsey State of AI 2025
42%
of companies abandoned most of their AI initiatives in 2025, up from 17% in 2024
S&P Global Market Intelligence, March 2025
25%
of AI initiatives delivered expected ROI, per CEO self-report
IBM Institute for Business Value, May 2025
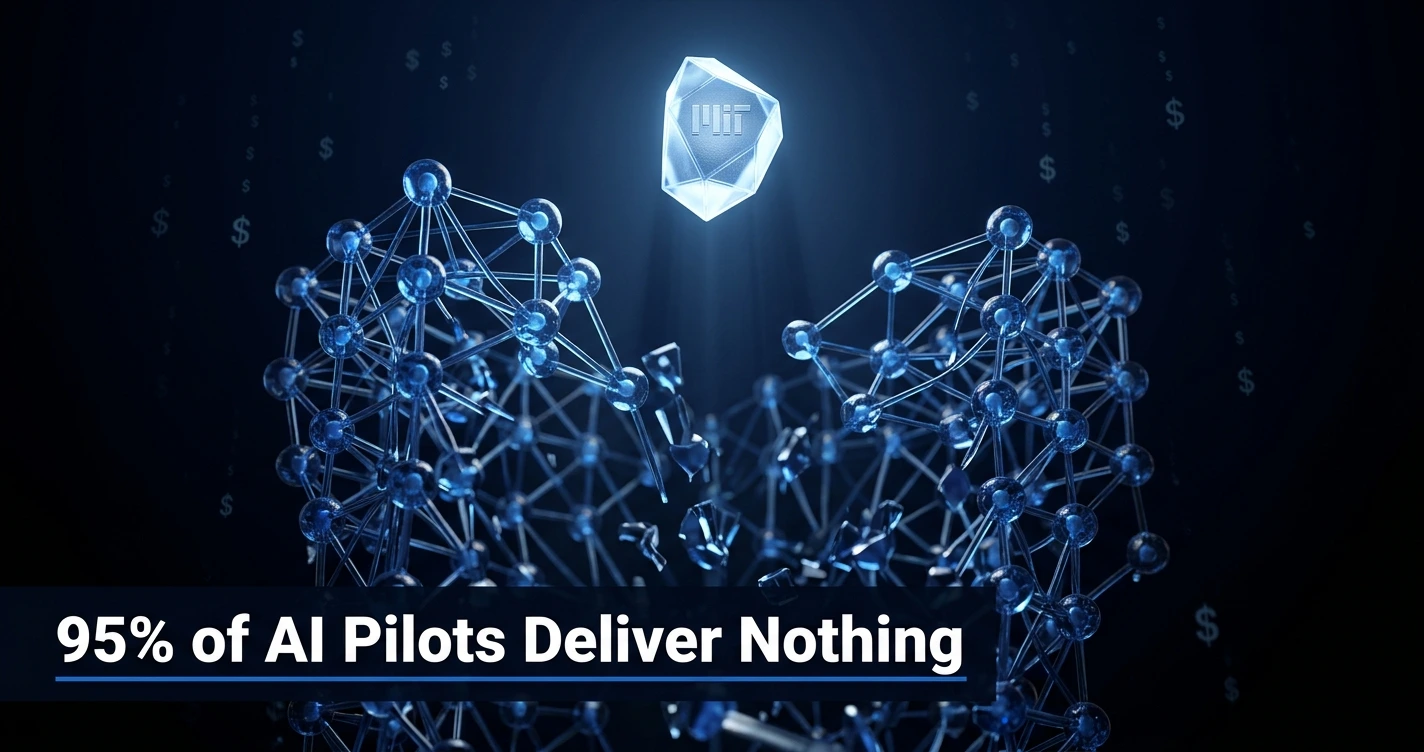
MIT’s Project NANDA published the sharpest number. Their GenAI Divide: State of AI in Business 2025 report reviewed over 300 publicly disclosed AI initiatives and conducted structured interviews with representatives from 52 organizations, plus survey responses from 153 senior leaders. The finding: 95% of GenAI pilots delivered no measurable profit-and-loss impact. Only 5% of integrated systems created significant value.
McKinsey’s State of AI 2025 is the largest survey, with nearly 1,993 respondents across 105 countries. It found that just 39% of organizations report any enterprise-wide EBIT impact from AI. Only about 5.5% to 6% of respondents qualify as true high performers, meaning their organizations attribute more than 5% of EBIT to AI use.
S&P Global Market Intelligence surveyed more than 1,000 respondents across North America and Europe in March 2025 and found that the share of companies abandoning most of their AI initiatives jumped to 42% in one year, up sharply from 17% the prior year. The average organization scrapped 46% of AI proof-of-concepts before they ever reached production.
The IBM Institute for Business Value CEO Study surveyed 2,000 CEOs across 33 countries and found that only 25% of AI initiatives had delivered expected ROI over the preceding few years, and only 16% had scaled enterprise-wide.
Key Context
These four studies use different definitions of “failure” and different methodologies. MIT tracks GenAI pilots specifically on P&L impact. McKinsey tracks EBIT at enterprise scale. S&P tracks initiative abandonment rates. IBM tracks CEO self-reported ROI. The fact that all four land in the same territory (a small single-digit percentage of organizations capturing most of the value) is more persuasive than any single number would be on its own.
For spending context: Stanford HAI’s AI Index 2025 tracked $252.3 billion in corporate AI investment in 2024, with private investment climbing 44.5% year-over-year. Gartner forecasts worldwide AI spending will reach $2.52 trillion in 2026. The money is real. The returns, for most organizations, are not.
Why Enterprise AI Projects Actually Fail
The RAND Corporation’s 2024 qualitative study, based on interviews with 65 experienced AI and machine learning practitioners, is explicit: “By some estimates, more than 80% of AI projects fail. That’s twice the failure rate of non-AI IT projects.” RAND framed this as an estimate rather than a hard statistic, which is the intellectually honest position. But the directional claim is consistent with every quantitative study that followed.
What RAND and the subsequent research agree on is that the failure causes are almost never technical. Models work. APIs work. The infrastructure, mostly, works. The failures are organizational.
The Integration Gap
McKinsey’s data reveals something counterintuitive: function-level AI wins (software engineering and IT teams seeing 10% to 20% cost reductions, for example) coexist with near-zero enterprise-wide EBIT impact. Teams are building AI tools. Those tools are producing local efficiencies. But the enterprise-level needle doesn’t move because the tools exist inside departmental silos, disconnected from the workflows that drive revenue and cost at scale.
The organizations in McKinsey’s high-performer cohort are not running more pilots. They are forcing workflow redesign. There is a meaningful difference between adding AI to an existing process and redesigning the process around AI’s actual capabilities.
The Data Readiness Problem
Gartner predicted in July 2024 that at least 30% of generative AI projects would be abandoned after proof of concept by end of 2025, citing poor data quality, inadequate risk controls, escalating costs, and unclear business value. Gartner’s June 2025 follow-up extended that prediction to agentic AI: over 40% of agentic AI projects are expected to be canceled by end of 2027, for essentially the same reasons.
The pattern Gartner keeps documenting is that most enterprise AI failures trace upstream to data infrastructure, not model selection. Organizations with fragmented, inconsistent, or poorly governed data are running state-of-the-art models on inputs that guarantee mediocre outputs. The models perform exactly as well as the data allows. The data, in most enterprises, does not allow much.
The FOMO-Driven Pilot Problem
IBM’s CEO study names a failure mode that does not appear in the other research but is instantly recognizable to anyone who has sat through an enterprise AI strategy meeting: “FOMO-driven” pilots. Organizations launch AI initiatives because competitors are launching AI initiatives, not because they have identified a specific problem that AI is the right tool to solve. The result is a portfolio of proofs-of-concept that demonstrate capability without establishing business value, and that get quietly shelved when the next technology cycle begins.
“Some large companies’ pilots and younger startups are really excelling with generative AI. It’s because they pick one pain point, execute well, and partner smartly with companies who use their tools.”
Aditya Challapally, Lead Author, MIT NANDA GenAI Divide Report (Fortune, August 2025)
The “one pain point” framing is more radical than it sounds. Most enterprise AI strategies involve multiple simultaneous pilots across multiple functions. The MIT data suggests that approach produces 95% failure rates. The alternative is a level of focus that most organizations, politically and structurally, find difficult to achieve.
What the 5% of Winners Do Differently
BCG’s Widening AI Value Gap report (published September 2025, surveying 1,250-plus global firms) found that only 5% of companies are achieving AI value at scale. BCG calls this cohort “future-built” firms. They share specific structural traits, not just better models or more budget.
What Average Firms Do
What Future-Built Firms Do
Multiple simultaneous pilots across functions
Single focused use case with defined P&L ownership
Measure success by pilot completion
Measure success by business metric change within 90 days
Deploy AI into existing workflows
Redesign workflows before and during AI deployment
Data readiness addressed post-launch
Data infrastructure audited and fixed before launch
AI team isolated in IT or innovation lab
AI ownership embedded in business unit P&L
“Agentic AI isn’t a future concept. It’s already reshaping workflows and redefining roles. Companies should view it as the next step in scaling AI, not as the starting point.”
Amanda Luther, Managing Director and Senior Partner, Boston Consulting Group, co-author of The Widening AI Value Gap
BCG’s data also shows that 60% of companies are not achieving material value at all, reporting minimal revenue and cost gains despite substantial investment. The distribution is not a bell curve. It is a winner-take-most dynamic where a small cohort is pulling away from the field. The companies in that cohort are not smarter. They moved earlier on data infrastructure, defined success in business terms before launch, and treated AI deployment as a change-management problem rather than a technology rollout.
If you’re building an enterprise AI program and you haven’t done a formal audit of your data readiness before approving new spend, Gartner’s prediction applies directly to you.
The Skeptic’s Case: Is the AI Failure Narrative Overblown?
The most credentialed critic of the 95% figure is Paul Roetzer, founder and CEO of the Marketing AI Institute. Speaking on The Artificial Intelligence Show in August 2025, Roetzer was direct about the MIT NANDA methodology: “Please don’t put any weight into this study. This is not a viable, statistically valid thing.”
His critique is specific and worth taking seriously. MIT’s 95% figure tracks GenAI pilots on a narrow, 6-month P&L-only definition of success. That definition excludes efficiency gains, cost reductions, customer churn improvements, and sales pipeline velocity. Roetzer’s argument is that an organization that deploys a GenAI tool and reduces its customer support ticket resolution time by 40% would count as a “failure” under NANDA’s methodology, because that improvement did not show up as a measurable P&L impact within six months.
“Anytime you see a headline like that, you have to immediately step back and say, okay, that seems unrealistic.”
Paul Roetzer, Founder and CEO, Marketing AI Institute, speaking on The Artificial Intelligence Show, Episode 164 (August 2025)
He also notes a potential framing consideration: NANDA’s research mission is building an “Internet of AI Agents,” meaning the report’s implicit argument is that today’s static GenAI tools fail while adaptive agentic systems succeed. That is not a reason to dismiss the report, but it is a reason to hold the 95% figure as directional rather than precise.
Our read: Roetzer’s methodological critique is valid. The 95% figure almost certainly overstates the failure rate under a broader definition of value. But it probably understates the failure rate under a strict enterprise-ROI definition, because organizations are generally terrible at measuring AI value even when it exists. The honest answer is that somewhere between 60% and 95% of enterprise AI initiatives are producing less value than their sponsors expected, which is damning enough without needing to settle on a single number.
What Happens Next: The 18-Month Outlook
Gartner’s “Trough of Disillusionment” framing for GenAI in 2026 fits the historical Hype Cycle pattern and is a reasonable, falsifiable prediction. After peak hype comes a period where the gap between expectation and delivered value becomes impossible to ignore, investment gets more selective, and the organizations that built real infrastructure during the hype phase begin pulling away from those that didn’t.
Three things are worth watching over the next 12 to 18 months.
Agentic AI cancellation rates will become the new headline metric. Gartner predicts more than 40% of agentic AI projects will be canceled by end of 2027. Given that agentic AI is currently in an earlier hype phase than GenAI was in 2024, the cancellation rate could be higher. Watch for enterprise announcements of agentic AI programs in Q3 2026, and note whether they include defined success metrics and timelines.
The winners will start becoming identifiable by name. The BCG “future-built” 5% is currently an anonymous cohort. As the field matures, the firms that built the right infrastructure and redesigned workflows rather than layering AI on top of broken processes will start producing public case studies with real numbers. Those case studies, when they arrive, will be more valuable than any survey data.
CFO scrutiny will reshape how pilots get approved. IBM found that only 25% of AI initiatives delivered expected ROI. That number is entering boardroom conversations. Finance leaders who previously approved AI spend on the basis of competitive parity (“our competitors are doing this”) are beginning to demand pre-defined success metrics and ROI timelines before sign-off. That shift, if it continues, will produce fewer pilots and better ones.
Three Actions for Technology Leaders Right Now
1. Audit your data infrastructure before approving any new AI spend. Gartner’s data consistently shows that data readiness, not model selection, is the primary predictor of AI success.
2. Define success in business terms, with a timeline and an owner, before a pilot launches. “Measurable reduction in customer support costs by Q3” is a success metric. “Explore AI capabilities” is not.
3. Consider stopping two current pilots before starting one new one. The evidence suggests that focus produces better outcomes than portfolio diversification when it comes to enterprise AI.
FAQ: Enterprise AI Failure Rates
Why do most enterprise AI projects fail?
Independent research from MIT, RAND, McKinsey, and S&P Global converges on organizational causes rather than technical ones: poor data readiness, unclear success metrics, weak workflow integration, and treating AI deployment as a technology rollout instead of a change-management initiative. The models mostly work. The organizations often don’t.
What percentage of AI projects fail in 2026?
Estimates vary by study and definition. MIT found 95% of GenAI pilots show no measurable P&L impact. McKinsey found only 39% of organizations report any enterprise-wide EBIT impact. S&P Global found 42% of companies abandoned most AI initiatives in 2025. No single authoritative percentage exists across all AI project types, but the consistent finding is that fewer than 10% of organizations capture most of the value.
Is the MIT 95% AI failure statistic accurate?
The MIT NANDA report is real, published in July 2025, based on 300-plus initiative reviews and 52 organizational interviews. The 95% figure reflects a strict 6-month P&L-only definition of success. Marketing AI Institute’s Paul Roetzer has publicly challenged the methodology for excluding efficiency and productivity gains. The figure is directionally useful but should not be treated as a precise universal failure rate.
How much are companies investing in AI in 2026?
Stanford HAI’s AI Index 2025 tracked $252.3 billion in corporate AI investment in 2024, with private investment rising 44.5% year-over-year. Gartner forecasts worldwide AI spending will reach $2.52 trillion in 2026. GenAI-specific pilot investment was estimated at $30 to $40 billion in 2025 per MIT NANDA’s own baseline.
What do successful enterprise AI programs have in common?
BCG’s analysis of 1,250-plus global firms found that the 5% achieving AI value at scale share three traits: they identify one specific business pain point rather than launching broad pilot portfolios, they redesign workflows around AI rather than layering AI onto existing processes, and they fix data infrastructure before deployment rather than after. The differentiator is organizational discipline, not model selection.
The enterprise AI ROI crisis is not a story about artificial intelligence failing. It is a story about organizations failing to create the conditions under which AI can succeed. The technology works. The problem is that most enterprises are deploying it into environments it cannot fix: fragmented data, undefined success metrics, siloed workflows, and approval processes driven by competitive anxiety rather than business logic.
The 5% that are winning are not using better models. They built better foundations first.
Over the next 18 months, as Gartner’s predicted “Trough of Disillusionment” plays out and CFO scrutiny tightens, the gap between that leading cohort and the field will widen. The organizations that survive the trough will be the ones that treated their first round of AI failures as diagnostic information rather than sunk costs.
The Neural Loop delivers the enterprise AI research that actually matters, without the vendor spin. One email, twice a week.
Subscribe to The Neural Loop
Model Drift 2026: Why Your ML Model Is Already Wrong
Enterprise AI · MLOps
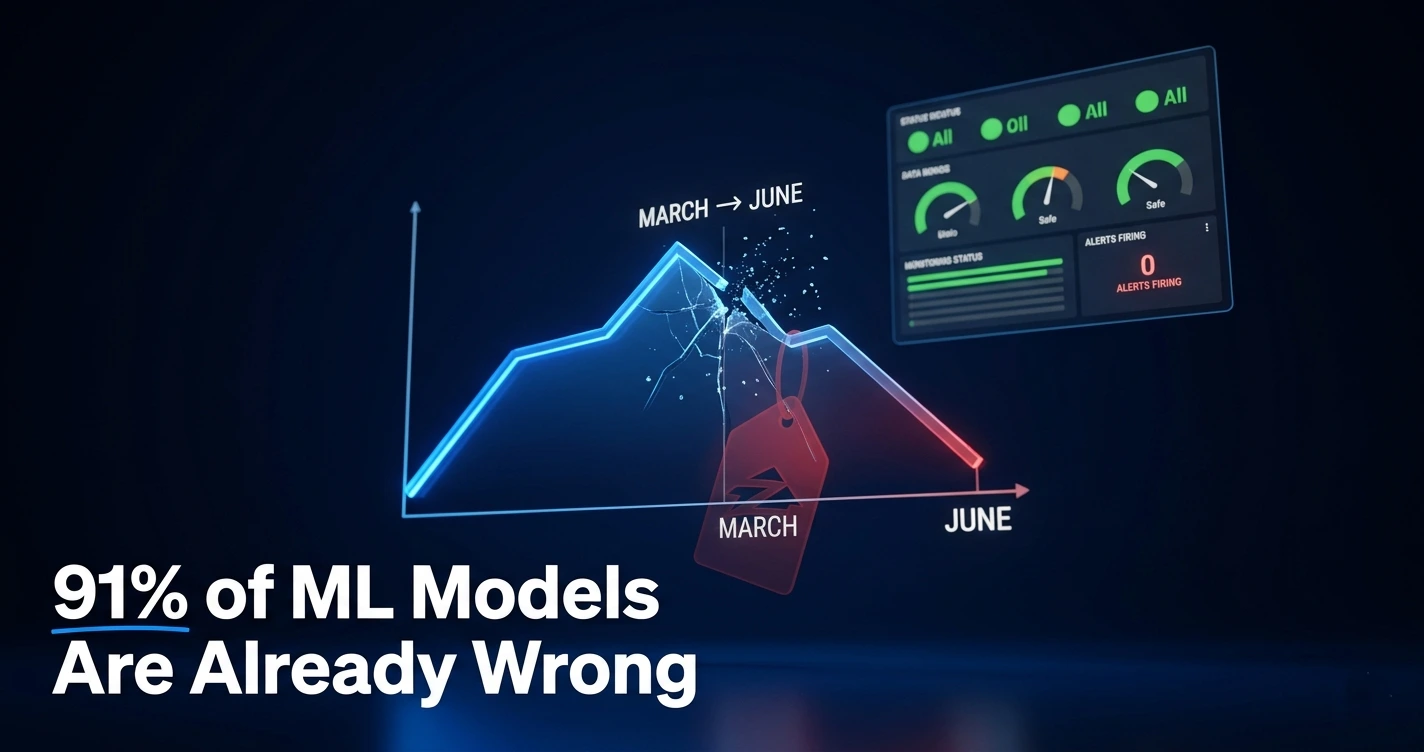
The ML Model That Worked in March Is Lying to You in June
Model drift doesn’t trigger an alarm. It just quietly costs you money until someone finally checks the math.
Somewhere in your stack right now, a model is making decisions based on a version of the world that no longer exists. It approved a loan, flagged a transaction, priced a policy, or answered a customer using assumptions baked in months ago. Nobody got an error. Nothing crashed. The model is still running exactly as designed. That’s the problem.
This is model drift: the slow, undramatic decay of a machine learning model’s accuracy as the real world stops matching the data it was trained on. It’s not a bug, and patching it isn’t a one-time fix. It’s a structural feature of every statistical model ever deployed, and in 2026, with AI agents and hosted large language models stacked into nearly every workflow, it’s getting harder to see and more expensive to ignore.
Practitioners generally sort model drift into three buckets, and the distinction matters more than most teams treat it. Get this wrong and your monitoring dashboard will glow green while your model quietly gets worse.
Drift type
What’s actually happening
How you catch it
Data drift (covariate shift)
The statistical pattern of incoming inputs changes, but the rule mapping input to output still holds
Population Stability Index, Kolmogorov-Smirnov test
Concept drift
The relationship between input and output itself changes. The same input now warrants a different answer
Performance tracking on labeled slices, much harder to spot
Prediction drift
The model’s output distribution shifts, often a leading signal that something upstream is breaking
Output distribution monitoring
Concept drift is the one that does the most damage, because input data can look perfectly stable while the underlying logic connecting cause and effect has already broken. That’s the gap our analysis of Zillow’s $500 million iBuying collapse walks through in detail: the inputs looked fine right up until the model’s pricing logic was catastrophically wrong.
The number nobody wants to admit: 91%
Researchers from MIT, Harvard, Cambridge, and the University of Monterrey ran the closest thing the field has to a definitive test. They evaluated 128 model-dataset combinations spanning healthcare, transportation, finance, and weather forecasting, every one of them starting from strong, cross-validated performance. Published in Nature Scientific Reports, the result was blunt: temporal degradation showed up in 91% of cases.
That figure isn’t a vendor survey designed to sell monitoring software. It’s peer-reviewed, and it means drift isn’t an edge case you might encounter. It’s closer to a tax every production model eventually pays.
It also tends to arrive faster than teams expect. Industry research cited by MoldStud puts the figure at 67% of organizations running AI at scale reporting at least one critical, drift-related issue that went unnoticed for over a month. And a separate 2024 survey from Evidently AI found that 32% of production scoring pipelines experience real distributional shifts within their first six months of going live. Drift isn’t a year-three problem. It often starts before the champagne from launch day is gone.
The freshest data point on this: Gartner predicted on May 12, 2026, that 40% of organizations deploying AI will adopt dedicated AI observability tools by 2028. Flip that number around and it says something sharper: as of today, roughly 60% of enterprises running AI in production have no dedicated way to catch drift at all.
The new villain: your model provider changed it on you
Drift used to be a problem you created yourself, by training on data that aged out. In 2026, most enterprise teams don’t train their own models anymore. They build on top of API providers like OpenAI, Anthropic, and Google, and those providers ship updates to hosted models without asking anyone’s permission first.
That means the model your application was tested against in March may not be the same model answering customer requests in June, even though you changed nothing on your end. Research from FutureAGI, published May 14, 2026, identifies this as a distinct and growing category: silent upstream drift, a failure mode existing monitoring stacks largely aren’t built to catch, because they’re watching your data, not your provider’s weights.
Picture a support agent built on a hosted model. In March, its tone, accuracy, and refusal behavior all check out fine. By June, the provider has pushed an update behind the scenes. Nothing in the company’s own pipeline changed, yet outputs shift, and the company only finds out when customer satisfaction scores drop. If you want to see how this risk compounds across multi-agent systems, our piece on AI agent sprawl and the shadow AI problem covers what happens when drift in one component cascades through an entire agent stack.
The fix isn’t complicated, just neglected: pin your model version instead of pointing at “latest,” and run a canary against a held-out evaluation set whenever the provider ships something new.
What drift actually costs
The clearest dollar figure on record comes from a January 2026 paper on arXiv (2601.08928) evaluating drift detection across more than 30,000 retail demand series from the M5 dataset. The baseline forecast held a 0.048 WMAPE error rate, costing about $10.2 million a year in inventory carrying costs. Left undetected, drift pushed that error to 0.192 WMAPE, an increase of $4.1 million annually. The detection system that caught it cost $9,600 a year to run. That’s a 417x return, and it caught the drift within 4.2 days, 97.8% of the time.
Zoom out and the picture gets less reassuring. A Gartner survey of 782 infrastructure and operations leaders, published April 7, 2026, found that only 28% of AI use cases fully meet their ROI expectations, while 20% fail outright. Drift isn’t the only reason AI projects stall, but it’s a recurring, quantifiable piece of why the promised return doesn’t show up.
“What we can’t solve is what the model is going to tell us about how much capital we need to raise, deploy, and risk.”
Rich Barton, Co-Founder & CEO, Zillow Group, via GeekWire
Barton said that explaining why Zillow shut down its Offers home-buying program in November 2021, after a $304 million Q3 write-down and total program losses that outside estimates place between $500 million and $880 million. The company laid off roughly a quarter of its workforce in the process. It remains the most visible case of a model’s drift turning directly into a balance sheet problem, and you can read the full breakdown in our earlier analysis of the Zillow collapse.
How to actually catch it
Detection methodology is where the field has actually matured. Statistical tests give you a number, but the number only matters with the right threshold and the right cadence attached to it.
Method
What it flags
Practical threshold
Population Stability Index (PSI)
Shift in input feature distribution
Above 0.25 typically warrants action
Kolmogorov-Smirnov (KS) test
Statistical divergence between two distributions
Significant, but check against business impact first
Eval-score tracking
Direct performance drop on labeled or held-out data
Alert on drift plus eval drop together, not drift alone
Output distribution monitoring
Changes in what the model is predicting, a leading indicator
Useful for catching upstream LLM provider changes
Evidently AI, an open-source monitoring library with more than 25 million downloads, has become something close to the default starting point for teams building this out.
“We use Evidently to continuously monitor our business-critical ML models at all stages of the lifecycle. It’s become invaluable for flagging drift and data quality issues directly from our CI/CD pipelines.”
Customer testimonial featured by Evidently AI, whose tooling is built and maintained under CTO Emeli Dral, instructor for the MLOps Zoomcamp monitoring module
Cadence matters as much as the test you choose. High-velocity systems like fraud scoring and ad ranking need checks every 5 to 15 minutes. Batch models can check at run time. Most enterprises still retrain on a fixed quarterly or biannual schedule, a cadence that research from Arize AI suggests underperforms proactive, trigger-based retraining by roughly 4.2x on prediction stability.
Is drift even the real villain?
Here’s where the consensus narrative gets a useful challenge. A Statsig analysis of the Zillow collapse makes an argument worth sitting with: Opendoor ran a comparable iBuying algorithm in the same overheated housing market and posted a $170 million profit that same quarter. Same conditions, same basic algorithmic approach, wildly different outcomes. If the model itself was the problem, both companies should have failed the same way.
The more uncomfortable read is that drift didn’t sink Zillow on its own. The company’s governance process around model uncertainty did. A model that flags rising uncertainty is only useful if someone with the authority to slow down actually listens to it. “Your model is lying to you” might be less accurate than “your organization has no mechanism for hearing your model admit it’s unsure.”
There’s a second, more technical complication. A 2025 paper accepted at ACM SIGKDD, the field’s top data mining conference, found that the standard fix for concept drift, retraining on recent data, can introduce its own version of the problem. Because ground-truth outcomes arrive after the forecast window closes, there’s “a temporal gap between the training samples and the test sample,” and the researchers found this gap itself can cause forecast models to adapt to outdated concepts, even while they’re being retrained specifically to fix drift.
Worth asking before you greenlight a monitoring budget: is your detection threshold calibrated to business impact, or just statistical significance? A supply chain monitoring study found that KS tests can flag feature shifts that never actually connect to a performance change. Tune your alerts too tight and you get a different failure mode entirely, alert fatigue, where a team that’s been burned by false positives starts ignoring the real signal when it finally shows up.
What to do Monday morning
Pin your model versions. Stop pointing production traffic at “latest” for any hosted LLM. Run a canary against a held-out eval set before accepting a provider update.
Set thresholds by business impact, not just statistics. A PSI of 0.3 on one feature might be noise. On another, it’s a five-alarm fire. Know the difference before you wire up alerts.
Match monitoring cadence to traffic velocity. Fraud and ad ranking systems need checks every 5 to 15 minutes. Slower-moving batch models don’t.
Alert on drift plus performance drop together. Drift without measurable eval impact is a false alarm that burns your on-call rotation for nothing.
Build a path from alert to action. Zillow’s failure suggests the weak link often isn’t detection. It’s what happens, organizationally, once the alert fires. If your monitoring talent is already stretched thin, that’s worth examining alongside our look at the enterprise AI skills gap CTOs are now contending with.
None of this requires a massive budget. The DriftGuard research found a monitoring system costing under $10,000 a year preventing millions in losses. The gap between companies that catch drift early and companies that find out from a customer complaint usually isn’t money. It’s whether anyone built the pipe in the first place, a gap our earlier reporting on why most enterprise AI roadmaps stall traces back to the same root cause.
Frequently asked questions
What is model drift in machine learning?
Model drift is the gradual decline in a deployed model’s predictive accuracy as real-world data diverges from the data it was trained on. It happens silently, with no error message, and shows up as either data drift, where input patterns shift, or concept drift, where the relationship between inputs and outputs itself changes.
How do you detect model drift?
Teams compare live production data against the original training baseline using statistical tests. The Population Stability Index, where readings above 0.25 signal real concern, and the Kolmogorov-Smirnov test are the two most common methods. Platforms like Evidently AI, Arize AI, and Amazon SageMaker Model Monitor automate the comparison and fire alerts when thresholds are crossed.
What is the difference between data drift and concept drift?
Data drift means the statistical pattern of incoming inputs changes while the underlying rule connecting inputs to outputs still holds. Concept drift means that rule itself breaks: the same input now deserves a different answer. Concept drift is more dangerous because the input data can look perfectly normal while accuracy quietly collapses.
How often should you retrain a machine learning model?
It depends on how fast your environment moves. Fraud detection and ad ranking systems should be checked every 5 to 15 minutes, with retraining triggered only when drift is confirmed and performance has actually dropped. Batch models can be checked at run time. Most companies still retrain on a fixed quarterly schedule, which research shows is too slow for high-velocity systems.
What causes model drift?
The usual culprits are shifting user behavior, macroeconomic shocks, upstream data pipeline changes, evolving fraud or attack patterns, training-serving skew between lab data and real-world inputs, and, increasingly in 2026, silent updates pushed by the company hosting your large language model.
What percentage of ML models experience drift in production?
A peer-reviewed study from researchers at MIT, Harvard, Cambridge, and the University of Monterrey tested 128 model-dataset combinations across healthcare, transportation, finance, and weather, and found measurable temporal degradation in 91% of them. A separate 2024 industry survey found that 32% of production scoring pipelines drift within their first six months alone.
What tools are used to monitor model drift?
The most widely adopted options in 2026 are Evidently AI, an open-source library with more than 25 million downloads, Arize AI, Fiddler AI, Amazon SageMaker Model Monitor, Microsoft Azure ML Monitor, WhyLabs, and DataRobot MLOps. Teams running large language models are increasingly adding LangSmith and dedicated LLMOps platforms to catch output-level drift.
Is Zillow’s failure an example of model drift?
Yes, with a caveat. Zillow’s Zestimate model, trained on stable historical housing data, failed to adjust as the post-pandemic market cooled, a textbook case of concept drift. But Opendoor ran a comparable algorithm in the same conditions and turned a profit that quarter, which suggests Zillow’s failure to act on model uncertainty mattered as much as the drift itself.
The bottom line
Model drift was never the kind of failure that announces itself. That’s the entire point of the seasonal metaphor: nothing about your model changes the day it starts being wrong. The data underneath it changes first, quietly, and the model just keeps confidently answering questions using a version of reality that expired weeks ago.
What’s different about 2026 isn’t the existence of drift. It’s the speed and the new sources. Hosted LLM providers shipping silent updates, agent stacks where drift in one component cascades into five others, and a Gartner prediction confirming that most organizations still have no dedicated way to see any of it coming. The 91% figure from Nature isn’t a warning anymore. It’s closer to a baseline assumption.
Over the next 6 to 18 months, expect three things to accelerate: AI observability spending climbing toward Gartner’s projected 40% adoption rate, regulatory frameworks in the EU and US increasingly treating documented drift monitoring as a compliance requirement rather than a best practice, and a harder conversation inside companies about whether detection tools matter if nobody acts on what they flag.
Watch your model version pins. Watch your alert thresholds for business relevance, not just statistical significance. And watch what happens, organizationally, the next time a drift alert actually fires.
Stay ahead of the next model failure
Get the data, the case studies, and the contrarian takes other AI newsletters skip, straight from The Neural Loop.
Subscribe to The Neural Loop
RAG vs Fine-Tuning: The $340K Mistake Enterprise Teams Keep Making (2026)
Enterprise AI Architecture · Decision Intelligence
RAG vs Fine-Tuning: The $340K Mistake Enterprise Teams Keep Making in 2026
By NeuralWired Research Desk | June 18, 2026 | 12 min read
A VP of Engineering at a 3,000-person financial services firm told his board they needed to “fine-tune their own LLM” to build a compliant document assistant. Eighteen months and $340,000 later, the model was live. Two quarters after that, regulatory updates had made 30% of its training data stale, and the retraining bill landed at $40,000 every six weeks. Meanwhile, a competing firm shipped a Retrieval-Augmented Generation pipeline in 11 days for under $4,000. Their documents update in real time. Their auditors love the source citations. Their engineers are building the next feature.
This is not a story about technology. It’s a story about the most consequential architectural choice enterprise AI teams make in 2026, and how most of them get it wrong from the start.
The data is stark. Enterprise fine-tuning costs between $50,000 and $500,000 upfront. RAG starts at $500 per month. Fine-tuning takes 2 to 6 months to reach production. RAG deploys in 1 to 2 weeks. And yet over 80% of enterprise AI teams that should be using RAG still default to fine-tuning, driven by a belief that more training means smarter AI. The belief is wrong. Here’s the evidence, the decision framework, and the counterpoints you need before you commit a dollar.
What Is Retrieval-Augmented Generation?
Retrieval-Augmented Generation, or RAG, is an AI architecture pattern that keeps the base language model completely unchanged. Instead of retraining the model with new knowledge, RAG retrieves relevant information from an external data source at the moment a user asks a question, injects that information into the model’s context window, and lets the model reason over what it just retrieved.
RAG was introduced by Meta AI researchers in a 2020 paper titled “Retrieval-Augmented Generation for Knowledge-Intensive Tasks.” The core insight was architectural: instead of baking knowledge into model weights (expensive, slow, and static), retrieve it at runtime from a living knowledge base (fast, cheap, and always current).
In practice, this means your company’s policy documents, product specifications, support tickets, and legal filings sit in a vector database. When an employee asks a question, the system retrieves the most relevant document chunks and feeds them to the LLM alongside the question. The model reads those chunks and answers. When the policy changes, you update the document. The model’s answer updates instantly, with no retraining, no downtime, and no GPU bill.
Key properties that matter for enterprise decisions: data updates are real-time, every answer is traceable to a source document, and the system can be deployed by engineering teams without ML expertise.
What Is Fine-Tuning?
Fine-tuning further trains a pre-trained language model on a curated, domain-specific dataset. Unlike RAG, which retrieves knowledge at runtime, fine-tuning bakes knowledge directly into the model’s parameters. The result is a new model version with specialized capabilities, but one that is frozen at the moment training ends.
Three primary techniques exist on the cost and performance spectrum. Full fine-tuning adjusts every parameter in the model, producing the highest quality results but requiring massive GPU resources. LoRA (Low-Rank Adaptation) trains small adapter layers instead of the full model, cutting compute costs dramatically. QLoRA goes further by using 4-bit quantization, reducing GPU memory requirements by roughly 75% compared to full fine-tuning.
As IBM’s AI research team frames it: fine-tuning “optimizes deep learning models for domain-specific tasks” while RAG “augments a natural language processing model by connecting it to an organization’s proprietary database.” These are different solutions to different problems. The failure happens when teams use fine-tuning to solve a problem that is, at its core, about knowledge access rather than model behavior.
The Single Rule That Decides Everything
“RAG changes what the AI knows. Fine-tuning changes how the AI behaves.”
Buildup Works LLC analysis, March 2026
This one sentence eliminates more bad architecture decisions than any technical framework. Read it twice, then apply it to your use case.
If your problem is “the model doesn’t know our products, policies, or procedures,” that’s a knowledge problem. RAG solves knowledge problems. If your problem is “the model doesn’t respond in the right format, tone, or reasoning style,” that’s a behavior problem. Fine-tuning solves behavior problems.
The uncomfortable reality is that 80% or more of enterprise AI use cases are knowledge problems dressed up as behavior problems. Teams assume the model “doesn’t understand” their domain, when the actual issue is that the model has never seen their internal data. RAG gives the model access to that data. Fine-tuning is the wrong tool entirely.
AI engineer Pratik Chaudhari, writing from production deployment experience, puts it directly:
“RAG and fine-tuning are not competitors. They operate at different layers of the system. Fine-tuning teaches the model how to think. RAG provides what it should think with. Production systems need both.”
Pratik Chaudhari, AI Engineer, Medium, December 2025
The Full Cost Breakdown
The headline numbers are attention-grabbing for a reason: they reflect what enterprise teams actually spend, not just what they budget for at the start of a project.
Cost Factor
RAG
Fine-Tuning
Initial setup cost
$500 – $5,000
$50,000 – $500,000+
GPU compute (7B model, LoRA)
N/A
$300 – $800 per run
GPU compute (40B+ model, full FT)
N/A
$35,000+ per run
GPT-4o API fine-tuning (50K examples)
N/A
~$640 per training run
Ongoing operational cost
$500 – $5,000/month
$5,000 – $50,000/quarter (retraining)
Data preparation effort
Low (index and embed existing docs)
High (60–70% of total project effort)
Data drift response
Instant re-embedding
Full retraining cycle
Typical budget overrun
Moderate (scaling OpEx)
2–5x initial projection
The $300-$800 GPU compute figure for a 7B parameter LoRA fine-tune is technically accurate and deeply misleading. It covers only raw GPU time. It does not cover the data preparation that consumes 60-70% of total project effort. It does not cover ML engineer salaries, MLOps infrastructure, evaluation cycles, or the quarterly retraining that kicks in once your data starts drifting three months after deployment.
Analysis of real enterprise fine-tuning postmortems by Xenoss.io found that without deliberate optimization, budgets exceed initial projections by 2 to 5x systematically. This is not negligence. It’s the structural underestimation of dataset curation, which is almost always scoped out of early project estimates.
A 2024 peer-reviewed analysis found that chips and staff together constitute 70-80% of total LLM deployment costs. The implication for CFOs is clear: the GPU invoice is the smallest line item on a fine-tuning project.
The CapEx vs. OpEx Reality
AI strategy consultant Sanwal, founder of OptimizeWithSanwal and author of “The Advanced RAG Playbook,” frames this as a classic financial decision: fine-tuning is capital expenditure with a massive upfront cost and a fixed asset that depreciates as data drifts. RAG is operational expenditure, scaling with usage and data volume. For stable, high-volume use cases, fine-tuning’s CapEx can actually amortize to a lower per-query cost over time. The decision is financial as much as technical.
Timeline Reality: Weeks vs. Months
For CTOs under board pressure to demonstrate AI progress, the deployment timeline differential is often the deciding factor before cost even enters the conversation.
RAG systems deploy in 1 to 2 weeks. The architecture is mature, the tooling (LangChain, LlamaIndex, managed vector databases) is accessible to engineering teams without ML expertise, and the infrastructure is cloud-native. A team that didn’t exist three years ago can ship a production RAG system in under 10 days.
Enterprise fine-tuning takes 2 to 6 months from project kickoff to production deployment. The 6-week headline in this article’s title represents a mid-size project at a team that already has the infrastructure and expertise. Large-scale enterprise fine-tuning on 40B+ parameter models, with proper data curation, evaluation, safety testing, and MLOps deployment, routinely exceeds 6 months.
The timeline gap is structural, not a matter of team skill. Dataset preparation at enterprise scale involves cleaning, deduplication, annotation, format standardization, and quality validation across potentially millions of documents. You cannot compress this without degrading the fine-tuned model’s quality. And if data quality is the bottleneck, you’re spending 60-70% of your project time on a problem that RAG would never require you to solve at all.
The Retraining Trap
A fine-tuned model is a static artifact. Enterprise data is not. New products ship, regulations change, policies update. The model you fine-tuned in Q1 is partially stale by Q3. Retraining cycles cost $5,000 to $50,000 per quarter and take 4 to 6 weeks each time. The $100,000 fine-tuning project becomes a $200,000+ annual commitment. NeuralWired’s recent analysis of Zillow’s $500M model drift failure shows exactly where static models in dynamic environments end up.
When Fine-Tuning Actually Wins
This article would be dishonest if it presented RAG as the universal answer. Fine-tuning has legitimate, significant advantages for specific use cases, and enterprise teams that dismiss it entirely will underperform in those scenarios.
Latency-Sensitive, High-Volume Applications
Fine-tuned models produce shorter prompts. RAG appends retrieved chunks to every query, increasing token count and time-to-first-token. For real-time chatbots or applications processing millions of queries per day, this overhead compounds. A fine-tuned model that eliminates a 500-token system prompt saves approximately $0.15 per 1,000 requests at 2026 token pricing. At 10 million daily queries, that’s real money.
Deep Behavioral Specialization
Legal, medical, and financial AI applications with highly specific output requirements (structured reports, jurisdiction-specific formats, clinical documentation standards) benefit from fine-tuning in ways RAG cannot replicate through retrieval alone. When you need the model to consistently reason and format in a specific way across every interaction, you’re shaping behavior, and behavior is fine-tuning’s domain.
Stable-Knowledge, High-Volume Structured Tasks
If your knowledge base doesn’t change (a fixed taxonomy, a stable product catalog from 5 years ago, a medical coding reference), fine-tuning can deliver that knowledge at inference time without retrieval overhead, source attribution complexity, or vector database costs. The CapEx amortizes favorably at scale.
Academic evidence from the 2024 Meta Knowledge Discovery and Data Mining (KDD) Cup competition reinforces this nuance:
“RAG alone is not enough to alleviate hallucination in the benchmark and fine-tuning is needed to achieve higher accuracy. Our results show that the hybrid approach using both RAG and fine-tuning performs best.”
Team Future (2024 Meta KDD Cup winners), arXiv:2410.09699
The nuance is important: the winning team didn’t choose one or the other. They used both.
The 5-Question Decision Framework
Apply these five questions to your use case before committing architecture. The answers point to RAG, fine-tuning, or the hybrid approach that the evidence increasingly supports as optimal.
1Is this a knowledge problem or a behavior problem? Does the model need to access information it doesn’t have? RAG Does it need to respond, reason, or format differently? Fine-Tune
2Does your data change weekly or daily? If yes, fine-tuning will be perpetually stale. Real-time data refresh is physically impossible with model retraining cycles. RAG Required
3Do you need sub-200ms latency at massive query volume? The retrieved context overhead in RAG adds latency that compounds at scale. Shorter prompts from fine-tuning win here. Fine-Tune Advantage
4Are you in a regulated industry requiring source attribution? RAG cites the specific document chunk it retrieved. Fine-tuned models cannot tell you where they learned something. Compliance often mandates RAG. RAG Required
5Is this a pilot that needs to prove value in 30 days? Fine-tuning cannot reach production in 30 days at enterprise scale. RAG can. If demonstrating AI ROI quickly is on your agenda, the timeline question decides everything else. RAG
Critical Counterpoints: RAG Fails Too
The “RAG is cheap and easy” narrative is as dangerous as the “fine-tuning is proper AI” myth. RAG has specific, well-documented failure modes that are destroying enterprise implementations at scale right now.
Gartner’s 80% Failure Projection
Gartner projected in 2024 (reported via Atlan’s April 2026 analysis) that 80% of enterprise RAG implementations will fail by 2026, with poor data quality as the primary cause. Supporting evidence from the same analysis: 40% of RAG production failures trace specifically to data quality issues, not to the model or retrieval algorithm. RAG does not transform bad data into good answers. It surfaces bad data faster, at higher confidence, with citations.
Note on This Statistic
The 80% figure is cited secondhand through Atlan. NeuralWired has not verified it against the primary Gartner report. Editorial teams should treat it as “reported by Gartner” rather than independently verified. The directional claim (RAG implementations failing due to data quality) is corroborated across multiple independent sources.
The Zero-Shot Query Gap
A Pinecone Nexus longitudinal study of 12 enterprise RAG deployments (released May 2026) found that 31% of real user queries in enterprise settings fell outside the distribution of the embedding model’s training data. In zero-shot RAG configurations, this caused a 40% increase in retrieval failures. The implication: enterprise users type terse strings, error codes, acronyms, and voice-to-text transcriptions. General-purpose embedding models don’t handle these well. RAG built on a generic embedding model without query rewriting or hybrid search (vector plus keyword) will fail on nearly a third of real-world queries.
The Catastrophic Forgetting Risk in Fine-Tuning
Fine-tuning carries its own technical failure mode that teams rarely acknowledge upfront. Academic research (arXiv:2408.00798) documents “catastrophic forgetting”: when you fine-tune a model on new domain data, it can degrade on tasks it previously performed well. An enterprise legal model fine-tuned for contract review may become worse at general reasoning. You gain domain accuracy in one area and lose general capability in others. RAG does not have this problem because the base model is never modified.
The “RAG-and-Done” Failure Pattern
The most common enterprise RAG failure has nothing to do with technology. Teams index ungoverned, unclassified document repositories into a vector database. Stale documents, contradictory policy versions, and irrelevant files all enter the retrieval index. The LLM retrieves the wrong document, answers confidently, and cites a three-year-old policy that was superseded. User trust collapses in weeks. The root cause is not RAG. It’s the belief that RAG is a plug-and-play solution requiring no data governance investment.
McKinsey’s 2025 State of AI survey found that 78% of organizations use AI in some form, but only 31% report meaningful ROI, with data quality cited as the top gap. The data problem predates RAG. RAG just makes it more visible, more immediately.
Our read: the Gartner failure projection is doing important work here. It’s not an indictment of RAG as a technology. It’s a warning that RAG without data governance is not a $4,000 solution. It’s a $4,000 implementation sitting on a $200,000 data governance problem that nobody budgeted for.
The Hybrid Architecture That Beats Both
The enterprise AI teams outperforming their peers are not choosing between RAG and fine-tuning. They’re using both in defined, non-overlapping roles.
The pattern that has emerged from production deployments and academic benchmarks is consistent: fine-tune the model for behavioral alignment, then use RAG for knowledge retrieval at inference time. Fine-tuning handles tone, format, output structure, and reasoning style. RAG handles what the model knows about your specific domain, your current data, and your proprietary information.
A peer-reviewed comparison study (arXiv:2401.08406) found that hybrid fine-tune plus RAG configurations reduced hallucinations by up to 11 percentage points compared to either approach alone. The 2024 Meta KDD Cup winning team confirmed the same finding across a comprehensive benchmark. Well-tuned enterprise RAG systems achieve 85-90% answer accuracy. Naive RAG implementations achieve 10-40%. The difference between those numbers is implementation quality, not technology choice.
The hybrid architecture is not “do both and see what happens.” It requires clear architectural delineation: explicit rules about which queries route to retrieved context versus which rely on model behavior, monitoring systems that attribute failures to the correct layer, and infrastructure that separates the RAG pipeline from the model serving layer so each can be updated independently.
The T-RAG paper from arXiv documents a production deployment that combines a fine-tuned base model with tree-structured RAG retrieval, finding that “hybrid approaches combining RAG and fine-tuning are likely to be promising for real-world applications.” This is not a theoretical recommendation. It’s an observation from teams running these systems at scale.
For enterprise teams asking where to start: RAG first. Ship a RAG pipeline, establish your data governance foundation, measure accuracy against your specific use case, and identify the behavioral gaps that retrieval alone doesn’t close. Those gaps are your fine-tuning roadmap. The teams that start with fine-tuning have no reliable way to know whether the problem was knowledge or behavior, because they’ve built a system that conflates both.