Your warehouse GM just asked for budget to add forty robots next quarter, and the pitch deck on your screen cites Amazon’s fleet size to make the case. Here’s the problem: the number in that deck is probably wrong, the safety statistic backing it up is almost certainly fabricated, and the market-size figure someone pulled from a random report could be off by a factor of six.
If you’re evaluating industrial robotics ROI for 2026 budget planning, the Amazon numbers everyone quotes at you are stale, cherry-picked, or invented. This piece rebuilds the case study from primary sources, including the parts of Amazon’s own record that don’t flatter it, so you can build a business case that survives a skeptical CFO instead of collapsing under one follow-up question.
The Real Number: 1 Million Robots, Not 750,000
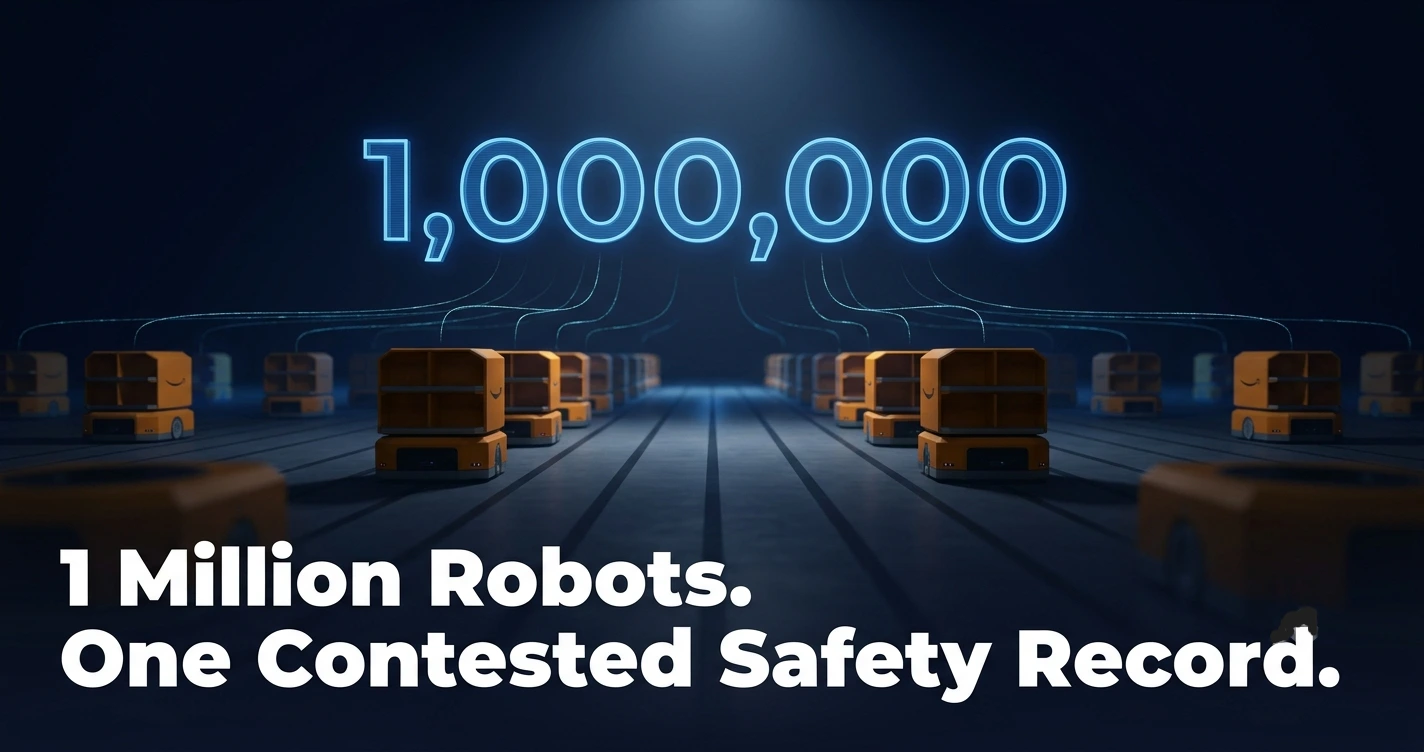
Start with the stat everyone gets wrong. Amazon’s robotics program traces back to the 2012 acquisition of Kiva Systems, and for the last two years, “750,000 robots” has been the go-to headline figure in nearly every trade article. That number is dead. Amazon confirmed in July 2025 that its millionth robot had shipped, to a fulfillment center in Japan, across a network of more than 300 facilities worldwide.
The milestone wasn’t just a bigger headcount. Amazon paired it with the launch of DeepFleet, a generative AI model built to coordinate robot movement across the entire fleet rather than site by site. The company’s mobile fleet now includes named systems most operators outside e-commerce have never heard of: Hercules (moves up to 1,250 lbs of inventory), Pegasus (conveyor handling), Proteus (the first fully autonomous mobile robot cleared to navigate around employees), Cardinal and Sparrow (arm-based sorting), and Vulcan, a touch-sensitive manipulation robot Amazon announced in May 2025.
Reporting since then, including CEO Andy Jassy’s Q1 2026 remarks covered by WWD and Sourcing Journal, puts the fleet meaningfully above 1 million. Leaked internal documents reported by the New York Times in October 2025 describe an internal target to automate 75% of fulfillment operations and replicate Amazon’s Shreveport, Louisiana facility, its automation template, across roughly 40 sites by the end of 2027. That target has not been confirmed by Amazon itself. Treat it as reported, not guidance.
Why this matters for your business case: if you cite 750,000 robots in a 2026 planning document, you’re using a number Amazon’s own newsroom superseded a year ago. Anyone fact-checking your deck against Amazon’s public record will catch it in ten seconds, and it undermines the credibility of everything else in the deck.
The Safety Story Amazon Doesn’t Want You Repeating (Because It’s Complicated)
Somewhere in the automation-sales ecosystem, a claim started circulating that robots cut Amazon’s picker injury rate by 20%. We ran this against Amazon’s own disclosures, OSHA-sourced third-party analyses, and labor-advocacy research. No source, including Amazon’s most favorable self-reporting, supports that figure. It appears to be invented, and it should be retired immediately from anyone’s ROI deck.
What Amazon actually reports, per its 2025 Safety Report published in March 2026, is a 43% improvement in its musculoskeletal disorder rate over six years and a 14% year-over-year gain, alongside a 70% six-year improvement in lost-time incident rate and $2.5 billion invested in workplace safety since 2019. Those are real, sourceable numbers. They’re also self-reported and not independently audited, which matters for what comes next.
A December 2024 Senate HELP Committee investigation found Amazon warehouses recorded 31% more injuries than the industry average in 2023. A May 2025 Strategic Organizing Center analysis of OSHA data put Amazon’s serious injury rate at 5.9 per 100 workers, against 3.0 at competitor warehouses, roughly double. The National Employment Law Project, in a report covered by The Nation, found Amazon accounts for 79% of employment but 86% of injuries among large US warehouses (1,000-plus employees).
NELP researcher Irene Tung has argued that Amazon’s self-reported injury figures likely understate the real incident rate, because the reporting standard only reliably captures injuries serious enough to cause missed work or a job transfer, missing a large share of everyday strain and repetitive-motion harm.
Irene Tung, Researcher, National Employment Law Project, via The Nation
Amazon disputes the comparison, arguing that competitors like Walmart, Target, and Costco log injuries under different OSHA classification codes, which artificially deflates the “industry average” it’s being measured against. Labor advocates counter that Amazon makes up 79% of the employee base in the very warehouse-size bracket used for that comparison, which makes the benchmark somewhat self-referential either way.
Here’s the part that should actually worry anyone pitching robots as a safety upgrade: historically, more robots at Amazon has not clearly meant fewer injuries. Reporting from Reveal, the Center for Investigative Reporting, found injury rates were specifically worse at Amazon’s more heavily robotic facilities as the fleet scaled from 15,000 units in 2014 to 200,000 in 2019, a period when the serious-injury rate rose 33%. The assumption that automation straightforwardly protects workers doesn’t hold up against Amazon’s own history.
Our read: this is a stronger story than the fake 20% stat ever was. “The safety case is contested, and here’s exactly how” is more credible to a skeptical operations audience than a clean number nobody can verify. It’s also a warning: if you’re leaning on “safety” as a justification for a robotics investment, expect the same scrutiny Amazon is getting.
What “The Industrial Robotics Market” Actually Costs
Ask six research firms how big the industrial robotics market will be in 2026 and you’ll get six answers that don’t agree with each other by a wide margin.
Research Firm
2026 Market Size
Projected CAGR
MarketsandMarkets
$15.50B
5.0% to 2032
Business Research Insights
$18.35B
6.2% to 2035
SkyQuest
$21.27B (2025)
13.2% to 2033
IntelMarketResearch
$25.66B
10.7% to 2034
Mordor Intelligence
$54.28B
11.7% to 2031
Future Market Insights
$65.10B
18.1% to 2036
Research and Markets
$89.57B
11.34% to 2032
That’s roughly a six-fold spread on the same question, asked the same year. Mordor Intelligence’s own methodology notes explain why: some firms count only robotic arm hardware, others count entire integrated systems; some price at the factory gate, others at street price; currency conversion timing alone can shift a figure by billions.
The one number in this space that’s methodologically transparent and not trying to sell you a subscription is the International Federation of Robotics’ World Robotics 2025 report. IFR counted 4,664,000 industrial robots in operational use worldwide in 2024, a 9% year-over-year increase, with annual installations of roughly 542,000 units, the second-highest total on record. That’s primary survey data collected directly from manufacturers and national robotics associations across roughly 40 countries, not a modeled forecast.
Outgoing IFR president Takayuki Ito characterized 2024 as the second-highest installation year in the organization’s history, just 2% below the 2022 record, a measured framing rather than a promotional one from the industry’s own trade body.
Takayuki Ito, President, International Federation of Robotics, IFR World Robotics 2025 release
Worth noting for anyone benchmarking against global competition: China’s operational robot stock passed 2 million units in 2024, the largest of any country, accounting for 54% of that year’s global deployments. US installations, meanwhile, rose 11% year-over-year to 38,000 units in 2025 per IFR’s preliminary data, published June 2026. Global installation growth has plateaued near record highs for four straight years even as US adoption accelerates, which means American buyers are now competing for the same integrator capacity and equipment lead times as everyone else scaling up at once.
How to use this in your own board deck: never cite a single market-size figure without naming the firm and the scope. “By one estimate, from Research and Markets, the market could reach $89.57B” reads as rigorous. “The market is worth $89.57B” reads as something an AI search summary will flag against a competing number the moment someone checks.
The ROI Framework That Actually Survives Contact With a P&L
None of the numbers above tell you whether robotics will pay off in your facility. That answer depends almost entirely on one variable most vendors skip: whether your existing process is worth automating in the first place.
Automation World’s February 2026 analysis, citing McKinsey research projecting 10%-plus annual growth in warehouse automation spend through 2030, found that ROI shows up reliably in one narrow category: high-volume, repetitive picking and palletizing tasks, and even there, only when volume, SKU mix, and labor economics line up. Throughput gains of 30 to 40% are achievable, but they’re the ceiling for a specific use case, not a baseline you should expect everywhere.
Is that a disappointing headline number compared to the marketing? Probably. It’s also the honest one, and it points to the single most actionable insight in this entire space: WMS, OMS, and ERP integration quality determines whether robotics amplifies an efficient operation or accelerates a broken one. A facility with messy inventory data and inconsistent SKU handling doesn’t get fixed by adding robots. It gets the same problems, faster and at a higher fixed cost.
A practical sequencing checklist before you sign a robotics contract
Audit process maturity first. If your WMS data is unreliable today, robots will not correct it. They’ll operate on it.
Model against your actual SKU mix and volume, not an industry-average case study from a vendor deck.
Price in integrator lead time. With US installations up 11% year-over-year, integrator capacity is tightening, and that shows up as schedule risk, not just cost risk.
Separate the safety pitch from the productivity pitch. Treat any safety-based ROI claim, yours or a vendor’s, with the same scrutiny applied to Amazon’s above.
Budget for the process-fix work as a line item, not an afterthought. It’s frequently the actual bottleneck.
The Case Against Following Amazon’s Playbook Blindly
Amazon’s scale is not a template most enterprises can copy, and pretending otherwise is where a lot of robotics budgets go to die.
Amazon’s warehouse headcount has grown from roughly 125,000 workers in 2012 to more than 1.5 million today, even as automation scales, though a Wall Street Journal analysis found the average number of human workers per facility (about 670) is now at a 16-year low. Amazon has the balance sheet to absorb integration failures, run parallel automated and manual workflows during transitions, and continue acquiring robotics companies (RIVR for outdoor delivery robots, Fauna Robotics for humanoid systems, both reported by PYMNTS in March 2026) while it works out the kinks.
Mid-market operators generally don’t have that cushion. If you don’t have in-house robotics engineering capacity or the margin to absorb a botched rollout, you’re more exposed to exactly the failure mode Automation World describes: automating a broken process and discovering the problem was never throughput, it was data quality.
Timeline reality check: Amazon’s internal target, 75% of fulfillment automated and roughly 40 Shreveport-style facilities by end of 2027, comes from leaked documents reported by the New York Times, not from an official Amazon roadmap. Build your own planning timeline off confirmed public statements, not leaked internal ambition. The gap between the two is usually where budget overruns live.
Frequently Asked Questions
How many robots does Amazon have in 2026?
Amazon passed 1 million operational robots in mid-2025, up from the 750,000 figure widely cited in 2023 and 2024, spread across more than 300 fulfillment centers worldwide. Reporting since then indicates the fleet has grown meaningfully beyond that milestone.
Did Amazon’s robots reduce warehouse injuries?
Amazon reports a 43% six-year improvement in its musculoskeletal disorder rate, but independent OSHA-data analyses from the Strategic Organizing Center and the National Employment Law Project find Amazon’s overall injury rate remains roughly double that of comparable competitor warehouses.
What’s a realistic ROI payback period for warehouse robots?
Payback varies widely by use case. Industry reporting points to strong ROI mainly in high-volume, repetitive picking and palletizing tasks, with 30 to 40% throughput gains achievable only when volume, SKU mix, and labor economics genuinely align.
How big is the industrial robotics market?
Estimates range from roughly $15.5 billion to $89.6 billion for 2026 depending on the research firm’s methodology and scope. The IFR’s installed-base count, 4.66 million robots operating globally as of 2024, is the most methodologically transparent primary figure available.
What This Means Going Forward
The headline robot count was never the interesting part of this story. The interesting part is that Amazon, the company with the most resources on earth to solve robotics integration cleanly, still has a contested safety record and an unconfirmed internal automation timeline. If Amazon’s own case study is this complicated, treat any vendor’s clean 12-month-payback promise with proportional skepticism.
Over the next 6 to 18 months, watch three things: whether Amazon’s leaked 2027 automation target gets officially confirmed or quietly walked back, whether IFR’s mid-2026 preliminary US installation data (already up 11% year-over-year) holds through a full annual report, and whether independent OSHA-data analyses of Amazon’s newest robotic facilities start closing the gap with its self-reported safety numbers or widening it.
For now, the actionable takeaway for anyone building a 2026 automation budget is simple: fix the process before you automate it, name your sources when you cite market size, and never let a vendor’s safety pitch go unchecked against independent data.
IBM Owns Terraform Now: Inside Pulumi’s 2026 HCL MoveCloud Infrastructure
IBM Owns Terraform Now. So Pulumi Learned Its Language.
A quiet feature launch in January 2026 tells you more about where infrastructure as code is heading than any market share number floating around Google right now.
If you searched “terraform vs pulumi market share 2026” and landed here expecting a clean percentage, you’ve found the same wall we hit. A number like “Terraform owns 72% of the market” is repeated across dozens of sites this year. It’s also attributed to the CNCF’s 2024 survey, which, when you actually open the PDF, contains no IaC market share question at all. It covers Kubernetes, GitOps, and service mesh, not Terraform versus Pulumi versus OpenTofu. That statistic doesn’t exist. It’s a content farm number that got copied enough times to look true.
Here’s what does exist, and it’s a better story anyway: in January 2026, Pulumi started shipping native support for HashiCorp Configuration Language, the actual syntax Terraform users write in. It also began hosting Terraform and OpenTofu state files directly inside Pulumi Cloud, a direct shot at HashiCorp’s own hosted product. That’s not a rumor. That’s a company built on the opposite philosophy from Terraform (write infrastructure in Python or TypeScript, not a config language) deciding the config language was worth absorbing anyway.
Why this matters if you manage infrastructure: You no longer face an all or nothing rewrite to leave Terraform. Pulumi’s bridge means you can keep existing Terraform or OpenTofu state under new governance while migrating components on your own schedule. That changes the calculus for any team stuck deciding what to do about HashiCorp’s licensing shift.
The Real Story: Why Pulumi Started Speaking HCL
Pulumi’s founder and CEO, Joe Duffy, didn’t dress up the reasoning. Asked why a multi-language platform would add support for the one language it was built to avoid, he pointed to demand from Terraform users looking for an exit ramp after HashiCorp’s 2023 licensing change.
“That time has come for HCL.”
Joe Duffy, Founder and CEO, Pulumi, via InfoQ, January 17, 2026
In a separate interview a few weeks later, Duffy went further, saying the Terraform relicense had noticeably pushed existing Terraform users to look at Pulumi (The New Stack, February 2026). Take that with the appropriate grain of salt. He’s the CEO selling the migration story. But the product decision itself, shipping a language Pulumi spent seven years arguing against, is hard evidence regardless of who’s narrating it.
That decision doesn’t happen in a vacuum. It happens because of what came before it.
The Three Shocks That Actually Reshaped IaC
Strip away the SEO noise and this isn’t really a two horse race between Terraform and Pulumi. It’s a three way story, and OpenTofu is the part most “Terraform vs Pulumi” articles conveniently skip.
Event
Date
What actually happened
Terraform relicensed to BSL
August 2023
HashiCorp moved Terraform off the open source MPL 2.0 license onto the Business Source License, restricting competitors from reselling managed Terraform products.
OpenTofu forks Terraform
September 2023
Founded under the Linux Foundation by Spacelift, env0, Harness, Scalr, and others, days after the BSL announcement.
HashiCorp vs OpenTofu dispute
April 2024
A cease and desist alleging code theft was publicly rebutted line by line. Linux Foundation’s Jim Zemlin backed OpenTofu; InfoWorld’s Matt Asay reversed his initial position after reviewing the rebuttal.
IBM acquires HashiCorp
February 27, 2025
A confirmed $6.4 billion deal, per IBM’s own newsroom. Terraform now sits inside IBM’s automation portfolio next to Vault, Consul, and Nomad.
OpenTofu joins CNCF
April 2025
Accepted at the Sandbox tier, giving it vendor neutral governance credibility a single company fork rarely earns this fast.
Pulumi adds native HCL support
January 2026
Announced in private beta, targeting general availability in Q1 2026. Confirm current GA status before assuming it’s fully live.
Notice what’s missing from most coverage: the CLOUD Act and data jurisdiction angle. If your organization stores Terraform state inside HCP Terraform, that platform now sits under IBM, a U.S. company. For teams with GDPR obligations or data residency requirements, that’s worth a conversation with legal, even if it’s not the deciding factor.
The Numbers You Can Actually Check Yourself
Forget the disputed percentages. The most defensible signal in this whole debate is public, live, and anyone can verify it in thirty seconds on GitHub.
Tool
GitHub stars
Trend
Terraform
~48,749
Still the largest, unsurprising given its head start
OpenTofu
~29,000
Roughly doubled from ~22,400 in under two years
Pulumi
~25,378
Now trailing OpenTofu, despite Pulumi being nearly six years older
That last row is the one nobody’s writing about. OpenTofu launched in September 2023. Pulumi launched in 2017. And OpenTofu has already pulled ahead of it on developer mindshare by star count. If you wanted one sentence to summarize where developer attention is actually going, that’s it, and it’s not the sentence most headlines are using.
Two infrastructure orchestration vendors back this up with real usage data, not surveys. Spacelift reports that roughly half its platform deployments now run OpenTofu instead of Terraform. Scalr reports OpenTofu at around 63% of runs and 72% of newly created workspaces, up from about 56% of new workspaces earlier in 2026. That second number matters more than the first: new workspace share reflects fresh decisions being made today, not legacy projects nobody’s touched since 2022.
On the provider ecosystem, the gap that used to favor Terraform by three to one has narrowed sharply. OpenTofu’s registry now lists more than 3,900 providers and 23,600 modules against Terraform’s roughly 4,800 providers, closer to a 20% gap than the old blowout. Pulumi’s native registry is smaller at around 1,800 packages, but its “Any Terraform Provider” bridge lets it generate a typed SDK from essentially any Terraform or OpenTofu provider, which closes that distance more than the raw numbers suggest.
What The People Building These Tools Are Actually Saying
Matt Gowie, founder of the IaC consulting firm Masterpoint and a former Terraform contributor, told TechTarget that starting in January 2026 he began actively steering client work toward OpenTofu over licensing objections. By his account, all but one of roughly eight client engagements that year ended up on OpenTofu.
Sebastian Stadil, CEO of Scalr and an OpenTofu core member, put the licensing contrast bluntly when OpenTofu shipped native state encryption, a feature the open Terraform CLI still lacks. Worth remembering he runs a company that competes directly with HashiCorp’s commercial products, so weigh the framing accordingly.
The Case Against The “Pulumi Is Winning” Narrative
Not everyone buys the displacement story, and the skeptical case deserves real airtime rather than a token paragraph at the bottom.
“I have not seen any of the predicted tsunami of large businesses dumping HashiCorp Terraform for OpenTofu.”
Andi Mann, Global CTO and Founder, Sageable, via TechTarget
Mann’s read, that adoption is real but concentrated in smaller, open source first shops rather than sweeping the enterprise, lines up with a fact most “Terraform is dying” articles leave out: HashiCorp’s last public quarter before the IBM acquisition closed showed revenue up 15% year over year and customer count up 10% among accounts spending six figures. That’s not a company in freefall.
Our read: the loudest part of this story, GitHub stars and vendor platform data, tells you where developer enthusiasm and new project decisions are trending. It does not yet tell you that large regulated enterprises are ripping out production Terraform at scale. Those are two different claims, and a lot of 2026 coverage blurs them into one.
There’s also a small base problem worth flagging directly for anyone quoting a “45% growth” style figure for Pulumi or OpenTofu. A percentage jump looks dramatic against a small starting number. Pulumi’s last verified customer count sits around 2,000 (a 2023 figure, likely stale by now), against HashiCorp’s roughly 4,700 paying customers reported in 2024. Growth rate and absolute scale are not the same story, and reporting on this topic tends to conflate them.
One more open thread: the HashiCorp and OpenTofu legal dispute over alleged code copying was never resolved in public record. It went quiet after OpenTofu’s rebuttal, but “no further communication” isn’t the same as “resolved.” Any team betting heavily on OpenTofu’s long term legal footing should know that history exists.
Quick Answers
Is Terraform still open source?
No, not in the traditional sense. HashiCorp moved Terraform from the open source MPL 2.0 license to the Business Source License 1.1 in August 2023. You can still view, run, and self-host it for free, but competitors can’t resell managed Terraform products without a commercial license.
What’s the actual difference between Terraform and Pulumi?
Terraform uses HCL, a declarative configuration language built specifically for infrastructure. Pulumi lets you write infrastructure in Python, TypeScript, Go, C#, or Java, giving you real loops, functions, and IDE tooling that HCL doesn’t offer.
Is OpenTofu a safe replacement for Terraform?
For most teams, yes. It’s a Linux Foundation governed fork of Terraform 1.6, fully open source under MPL 2.0, and largely drop-in compatible. Most migrations just swap the terraform binary for tofu with no code changes required.
Who owns Terraform now?
IBM. The acquisition closed February 27, 2025, for $6.4 billion. Terraform now sits inside IBM’s automation software lineup alongside Vault, Consul, and Nomad.
Can Pulumi actually use Terraform providers?
Yes. Pulumi’s bridging mechanism lets it use existing Terraform and OpenTofu providers directly, generating a typed Pulumi SDK from any provider already in either registry.
Where This Goes Next
What you now know that most search results won’t tell you straight: the “market share” framing dominating this topic is mostly unverifiable noise traced back to a survey that never asked the question. The real signal is quieter. OpenTofu is pulling developer attention away from both Terraform and Pulumi. Pulumi is responding by absorbing the one thing that used to separate it from Terraform entirely. And IBM’s ownership has turned a licensing dispute into a jurisdiction and governance question that has nothing to do with syntax.
Three things worth watching over the next six to eighteen months: whether Pulumi’s HCL support reaches full general availability and actually moves enterprise workloads, whether HashiCorp’s new capped free tier (effective March 31, 2026) pushes more teams toward OpenTofu, and whether a named enterprise like Fidelity’s reported OpenTofu migration gets an official confirmation rather than staying a secondhand claim.
If you’re deciding what to do with your own Terraform footprint right now, don’t anchor on a percentage you can’t trace back to a source. Anchor on what your team can actually observe: your provider coverage, your state hosting requirements, and how much of your organization’s new work is already quietly running on tofu instead of terraform.
Subscribe to The Neural Loop for the next update on this story, including GA confirmation on Pulumi’s HCL support and fresh registry numbers as they land.
Synthetic Data at Scale: Inside NVIDIA’s 340B Model | NeuralWired
Enterprise AI / Data Strategy
Synthetic Data at Scale: Inside NVIDIA’s 340B Model
Writer trained a frontier-class model for $700,000. A comparable OpenAI model reportedly cost $4.6 million. The difference wasn’t a smarter team. It was synthetic data, and it’s about to change how every enterprise AI budget gets built.
If you’re building a domain-specific model this year, synthetic data is no longer the experimental option. It’s the default line item. NVIDIA has spent well over $320 million buying into it. Microsoft trained part of Phi-4 on 400 billion synthetic tokens. And enterprise buyers evaluating vendors like Mostly AI, Tonic.ai, and Hazy need a clear answer to one question: does this actually work, or does it just get you to a worse model faster?
The honest answer, after digging through the peer-reviewed research, the regulatory filings, and the vendor claims: both. Synthetic data is solving a real, measurable problem. It’s also creating a new one that most vendor pitch decks conveniently skip.
Why synthetic data exists now
Every frontier lab is running into the same wall. Epoch AI estimates there’s roughly 300 trillion tokens of high-quality public text on the entire internet. GPT-4-class models already consume 6 to 13 trillion tokens per training run. Do that math a few more times and the public web runs dry, not in some distant future, but on a timeline that matters for product roadmaps being written right now.
At the same time, real data got more expensive to use, not just to collect. GDPR, the EU AI Act’s phased rollout through 2026 and 2027, HIPAA, and CCPA all raise the cost and legal exposure of training on real customer or patient records. Synthetic data promised a way around both problems at once: manufacture the training signal instead of mining it, and skip the privacy landmine while you’re at it.
That promise isn’t new, either. Statistician Donald Rubin proposed generating synthetic records to protect the confidentiality of census microdata back in 1993. What changed is generative modeling. GANs, then diffusion models, then LLMs, made it possible to produce synthetic text, images, and tabular data realistic enough to actually train on, at a scale that simply didn’t exist five years ago.
NVIDIA’s 340B bet
The clearest signal that synthetic data moved from side project to platform strategy came from NVIDIA. In June 2024, the company released Nemotron-4 340B, an open, commercially licensed model family built specifically to generate synthetic training data for other LLMs. It’s not a small side experiment. Nemotron-4 340B was pretrained on 9 trillion tokens, and over 98% of the data used in its own alignment process was synthetically generated, according to NVIDIA’s technical report.
Then, in March 2025, NVIDIA acquired Gretel, a synthetic-data startup with roughly 80 employees and about $67 million in prior VC funding. The deal was reported at more than $320 million, exceeding Gretel’s last valuation, according to Wired and corroborated by TechCrunch, SiliconANGLE, and Benzinga. Terms weren’t fully disclosed, but the size of the number tells you how NVIDIA is thinking. This isn’t a compliance tool bolted onto the GPU business. It’s infrastructure.
The real cost math
Here’s the number that should actually change how your team plans a training budget. Writer, an enterprise generative AI company, trained its Palmyra X 004 model almost entirely on synthetic data for a reported $700,000. A comparably sized OpenAI model was estimated at around $4.6 million, according to TechCrunch’s reporting in December 2024.
That’s not a rounding error. That’s the difference between a project a mid-size company can actually greenlight and one that only a frontier lab can afford. If you’re building domain-specific LLMs rather than chasing frontier-lab scale, that cost gap is the opportunity, but only where your team has real curation and filtering discipline. Cheap synthetic data without quality control just gets you to a bad model faster and cheaper, which isn’t actually a win.
Synthetic data models let teams rapidly build on human intuition about what data a model actually needs. But raw synthetic data can’t be trusted to avoid forgetful, homogenous outputs unless it’s carefully filtered and paired with fresh real data.
Luca Soldaini, Senior Research Scientist, Allen Institute for AI (AI2), via TechCrunch
The model collapse problem
Here’s the part the optimistic vendor pitch skips. In 2024, a team led by Ilia Shumailov published a peer-reviewed study in Nature establishing what’s now called model collapse: when generative models are trained recursively on their own or other models’ synthetic outputs, generation after generation, the original data distribution’s tails erode. Rare events and minority patterns disappear first. Outputs drift toward a narrower, more generic mean.
This isn’t theoretical anymore. A February 2026 Communications of the ACM piece documented model collapse showing up in production systems already: background-removal tools failing on specific hair textures, image generators producing increasingly homogeneous outputs. These are shipped products, not lab experiments.
The nuance that matters for your roadmap
The Shumailov findings aren’t the final word. A 2025 rebuttal paper (arXiv 2503.03150) argues catastrophic collapse is avoidable under realistic conditions, specifically when synthetic data supplements real data across generations rather than fully replacing it. The honest state of the science: collapse is real under some conditions, avoidable under others. Anyone telling you it’s settled in either direction is oversimplifying.
Synthetic data’s value lies in its statistical similarity to real data. Recent advances in generative modeling are what made large-scale, realistic synthetic data generation newly possible at a fidelity that simply didn’t exist before.
Kalyan Veeramachaneni, Principal Research Scientist, MIT LIDS; co-founder, DataCebo, via MIT News
There’s also a sharper version of this critique worth sitting with. Fraud detection is one of the most-cited synthetic-data success stories, but real fraud represents under 0.1% of transactions. That means synthetic fraud generation is filling in for genuinely rare edge cases that are inherently hard to validate against ground truth. It’s not simply “more of the same data, cheaper.” It’s manufacturing your own answer key for the exact patterns you have the least real evidence about.
AI companies may be aware of unresolved problems with synthetic data and model collapse, but they have strong financial incentive to downplay these risks so as not to spook investors during the AI boom.
Jathan Sadowski, researcher on AI political economy, via LGT
What regulators are already doing
The biggest live risk for regulated-industry teams isn’t technical. It’s the assumption that synthetic equals automatically exempt from privacy law. It doesn’t.
EDPB Opinion 28/2024: The European Data Protection Board laid out a three-step legality test for whether synthetic data actually qualifies as anonymous under GDPR. The real data used to generate it still needs a lawful basis.
NIST SP 800-226: Sets guidance on differential privacy claims, directly relevant to any vendor promising synthetic data is inherently private.
UK FCA Synthetic Data Expert Group: Actively mapping governance expectations onto existing model-risk policy for financial services.
If your compliance team’s current stance is “it’s synthetic, so it’s fine,” that stance is already out of date.
How big is this, really
Ask five research firms how big the synthetic data market is, and you’ll get five different answers for the exact same year. That spread matters, because a lot of vendor sales decks lean on the biggest number available.
Firm
2026 Estimate
2030s Projection
CAGR
Precedence Research
$791.3M
$6.9B by 2034
31.1%
Mordor Intelligence
$710M
$3.67B by 2031
38.96%
Grand View Research
N/A (2023 baseline: $218.4M)
$1.79B by 2030
35.3%
The gap exists because there’s no standardized definition of what counts as “the synthetic data market.” Some estimates count only dedicated vendors. Others fold in hyperscaler tooling revenue. Treat any single “the market will be worth $X billion” headline with a healthy dose of skepticism unless it names its methodology.
Gartner’s frequently cited projection that 75% of businesses will use generative AI to create synthetic customer data by 2026 is also worth flagging clearly: it’s an analyst prediction, not a measured outcome. Decisions should be based on your own pilot data quality, not market-growth headlines.
What enterprise teams should do now
If you’re a CTO or data engineering lead evaluating this space, the practical split is between two very different use cases:
Synthetic data for privacy-safe testing and data sharing. Mature, well-understood, low risk. This is the use case that’s actually been battle-tested for years.
Synthetic data as a primary model training source. Higher risk, actively debated, and prone to collapse if used recursively without real-data anchoring. This is where the Writer cost-savings story lives, and also where the CACM production failures live.
Our read: the teams getting real value right now are the ones treating synthetic data as a supplement to real data, not a replacement for it, and the ones running their compliance check before their procurement check, not after.
Frequently Asked Questions
What is synthetic data in AI?
Synthetic data is artificial information generated by algorithms or AI models rather than collected from real-world events. It’s built to mimic the statistical properties of real data without exposing personal or sensitive records, and it’s used for AI training, testing, and privacy-safe data sharing.
Is synthetic data as good as real data?
It depends on the use case. Synthetic data can match real-data performance for well-understood patterns like fraud simulation or tabular records, but it degrades model quality through model collapse when used recursively across generations without real-data anchoring.
Does synthetic data solve AI privacy problems?
Only partially. The European Data Protection Board has clarified that synthetic data doesn’t automatically qualify as anonymous under GDPR. A legality test still applies, and the original real data used to generate it still needs a lawful basis.
How big is the synthetic data market?
Estimates vary by research firm, ranging from roughly $600 million to $900 million in 2026 depending on methodology, with projected growth to $3.7 billion to $6.9 billion by the early 2030s at 31 to 39 percent CAGR.
What is model collapse in AI?
Model collapse is the progressive degradation of an AI model’s outputs when it’s trained recursively on AI-generated data instead of real-world data. It causes loss of rare patterns and increasingly generic, homogeneous results over successive generations.
Where this goes next
What’s clear now that wasn’t clear a year ago: synthetic data isn’t a shortcut around the data wall, it’s a different tool with its own failure mode. NVIDIA’s infrastructure bet, Writer’s cost numbers, and the CACM production failures are all real, all documented, and all pointing in different directions at once.
Three things worth watching over the next 6 to 18 months: whether the 2025 rebuttal to Shumailov’s collapse findings holds up under further scrutiny, whether the EDPB’s GDPR test becomes the template other regulators copy, and whether the market-size estimates start converging as vendors standardize what actually counts as “synthetic data” revenue. Regulatory scrutiny of AI training data isn’t slowing down either. Our recent coverage of the ChatGPT Canada privacy ruling shows what happens when real-data training practices collide with privacy law. Synthetic data is one proposed way around that collision, though regulators are already scrutinizing it too.
Want the next installment of this story before it hits the feed? Subscribe to The Neural Loop at neuralwired.com/newsletter.
Data Observability in 2026: Why 53% of Data Leaders Already Use It
Data & AI Infrastructure
Data Observability Hit 53% Adoption. Most Teams Still Find Out From a Customer.
By NeuralWired Staff · Published July 3, 2026 · 9 min read
A pipeline breaks at 2am. Nobody’s watching. By the time the CEO opens their dashboard at 9am, it’s empty, and the first question in the Slack thread is always the same: how long has this been broken? For a growing share of data teams, that question now has an uncomfortable answer, because Gartner’s first dedicated Market Guide for data observability, published in February 2026, shows the category isn’t emerging anymore. It’s already mainstream, and the teams still without it are now the outliers, not the innovators.
Data observability is the practice of monitoring the health and behavior of data as it moves through pipelines, covering freshness, volume, schema, distribution, and lineage. It doesn’t just tell you a job failed. It tells you why, and whether the failure quietly poisoned everything downstream.
Gartner’s Market Guide draws a line that a lot of buyers still blur: data quality asks whether the data itself is accurate. Data observability asks whether the system delivering that data is healthy. Confuse the two, and you end up buying a data quality tool to fix a pipeline reliability problem, or vice versa. That confusion, Gartner notes, is a real source of wasted budget across enterprise data teams.
The five pillars. Freshness, volume, schema, distribution, and lineage. Nearly every platform in this category, from Monte Carlo to Bigeye to Soda.io, is built around detecting and explaining failures across these five dimensions.
Why Gartner’s Report Matters Right Now
Gartner doesn’t publish a Market Guide for a category until enterprise budget has already moved. That’s the real story buried in the February 23, 2026 report from analysts Melody Chien, Michael Simone, Jason Medd, and Lydia Ferguson: this is confirmation, not prediction.
The headline number is stark. Data and analytics leaders who’ve already implemented data observability tooling sit at 53%, with most of the remainder planning to within 18 months, according to Gartner’s 2025 State of AI-Ready Data Survey. If you’re a data platform lead who’s been putting this off as a nice-to-have, the market already decided otherwise.
Gartner’s own market-sizing puts 2024 data observability revenue at roughly $346.4 million, up 20.8% year over year. That figure is worth anchoring on specifically because it comes from Gartner’s own analysis, unlike the wildly divergent third-party market forecasts floating around (more on that below).
The AI Agent Pivot Changing the Category
Here’s what changed in the last four months, and it’s the real reason this topic is worth your attention today rather than a year ago. Monte Carlo, the company credited with coining “data observability” when CEO Barr Moses founded it in 2019, has repositioned itself around AI agents. It shipped new Agent Observability capabilities on March 12, 2026, and announced a Databricks Agent Bricks integration on June 2, 2026, at Snowflake Summit.
The shift isn’t cosmetic. It reflects a genuine change in what “is my data healthy” means once an autonomous agent, not a human analyst, is the one acting on it.
“If you’re deploying agents without production-grade observability, you’re flying blind.”
Barr Moses, CEO and Co-founder, Monte Carlo · Business Wire, March 12, 2026
Worth noting: Moses runs the company that created this category, so her framing of urgency comes with an obvious commercial interest. That doesn’t make the underlying data wrong. Monte Carlo’s own survey of 260 respondents at companies with 1,000-plus employees, fielded in April 2026, found that 64% of organizations deployed AI agents before feeling fully prepared. Among software developers and engineers specifically, that number climbs to 75%.
The scarier number sits underneath that one. Nearly a third of organizations say they couldn’t disable or roll back a harmful AI agent within minutes, and 14% say they couldn’t do it at all. That’s not a data quality problem. That’s an incident response problem, and it’s the reason security and compliance teams are increasingly showing up in what used to be a purely data-engineering conversation, particularly with the EU AI Act’s audit trail requirements for high-risk systems now in play.
Gartner’s own AI observability research backs the direction of travel. Senior Principal Analyst Pankaj Prasad, writing about explainable AI and LLM observability investment:
“As enterprises scale GenAI, the trust requirement grows faster than the technology itself.”
Pankaj Prasad, Senior Principal Analyst, Gartner · Gartner Newsroom, March 30, 2026
The Tool Sprawl Problem Nobody’s Solved
Adoption is up. Confidence isn’t following at the same pace, and the reason is tool sprawl.
A Cloud Native Computing Foundation survey found 72% of respondents run up to nine different observability tools, with over a fifth running 10 to 15. Half named tool sprawl as their single biggest observability challenge, full stop, not a secondary complaint. Separately, Omdia research cited by groundcover CEO Shahar Azulay puts the figure at 69% of organizations running six or more observability tools.
New Relic’s 2025 Observability Forecast adds the most uncomfortable data point in this entire brief: even after two years of consolidation effort that cut tool count by 27%, organizations still average 4.4 observability tools, and 41% of leaders still learn about service interruptions from customer complaints or manual checks rather than their own monitoring stack. That’s the real-world version of the empty 9am dashboard, and it’s happening at nearly half of surveyed enterprises despite the tooling being in place.
Market size: pick your number carefully
Ask five research firms how big the data observability market is and you’ll get five different answers, spanning nearly 3x for the same year. That’s not sloppiness, it’s scope. Some include general APM tooling, some are data-specific, some cover enterprise deployments only.
Source
2026 Estimate
Scope Note
Gartner (2024 actual)
$346.4M (+20.8% YoY)
Data observability specifically; most defensible single figure
Research and Markets
$3.4B
Broader market definition
market.us
~$2.6B (trend est.)
Global, projecting to $7.01B by 2033
Future Market Insights
$1.63B
Enterprise software only, narrower scope
businessresearchinsights.com
$4.35B
Broader “observability tool market,” not data-specific
If you only take one number away, take Gartner’s $346.4 million. It’s the only one built from Gartner’s own market-share analysis rather than a syndicated forecast model.
The Case Against Buying Your Way Out
Not everyone in this space thinks more spending is the answer. groundcover CEO Shahar Azulay, whose company competes in this exact market, argues the economics of observability itself are broken, not just under-adopted.
“Tool sprawl is one of the clearest signals that observability economics are broken.”
Shahar Azulay, Co-founder and CEO, groundcover · Techzine, February 18, 2026
His sharper point is technical: traditional sampling, the trick most platforms use to keep observability costs down by only recording a fraction of traces, breaks down for AI agent workloads. Agent behavior is non-deterministic. A small input change can cascade into a completely different execution path, and if you’re only sampling a slice of traces, you may simply never see the path that mattered. Reduced sampling doesn’t just reduce visibility here, it changes what teams are structurally capable of knowing.
Put Azulay’s incentive next to Moses’s and you get a genuine industry disagreement rather than manufactured balance: one CEO says buy production-grade observability now, the other says the current economics of doing so don’t actually work for agentic workloads. Both are worth hearing. Neither is neutral.
Our read: the procurement numbers (53% adoption, most of the rest planning within 18 months) and the operational-maturity numbers (41% still learning about outages from customers, tool sprawl cited by half of teams as their top challenge) are measuring two different things. Buying the tool and solving the reliability problem are running on very different timelines, and most coverage of this space conflates them.
What This Means For Your Team
If you’re a data engineering lead or a CDO evaluating this right now, the decision has quietly changed shape. It used to be “should we buy observability.” Gartner’s numbers suggest that question is largely answered. The real decision is consolidation strategy: buying another disconnected dashboard makes tool sprawl worse, not better.
Two numbers should anchor your planning conversation this quarter: 64% of organizations shipped AI agents before feeling prepared, and nearly a third couldn’t roll back a harmful agent within minutes. If your organization is running or piloting agentic workflows, this is no longer a data-team-only decision. Loop in security and compliance before the pilot, not after the incident.
For teams further along on data platform maturity, the related question of self-healing infrastructure and unified telemetry is worth a deeper look in our AIOps self-healing infrastructure guide. And if you want the sharper cautionary version of what happens when this goes wrong in production, we broke down the pattern in why AI agent deployments fail and again in our 2026 production fix guide. Teams still in the planning phase should start with the data readiness audit in our enterprise AI implementation roadmap, since data observability is only useful if the underlying data governance is already sound.
Frequently Asked Questions
What is data observability?
Data observability is the practice of monitoring the health, reliability, and behavior of data as it moves through pipelines, covering freshness, volume, schema, distribution, and lineage. Unlike simple monitoring, it explains why something broke, not just that it broke.
What is the difference between data observability and data monitoring?
Monitoring tells you something is broken, similar to a fire alarm going off. Observability tells you why it broke and helps prevent it from happening again, closer to a full root-cause investigation after the alarm sounds.
What is data observability vs. data quality?
Data quality asks whether the data itself is accurate, complete, and consistent. Data observability asks whether the system delivering that data is healthy and behaving as expected, and if not, why. Gartner treats these as complementary disciplines, not interchangeable ones.
Do I need data observability for AI agents?
Increasingly, yes. Monte Carlo’s 2026 survey found 73% of enterprises won’t deploy an AI agent without monitoring and alerting in place, yet 63% still cite lack of observability as a top barrier to broader AI deployment.
What are the five pillars of data observability?
Freshness, volume, schema, distribution, and lineage. These five dimensions form the baseline framework most data observability platforms use to detect and explain pipeline failures.
How much does data downtime cost a company?
Reliable, data-observability-specific figures are hard to pin down and vary heavily by industry and incident scale. Be skeptical of any single dollar figure circulating online. Several widely repeated numbers are actually sourced from unrelated data-center downtime studies, not data pipeline incidents specifically.
Where This Goes Next
The procurement wave is real and well documented. What isn’t settled yet is whether the tooling actually closes the gap between “we bought observability” and “we found out before the customer did.” Watch three things over the next 6 to 18 months: whether Monte Carlo’s agent-observability bet gets matched by Acceldata, Bigeye, and Datadog with comparable depth, whether Gartner’s predicted 50% LLM observability investment threshold (targeted for 2028) starts showing up in earlier budget cycles, and whether the tool-sprawl number actually drops instead of just shifting vendors.
If you’re making a buying decision this year, the honest starting point isn’t “which platform.” It’s whether you’re solving for pipeline health, agent trustworthiness, or both, because right now most vendors are still figuring out which one they’re actually built for.
Want the next update on this before it hits the mainstream feeds? Subscribe to The Neural Loop at neuralwired.com/newsletter.
DORA Report: AI Code Review Time Jumps 441% | NeuralWired
DevOps & Engineering
DORA Report: AI Code Review Time Jumps 441%
By the NeuralWired Engineering Desk · Updated July 2026 · 11 min read
Your team ships AI generated code faster than ever. Your review queue is where that speed goes to die. New data from Google’s DORA team and a 22,000 developer telemetry study from Faros AI both point to the same uncomfortable number: median time spent in code review is up 441.5% as AI adoption climbed, not down. If you’re an engineering leader who assumed AI code review would fix the bottleneck AI code generation created, the 2026 numbers say otherwise, and you need to see them before your next tooling decision.
Every AI coding tool vendor is currently selling some version of the same promise: write code faster, review it faster, ship it faster. The generation half of that promise is real. The review half is where the story falls apart.
Faros AI’s “AI Engineering Report 2026: The Acceleration Whiplash” is the most current dataset available on this question. It draws on two years of telemetry from 22,000 developers across more than 4,000 teams, comparing each organization’s lowest AI adoption periods to its highest. The headline findings:
Median time to first PR review is up 156.6%
Average time spent in code review is up 199.6%
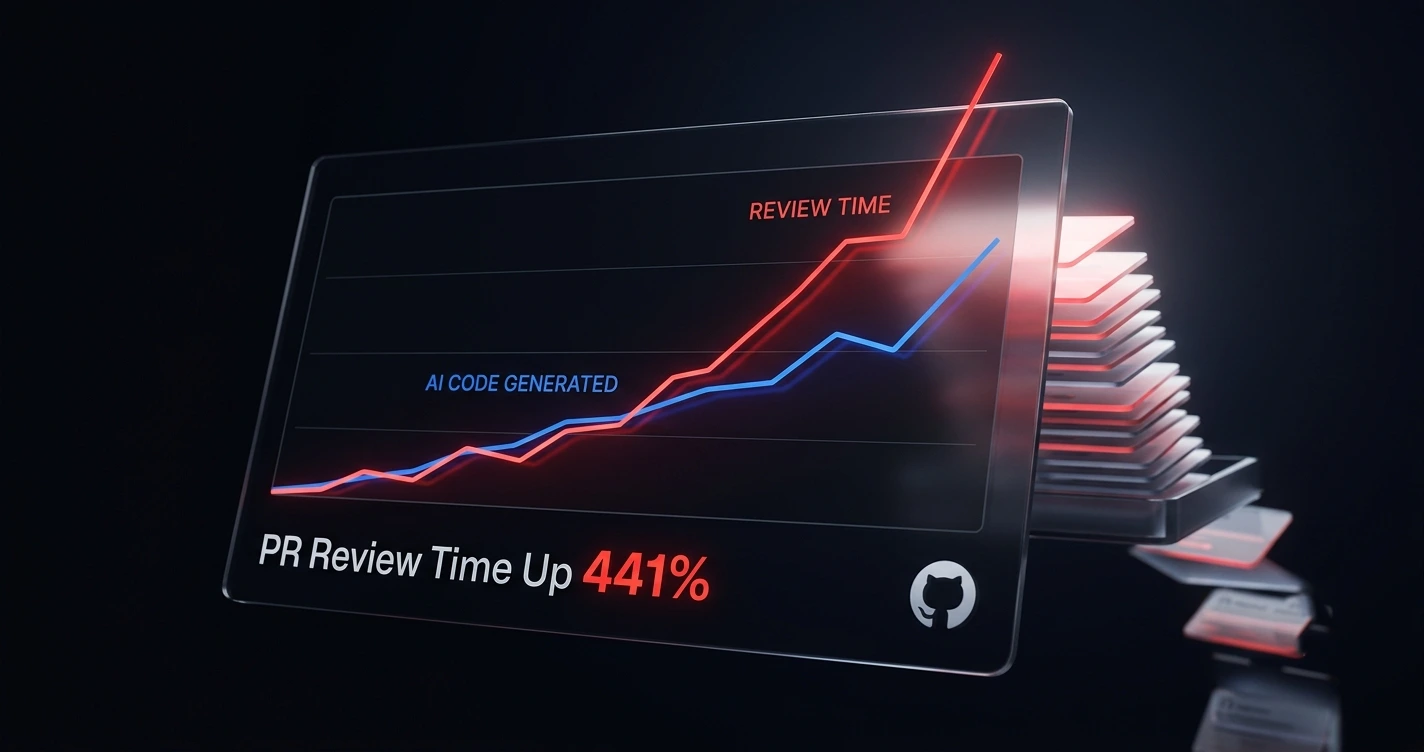
Median time in review overall is up 441.5%
AI code acceptance rate rose from 20% to 60%
Faros AI sells engineering analytics software built on DORA metrics, so treat this as vendor research with a stake in the outcome, not a neutral academic study. Still, the direction of the finding lines up with Google’s own 2025 DORA State of AI Assisted Software Development report, produced with GitHub and IT Revolution. DORA’s framing is that AI acts as an amplifier: it strengthens teams that already have solid engineering practices, and it exposes the weaknesses of teams that don’t. Roughly 90% of developers now use AI daily, according to the report, but nearly a third, 30%, say they have little to no trust in AI generated code.
That distrust has a name in the DORA report: the “verification tax.” Time saved writing code gets spent auditing it instead, and that tax lands squarely on reviewers.
A note on the “4.2 hours vs 90 seconds” claim you might have seen elsewhere. That comparison doesn’t hold up against any primary source we checked. Real human review times range from roughly 4 hours at Google internally to 3 to 5 days at typical enterprise teams, and AI review tools themselves range from about 30 seconds (GitHub Copilot) to several minutes for deep-index tools like Greptile. We’re using the sourced numbers above instead.
Why Review Time Is Exploding, Not Shrinking
Kent Beck, the creator of Extreme Programming and a co-author of the Agile Manifesto, put it about as bluntly as anyone in the industry has:
“We’re accumulating code faster than we are accumulating trust.”
Kent Beck, “Trust Factory” newsletter, newsletter.kentbeck.com
That’s the whole problem in one sentence. AI generated code is, by multiple accounts, superficially convincing. It’s idiomatic. It’s well named. It reads like something a competent engineer wrote. Which is exactly why surface level review, the thing AI review tools are best at, becomes less useful over time: the bugs living in that code tend to be structural, not stylistic. Faros AI’s analysis makes the point directly, arguing that the engineers with the deepest system knowledge are the ones spending their most valuable hours unraveling plausible looking code that should never have reached them in that state.
An independent academic study published on arXiv in December 2024, still the most cited empirical study of its kind as of mid-2026, tested an LLM based automated review tool in real production repositories. Average PR closure time rose from 5 hours 52 minutes before the bot to 8 hours 20 minutes after, a statistically significant increase. Results varied by project. One project’s closure time dropped from 6 hours 6 minutes to 3 hours 7 minutes. Another rose from 20 hours 22 minutes to 30 hours 51 minutes. Roughly 73.8% of the tool’s comments were acted on, and developers reported a modest quality improvement, but the bot also introduced faulty reviews and irrelevant comments that added friction of its own.
Stack Overflow’s 2025 Developer Survey backs this up from the sentiment side: 84% of developers use or plan to use AI tools, yet 66% say their biggest pain point is AI output that’s “almost right,” and 45% say debugging AI generated code takes longer than debugging their own. Sonar’s State of Code 2026 survey of 1,149 developers found 96% don’t trust that AI generated code is functionally correct, but only 48% say they always review before committing. That gap between distrust and actual review discipline is worth sitting with.
The Benchmark Problem: Nobody Agrees What “Accurate” Means
Here’s the part that should worry anyone about to sign a contract with an AI code review vendor: the bug catch rate numbers those vendors publish don’t agree with each other, and they don’t agree with independent testing either.
Tool
Vendor-reported catch rate
Independent benchmark result
Greptile
82% (own 50-PR benchmark)
24% (Martian benchmark)
GitHub Copilot
54% (Greptile’s benchmark)
Not independently ranked in same test
CodeRabbit
44 to 51% (varies by benchmark)
46% (Macroscope’s ranking)
Cursor BugBot
Not separately vendor-reported
42% (Macroscope’s ranking)
Macroscope
Self-reported top performer
48% (its own ranking)
Source: Augment Code’s tool comparison, which flags the discrepancy directly, and buildmvpfast.com’s 2026 tool roundup. There is currently no independent, consensus benchmark for AI code review accuracy. Every number circulating in vendor decks was either run by the vendor or selected by the vendor. Treat any single “catch rate” claim as a marketing input, not a procurement fact, and run a short pilot against known bugs in your own codebase before you buy anything.
CodeRabbit’s own analysis of 470 pull requests, worth noting as vendor data about a competitor’s output rather than its own, found reviewers spend 91% more time reviewing AI generated code than human written code, with three times more readability problems and 75% more logic errors.
What This Means If You Run an Engineering Org
If you’re a VP of Engineering, a Director, or a staff engineer sitting on a tooling decision right now, here’s the shift that matters. Review is the bottleneck now, not code generation. If you’ve been measuring success by PRs merged or deployment frequency alone, you’re getting a misleading picture, because DORA’s and Faros’s data both show throughput metrics improving at the exact same time that stability metrics, change failure rate and rework rate especially, get worse.
DORA’s response to this was structural: the framework expanded from four metrics to five in 2024, adding “rework rate” specifically because AI driven throughput gains were making the old four-metric picture insufficient. That’s the metric to start tracking alongside deployment frequency, not instead of it.
GitHub’s own product team has landed on a position that’s becoming the de facto industry norm: a human always owns the merge button. From GitHub’s official blog:
The team’s interviews with developers found something specific worth stealing for your own workflow: running a Copilot self-review before opening a PR eliminated roughly a third of trivial back-and-forth comments. That’s the actual win available right now, catching the small stuff before a human ever sees the diff, not replacing the human’s judgment call on whether the change should exist at all.
Jon Wiggins, a machine learning engineer at Respondology, put the accountability question in plain terms:
“If an AI agent writes code, it’s on me to clean it up before my name shows up in git blame.”
Jon Wiggins, ML Engineer, Respondology · via github.blog
Any team that’s dropped the human merge gate entirely should be treated as an outlier taking on real production risk, not a leading indicator of where the industry is headed.
The Contrarian Case: 19% Slower, Not 20% Faster
The single strongest piece of contrarian evidence in this entire dataset comes from METR, the nonprofit Model Evaluation and Threat Research group. Its randomized controlled trial, reported in MIT Technology Review, found experienced developers believed AI made them 20% faster. Objective measurement of the same developers found they were actually 19% slower.
That’s not a survey. It’s a controlled study, which makes it much harder to wave away than the productivity claims coming out of vendor marketing. Mike Judge, a principal developer at the software consultancy Substantial, described the gap between perception and reality from the inside:
“I was complaining to people because I was like, ‘It’s helping me but I can’t figure out how to make it really help me a lot.’”
Mike Judge, Principal Developer, Substantial · via MIT Technology Review
Is the “AI review saves time” story realistic on a 2026 timeline? Not straightforwardly. The one controlled academic production study we found (the arXiv paper above) showed AI review increasing PR closure time. Any claim that AI review is a simple time saver needs that caveat attached, because in the best documented empirical test available, it wasn’t one.
GitHub Code Quality’s July Launch: A Real Test Case
There’s a genuinely useful stress test coming. GitHub Code Quality, the governance and quality gate product bundling CodeQL analysis with Copilot code review, moves from public preview to a paid, generally available product on July 20, 2026. More than 10,000 enterprises used the preview. Pricing lands at $10 per active committer per month on enabled repositories, plus usage based consumption for AI powered features like Copilot code review and Copilot Autofix.
Watch what happens to review time metrics at organizations adopting this over the next two quarters. If GitHub’s human-gated model actually closes the gap the data above describes, that’s the strongest real-world signal we’re likely to get all year.
What to Actually Do About It
Track rework rate and time-in-review, not just deployment frequency. A team that ships faster while rework climbs isn’t actually faster.
Keep a mandatory human merge gate. This is GitHub’s own stated product philosophy, not just an internal best practice.
Run AI self-review before human review, not instead of it. GitHub’s data shows this cuts trivial back-and-forth by roughly a third.
Pilot any review tool against your own codebase’s known bugs before trusting a vendor’s published catch rate.
Cap PR size. Multiple sources point to growing PR size, not tooling choice, as the actual driver of review slowdown.
FAQ
Does AI code review replace human code review?
No. Every credible source, including GitHub’s own product team, treats AI review as a first-pass filter for mechanical issues like typos and unused imports, while reserving architecture decisions and merge accountability for human reviewers. GitHub’s official position is that developers will always own the merge button.
How much time does AI code review actually save?
Results are mixed and contested. Vendor claims report time savings, but the most rigorous data, DORA’s 2025 report and Faros AI’s 2026 telemetry from 22,000 developers, found overall review time increasing, with median time-in-review up 441.5% as AI-generated code volume outpaced human review capacity.
What is the most accurate AI code review tool?
There is no independent consensus benchmark. Vendor-run tests and independent benchmarks disagree sharply. Greptile scores 82% bug-catch-rate on its own benchmark but 24% on the independent Martian benchmark. Pilot tools against your own codebase rather than trusting a published leaderboard.
Do AI code reviews catch more bugs than human reviewers?
AI reviewers are strong at mechanical pattern matching, things like missing awaits or unused variables, but consistently weaker at architectural and cross-file reasoning unless built around full-codebase indexing. No tool currently matches an experienced human reviewer’s judgment on whether a feature should exist at all.
Is AI-generated code more likely to have bugs than human-written code?
Yes, per multiple 2026 sources. CodeRabbit’s analysis of 470 pull requests found AI-generated code produced 75% more logic errors and three times more readability problems than human-written code, alongside rising bug rates as AI-code acceptance climbed from 20% to 60%.
Where This Goes Next
Here’s what the 2026 data actually tells you, stripped of the vendor gloss: AI hasn’t made code review faster. It’s made code review the bottleneck the rest of the pipeline is now waiting on, and the tools built to fix that problem haven’t closed the gap yet. Median time-in-review is up 441.5% at the same moment AI review tooling has proliferated across the industry. Those two facts sitting next to each other are the story.
Over the next 6 to 18 months, watch three things. First, whether GitHub Code Quality’s July 20 general availability launch actually moves review-time metrics at scale, since it’s the first major product to bundle static analysis and AI review under one governance umbrella with real enterprise adoption behind it. Second, whether an independent, non-vendor benchmark for AI review accuracy finally emerges, because right now buyers are flying blind. Third, whether DORA’s rework rate metric becomes standard practice at more organizations, since it’s currently the best early warning signal available for exactly the kind of quality debt this article describes.
Our read: this signals a market correction is coming for AI code review vendors who’ve been selling speed as the headline benefit. The winners over the next year will be the tools that reduce rework, not the ones with the flashiest catch-rate slide.
Want data-backed engineering and AI coverage like this in your inbox every week? Subscribe to The Neural Loop at neuralwired.com/newsletter.
Cloud Repatriation 2026: The Data Behind the CIO Shift
Cloud Infrastructure / 2026 Data
Cloud Repatriation 2026: The Data Behind the CIO Shift
By The Neural Loop Desk · NeuralWired.com
GEICO’s infrastructure team ran the numbers and found something uncomfortable: storage in the cloud was one of the most expensive things they were doing, with AI workloads close behind. So the third largest auto insurer in the country started moving pieces of its stack back home. That single decision is a small window into a much bigger story: cloud repatriation is real, it’s measurable, and in 2026 it’s reshaping how enterprises decide where a workload actually belongs.
This isn’t the “cloud is dead” narrative some headlines are chasing. It’s messier and more useful than that. Below is what the 2025 and 2026 survey data actually shows, who’s really moving workloads and why, and where the skeptics have a point worth taking seriously.
Hybrid cloud isn’t a transitional phase anymore. It’s the default. Flexera’s 2026 State of the Cloud Report, based on 753 cloud decision makers, found that 73% of organizations now operate a hybrid estate, up three percentage points year over year. Among organizations with more than 5,000 employees, that number climbs to 78%.
At the same time, public cloud spending keeps climbing. Gartner forecasts worldwide public cloud end user spending will hit $723.4 billion in 2025, a 21.5% increase. Those two facts sound contradictory until you understand what repatriation actually looks like on the ground: it’s workload by workload, not company by company.
Why this matters
Repatriation and cloud growth are rising at the same time because net new cloud adoption still outpaces the workloads moving out. This isn’t an exodus. It’s a correction, and it changes how every infrastructure team should evaluate a new deployment.
The Numbers: Planned vs. Actual Repatriation
The gap between intent and action is the most important, and most underreported, part of this story.
Metric
Figure
Source
CIOs planning some workload repatriation in 2025
86% (highest ever recorded)
Barclays CIO Survey
Cloud workloads actually repatriated so far
21%, up 2 points YoY
Flexera 2026 Report
Organizations planning a full cloud exit
8% to 9%
IDC Server and Storage Workloads Survey
Cloud infrastructure spend considered wasted
27%, down from 32% four years ago
Flexera 2026 Report
Read those four rows together and a clearer picture forms. Most CIOs are open to moving something. Very few are moving everything. And the underlying driver, wasted spend, is actually improving as FinOps practices mature. That’s not the framing most “cloud is dying” articles use, but it’s the one the data supports.
Years ago, people talked about repatriation, but “no one was doing it, it just wasn’t a thing.”
Brian Adler, Senior Director of Cloud Market Strategy, Flexera · CIO Dive
What changed since then is measurement. Adler’s colleague Jay Litkey, SVP of Cloud and FinOps at Flexera and a governing board member at the FinOps Foundation, put it plainly: teams have gotten good enough at cost allocation that “FinOps is providing the data to make repatriation decisions.” Before, repatriation was a hunch. Now it’s a spreadsheet.
Why Enterprises Are Rethinking Cloud-First
Four drivers show up consistently across the survey data and the case studies:
Cost at scale. A third of surveyed organizations now budget $12 million or more a year for public cloud, according to CIO Dive’s reporting on Flexera’s survey. At that spending level, even small percentage savings translate into real capital.
AI and GPU workloads. Steady, high utilization AI workloads often price out better on owned infrastructure than on elastic cloud billing, which is one reason GEICO named AI spend as a specific pain point alongside storage.
Data sovereignty and compliance. Regulatory frameworks like the EU AI Act are pushing some workloads toward infrastructure with clearer jurisdictional control.
Vendor lock-in fatigue. After a decade of cloud-first defaults, some infrastructure teams are simply asking whether “cloud” was ever the right answer for a specific, predictable workload, rather than a blanket policy.
IDC’s Natalya Yezhkova, Research VP in the firm’s Enterprise Infrastructure Practice, frames the shift as a change in posture rather than a reversal. Cloud only is “becoming a less prevalent approach,” she told Data Center Dynamics, replaced by what she calls a “cloud also” mindset.
Real Case Studies: GEICO, 37signals, Dropbox
GEICO: The Insurer Rethinking a 600-App Migration
GEICO began migrating to the cloud in 2013 across more than 600 applications. Over a decade later, Rebecca Weekly, VP of Platform and Infrastructure Engineering, confirmed to The Stack that the company is repatriating workloads as part of a broader architectural overhaul. Her reasoning was direct: “storage in the cloud is one of the most expensive things you can do.”
37signals: The Most Cited Number in Every Repatriation Article
37signals, the company behind Basecamp and HEY, pulled its infrastructure off AWS and Google Cloud starting in 2022. It now reports roughly $1.3 million to $1.5 million in annual savings, or close to $7 million over five years, according to figures compiled by HyScaler. It’s the go-to proof point in nearly every article on this topic, and for good reason. But it comes with a catch, more on that below.
Dropbox: The Original Case Study
Dropbox’s build out of its own storage system, known as Magic Pocket, starting around 2013, is widely considered the founding example of large scale repatriation, predating the current wave by roughly a decade.
The Counterargument: Is This Overstated?
Not everyone buys the resurgence narrative, and the skeptics deserve equal airtime here.
Corey Quinn, Chief Cloud Economist at The Duckbill Group, has argued that “cloud repatriation isn’t a thing” in any broad sense, and points out that the loudest advocates for leaving the cloud often have a commercial stake in that outcome. It’s worth noting Quinn’s own firm sells cloud cost optimization services, meaning his incentive runs the opposite direction: keep clients on the cloud, just spend less. Both sides of this debate have a horse in the race.
Gartner has gone further, publishing research titled “Moving Beyond the Myth of Repatriation,” arguing that on-premises vendors are pushing a false narrative and that most repatriation projects that fail were poorly scoped from the start, not doomed by the cloud itself.
There’s also a semantic wrinkle worth flagging. Gartner analyst Rene Buest calls much of what gets reported as European repatriation “geopatriation” instead, meaning companies are moving to local or regional cloud providers, not back to private infrastructure. In a survey of 241 Western European IT leaders conducted between May and July 2025, 61% said geopolitical factors would increase their reliance on regional cloud providers. That’s a real trend, but it’s a different trend than the one most headlines describe.
The honest caveat on 37signals
37signals runs steady, predictable, well understood workloads, which is close to the textbook best case for repatriation. Most enterprises have a far messier workload mix: bursty traffic, legacy dependencies, uneven ownership across teams. The $7 million savings figure is real, but treating it as a universal template is where a lot of repatriation projects go wrong.
What CTOs and FinOps Leads Should Do Now
The practical shift for infrastructure leaders isn’t “leave the cloud.” It’s building a documented, ongoing framework for deciding where each workload belongs, evaluated on cost, compliance, latency, and data gravity, rather than defaulting to cloud-first for everything new. We broke down exactly that process, including a five-step workload placement model and ROI benchmarks, in our companion piece on a five-step AI workload placement framework for structuring that shift.
A few things worth doing before committing capital to any repatriation project:
Get real cost-per-workload data before deciding anything. Litkey’s point stands: FinOps maturity is what makes these decisions defensible instead of reactive.
Separate “predictable and steady” workloads from “bursty and uncertain” ones. The former are repatriation candidates. The latter usually still favor elastic cloud pricing.
Factor in the 27% cloud waste figure before assuming repatriation is the only lever. Flexera’s data suggests a meaningful chunk of the cost problem can be solved without moving anything.
Treat compliance-driven moves and cost-driven moves as separate decisions with separate criteria, since they often point to different infrastructure choices entirely.
Cloud repatriation is the process of moving applications, workloads, or data from public cloud providers like AWS, Azure, or Google Cloud back to on-premises infrastructure, private clouds, or colocation facilities. It’s rarely a full exit. Most organizations move only specific, cost-sensitive workloads.
Why are companies leaving the cloud?
The leading drivers are unpredictable costs at scale, data sovereignty and compliance requirements, performance needs for AI and latency-sensitive workloads, and vendor lock-in. Flexera reports 27% of cloud spend is considered wasted, while IDC finds cost and compliance are the top repatriation motivators.
How many companies are doing cloud repatriation?
Roughly 86% of CIOs planned some level of workload repatriation in 2025, the highest rate ever recorded, per Barclays’ CIO Survey. But only about 8% to 9% plan a full exit, per IDC, and actual repatriated workloads sit at 21%, per Flexera’s 2026 report.
Is cloud repatriation a real trend or hype?
Both views have credible backing. Gartner and cloud cost consultants like Corey Quinn argue repatriation is overstated and often vendor driven. Flexera’s survey data shows a real, measurable two point year over year increase in actual repatriated workloads, suggesting a modest but genuine shift, not a mass exodus.
What companies have done cloud repatriation?
The most cited examples are Dropbox, which built its own Magic Pocket storage system starting in 2013, 37signals (Basecamp, HEY), which left AWS and Google Cloud in 2022 and reports close to $7 million in five year savings, and GEICO, which is moving workloads back amid a major infrastructure overhaul after cloud storage and AI costs rose sharply.
Where This Goes Next
The two numbers to watch over the next 12 to 18 months are the 21% actual repatriation figure and the 27% cloud waste figure. If FinOps maturity keeps chipping away at waste, some of the pressure driving repatriation eases on its own. If it doesn’t, expect the 21% to keep climbing toward the 86% intent figure, and expect AI and GPU workload economics specifically to be the next flashpoint.
Three things worth tracking:
Whether Flexera’s next report shows the 21% figure accelerating or plateauing
How many enterprises follow GEICO’s lead on AI workload placement specifically, separate from general storage costs
Whether “geopatriation” becomes its own tracked category in 2027 surveys, separate from true on-premises repatriation
What’s clear now, and wasn’t as clear a year ago, is that this isn’t a binary choice between cloud and on-premises. It’s a workload-by-workload calculation, and the companies getting it right are the ones treating it as an ongoing discipline rather than a one-time migration decision.