NeuralWired’s Technology section covers the developments reshaping how the world builds, deploys, and regulates digital innovation. We report daily on the stories driving global conversation in artificial intelligence, big technology companies, startups and venture funding, cybersecurity, consumer gadgets and devices, and blockchain and cryptocurrency.
Our technology coverage goes beyond product announcements. When a major AI model launches, we explain what it can actually do and where its claims are overstated. When a startup raises a large funding round, we look at whether the business behind it can sustain that valuation. When a cybersecurity breach hits the news, we explain who is affected and what comes next, not just what happened. Each article is built from original research into primary sources, including company statements, technical documentation, regulatory filings, and verified data, and is written by our editorial team rather than generated automatically.
Readers come to this section for daily updates on the technology stories that matter globally, from shifts inside major technology companies to emerging tools changing how people work, communicate, and build. Whether you are a founder, an investor, an engineer, or simply someone trying to understand where technology is heading next, NeuralWired’s Technology coverage is built to keep you informed without wasting your time on hype.
Artificial IntelligencePublished: May 15, 2026 · Updated: May 2026
How to Measure AI ROI in Enterprise: The Framework CFOs and CTOs Actually Agree On (2026)
Only 25% of enterprise AI initiatives delivered their expected ROI in 2025, yet budgets keep growing. Here’s the measurement framework that closes the gap between engineering logic and P&L reality.
Only 25% of enterprise AI initiatives delivered their expected ROI in 2025, according to IBM’s CEO Study. Yet global AI spending surpassed $301 billion in 2026, and 65% of enterprises increased their AI budgets year-over-year. The math doesn’t add up, and it’s because most organizations are measuring AI ROI the wrong way.
The problem isn’t the technology. CTOs are building business cases in the language of engineering while CFOs think in the language of P&L. This guide gives you the framework that closes that gap: a 3-layer ROI model, a full cost accounting checklist of variables most teams undercount, and a ready-to-use ROI scorecard you can bring into your next budget review.
Why Most AI ROI Calculations Fail: The Vanity Metric Trap
Only 47% of IT leaders said their AI projects were profitable in 2024. A further 33% broke even, and 14% recorded outright losses, according to an IBM-commissioned report from 2025. Boards keep approving AI budgets anyway, because the ROI numbers they’re seeing are built on pilot economics, not production reality.
The root cause is a reliance on four vanity metrics that inflate AI ROI on paper without producing anything verifiable on the P&L. These are: time-saved-per-employee projections that never get audited against actual output, accuracy improvement percentages disconnected from any revenue figure, user adoption numbers that count logins rather than business outcomes, and model benchmark scores that measure lab performance against real-world deployment complexity.
The credibility gap is wide. Only 51% of organizations said they could confidently evaluate the ROI of their AI spend, according to the CloudZero State of AI Costs 2025, even as average monthly AI spend reached $62,964 per month. The gap between spending confidence and measurement confidence is where most AI investment goes to die.
“Organizations that account for technical debt in their AI business cases project 29% higher ROI than those that don’t. That single discipline explains most of the performance gap between AI winners and losers.”
IBM Institute for Business Value, CEO Study 2025 — ibm.com
That 29% gap from technical debt accounting alone tells you everything. The AI projects that never reach production almost universally share one trait: they were greenlit on pilot economics and then surprised their sponsors with production costs nobody had modeled.
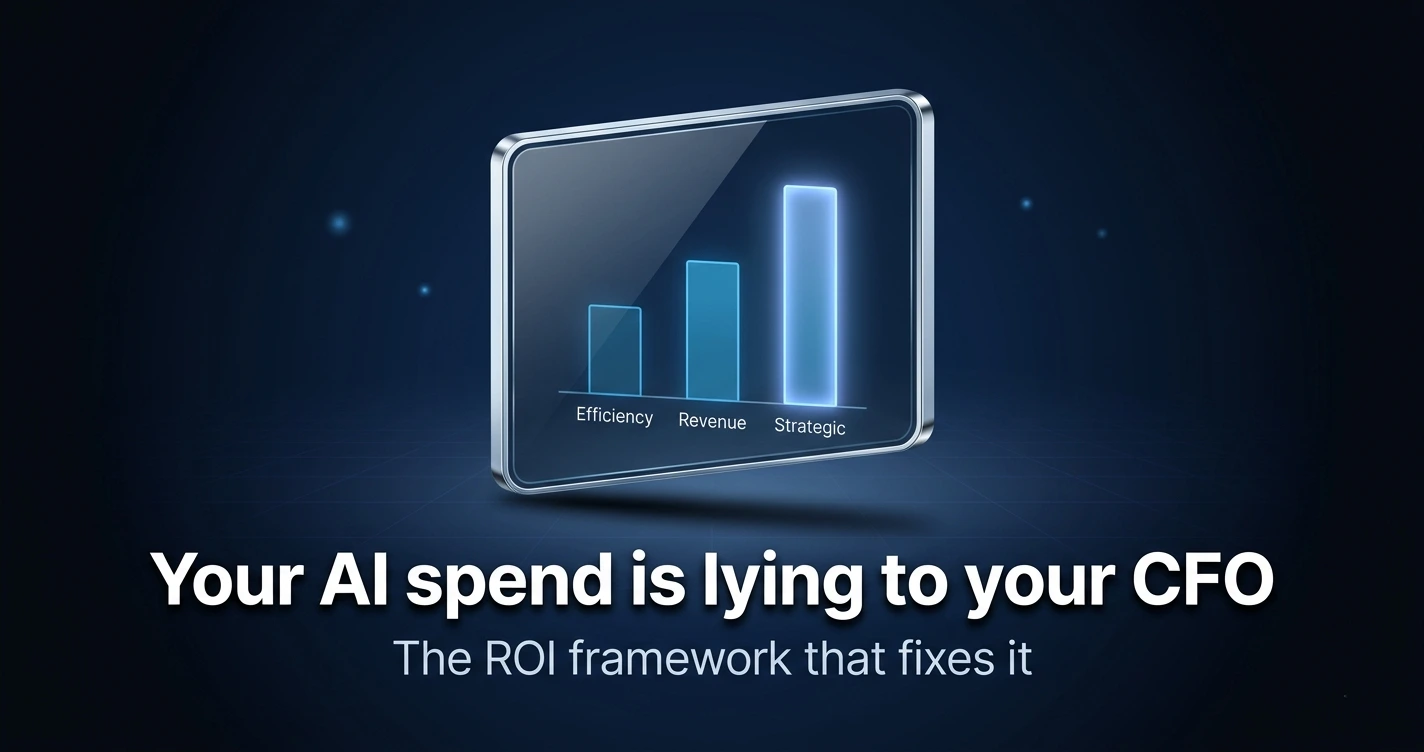
The 3 ROI Layers: Efficiency, Revenue Impact, and Strategic Value
Most enterprise AI ROI frameworks collapse everything into a single number. That’s the wrong structure. There are three distinct layers of return, each with a different measurement timeline, owner, and ceiling. Conflating them is how you end up with a CFO who thinks the AI program is underperforming and a CTO who thinks it’s working fine. They’re measuring different things.
Competitive positioning, talent attraction, data asset accumulation, capabilities unlocked for future initiatives
24+ months
CEO / Board
Layer 1: Efficiency ROI
This is the fastest and most measurable layer. It includes cost per task reduction, headcount reallocation, error rate reduction, and processing speed gains. According to Deloitte’s 2026 State of AI report, surveying 3,235 business leaders, 66% of organizations report productivity and efficiency gains from AI. This is where most enterprise AI ROI lives today, and it’s the only layer most CFOs ever see.
Layer 2: Revenue Impact ROI
This layer is harder to measure but carries a significantly higher ceiling. It covers faster time-to-market, improved customer retention, upsell and cross-sell from AI personalization, and revenue recovered through churn prediction. Deloitte found that 74% of organizations aim to grow revenue through AI, but only 20% are already doing so. That gap is a measurement problem, not a technology one. Teams that don’t define revenue attribution before deployment never close it.
Layer 3: Strategic Value ROI
This is the most important and least measured layer. It includes competitive positioning, talent attraction, data asset accumulation, and optionality: the capabilities unlocked for future initiatives that don’t exist yet. McKinsey’s AI high performers, the 6% of enterprises where 5% or more of EBIT is attributable to AI, invest in this layer intentionally. Most organizations treat it as an afterthought.
Cross-study meta-analysis from MasterOfCode (2026) finds that visionary AI adopters show 1.7x revenue growth, 3.6x three-year total shareholder return, and 2.7x return on invested capital versus laggards. That performance spread is the 3-layer ROI model working as designed: efficiency funding the case, revenue expanding it, and strategic value compounding it.
How to Calculate Time-to-Value for an AI Initiative
Time-to-Value (TTV) and payback period are not the same thing, and most enterprise AI teams conflate them in ways that produce wildly optimistic board presentations. TTV is the time from project approval to the first measurable business impact. Payback period is the time until cumulative returns exceed total investment. Both matter. Confusing them skews your planning horizon by months.
The TTV Formula
TTV = Development Time + Integration Time + Change Management Time + Stabilization Period. Each phase carries hidden time costs that teams routinely underestimate, particularly change management, which pilots consistently treat as a rounding error.
The industry median for AI agent deployments is 5.1 months from approval to first measurable business impact, based on BCG and Forrester 2026 surveys. But that median masks significant variation by function. Sales and SDR agents pay back in 3.4 months. Finance and operations agents average 8.9 months. If your team is planning a finance automation initiative with a 4-month payback model, the benchmarks say you’re off by more than half.
The Three TTV Killers
🗄️
Data Readiness
Data preparation consumes 30–50% of AI project budget and time. It’s the single most underestimated phase in every enterprise AI business case.
🔗
Integration Complexity
60% of enterprises name legacy system integration as their top AI challenge (Deloitte 2026). The API layer looks simple in the architecture diagram. It never is in production.
👥
Adoption Lag
The human change curve that pilots always ignore. Users resist new workflows regardless of tool quality. Change management is not a soft cost; it’s a hard timeline driver.
Forrester data shows 44% of AI projects that move to production achieve positive ROI within 12 months. That number sounds encouraging until you flip it: 56% of production AI deployments take longer than 12 months to reach positive ROI, or never do. Proper TTV planning is the difference between being in the 44% and explaining to the board why you’re in the 56%.
Cost Variables CTOs Always Undercount
Companies underestimate total AI costs by 30% or more, according to analysis from the Ramsey Theory Group published in April 2026. The hidden costs tied to inference at scale, data engineering, model monitoring, and continuous retraining now surpass initial model development costs in most production AI systems. The business case looks clean at approval. The invoice looks very different 18 months later.
Operating cost exceeds build cost within 18–24 months in many production AI systems. Hidden costs add 30–50% beyond initial estimates across multiple independent analyses. This is not an edge case. It’s the default outcome for teams that treat AI like a capital project rather than a permanent operating expense line.
Hidden Cost 1: Inference at Scale
A support assistant handling 50,000 conversations per month at $0.01 per turn costs $5,000 per month. Add multi-step reasoning and retrieval-augmented generation and that number multiplies. Enterprise LLM inference costs run $5,000 to $50,000 per month at production scale, per CloudZero’s State of AI Costs report. The critical detail most AI ROI models miss: agentic workflows trigger 10–20 LLM calls per user task versus one call for a standard chatbot, according to Gartner’s March 2026 analysis. If your business case was built on chatbot-level consumption economics, your actual inference bill will arrive as a shock.
This is where hybrid cloud AI cost strategy becomes a practical requirement rather than an architectural preference. Teams that model inference costs at agentic call volumes before deployment avoid the budget revision conversation entirely.
Hidden Cost 2: Model Retraining
Budget $15,000 to $40,000 per year for a moderately complex model running quarterly retraining cycles. Most initial business cases budget exactly $0 for this line item. Annual AI maintenance runs 15–25% of the initial build cost and should be treated as a permanent operating expense, not a one-time project cost. That framing matters for how the CFO categorizes it: CapEx at approval, OpEx forever after.
Hidden Cost 3: Data Pipeline Maintenance
Continuous data ingestion, cleansing, and labeling don’t stop when the model goes live. Enterprise AI projects add $500 to $3,000 per month in data infrastructure costs that don’t appear in initial estimates. When you combine this with the 30–50% of project budget that data preparation consumed during build, data is easily the largest single cost category in any AI initiative over a three-year horizon.
Hidden Cost 4: Human-in-the-Loop Operations
High-stakes AI deployments in legal, medical, and customer-facing contexts require human review workflows. The cost of building, staffing, and managing these pipelines is real and almost never in the initial estimate. Teams that skip this step don’t avoid the cost. They discover it during a compliance review or a customer escalation, at which point the retrofit bill is higher.
Hidden Cost 5: MLOps Retrofit
Teams that skip monitoring deploy blind. Emergency remediation and retroactive MLOps build costs $40,000 to $100,000, which is more than the cost of implementing monitoring correctly from the start, according to Azilen’s 2026 analysis. This cost category doesn’t appear in the P&L until something breaks. It then appears all at once.
“The shift to agentic AI workflows changes the cost calculus entirely. A task that triggered one LLM call as a chatbot now triggers 10–20 calls as an agent. Most enterprise ROI models weren’t built for that volume.”
Gartner, March 2026 Agentic AI Cost Analysis
The CFO Conversation: Translating AI Metrics into P&L Language
CTOs speak in tokens, latency, accuracy, and model size. CFOs speak in EBIT margin, payback period, net present value, and OpEx versus CapEx. These are different languages, and most AI initiatives die in the translation. The technology works. The business case doesn’t survive the budget review.
The board pressure signal is already shifting the dynamic. CFOs are now killing more AI projects than CTOs launch, according to Solutions Review’s Enterprise AI Predictions for 2026. The era of approving AI spend on future potential is over. CFOs now require P&L impact in quarters, not years. If your CTO can’t speak that language, the initiative won’t get funded, regardless of how good the model is.
The Translation Table: CTO Metrics to CFO Equivalents
CTO Metric
CFO Equivalent
How to Calculate
Model accuracy improvement
Reduction in error-resolution cost
Error volume × average cost per error × accuracy delta
Inference cost per query
AI-specific OpEx line item
Monthly queries × cost per query × 12
Time-to-resolution reduction
Revenue protected from churn
Retention rate uplift × annual contract value
Token throughput at scale
Unit economics per automated transaction
Cost per 1,000 tokens × average tokens per task × monthly task volume
Model F1 score improvement
Reduction in false positive remediation cost
False positive volume × handling cost × F1 delta
The alignment check that surfaces misalignment fastest: ask the CFO and the business unit leader, without the CIO in the room, to explain what the company is doing with AI and why. If only technical leaders can describe the AI strategy, it’s still a tech project, not an enterprise transformation. CIO.inc’s 2026 enterprise maturity benchmarking makes this the single clearest indicator of whether AI has crossed from pilot to program.
A well-prepared CTO should be able to deliver three specific sentences about any AI initiative going into a budget review. First: “This initiative will reduce [specific process] cost by $Y over 18 months.” Second: “Our payback period is Z months, assuming [clearly stated assumptions].” Third: “If adoption reaches only 50% of forecast, ROI is still positive at [X] months.” Those three sentences answer the questions a CFO asks before the CFO asks them. That’s how AI programs survive budget season.
The governance model that sits behind this conversation matters as much as the metrics themselves. Organizations with formal AI governance structures consistently report higher CFO confidence in AI spend, because there’s an auditable process behind the numbers, not just engineering judgment.
The Enterprise AI ROI Scorecard (Use This Template)
This scorecard condenses the full framework into a single reference you can bring to your next budget review or board presentation. Each metric maps to a measurable data point, a benchmark drawn from current research, and a health indicator that flags when a deployment is drifting off track.
Metric
What to Measure
Target Benchmark
Health
Time-to-Value
Months from approval to first measurable business impact
Total monthly inference bill divided by total AI-processed events
Below $0.01 per query for standard tasks
Monitor ⚠
Hidden cost ratio
Actual total cost divided by original budget estimate
1.35x or less (warning above 1.5x)
1.3–1.5x ⚠
Productivity uplift
% performance improvement in AI-augmented roles
37% average uplift versus 12% from traditional automation
Above 25% ✓
Payback period
Months until cumulative returns exceed total investment
14 months or less (McKinsey 5.8x ROI baseline)
14 mo or less ✓
Revenue layer ROI
$ revenue impact attributable to AI initiative
Positive within 24 months
Measure ⚠
Model maintenance cost
Annual retraining and monitoring as % of build cost
15–25% of build cost (industry norm)
Above 30% = risk ✗
Adoption rate
% of target users actively using AI tool after 90 days
60% or more for copilot tools; 80% or more for agentic systems
Measure ⚠
CFO alignment score
Can CFO describe AI initiative value without CTO present?
Yes = mature program; No = still a tech project
Yes ✓
Update this scorecard quarterly. McKinsey found that AI high performers review ROI metrics 3x more frequently than average adopters. A quarterly review cadence turns this static template into a living management tool and gives CFOs the audit trail they need to approve next year’s AI budget without a fight.
This framework connects directly to your broader AI strategy. The scorecard is only as useful as the governance process that feeds it with accurate data. Teams that instrument their deployments properly from day one generate the numbers this scorecard needs automatically. Teams that don’t are estimating, which is how you end up in the 75% of AI initiatives that disappointed their board.
Real Examples: Where Enterprises Saw 3x+ ROI and Why
Case studies are only useful if they’re specific enough to map your use case onto. The three examples below represent different industries, different function types, and different ROI timelines. What they share is more instructive than what separates them.
Example 1: IT Ticket Automation at Getronics
Getronics automated one million IT tickets annually using AI agents integrated directly with ServiceNow and Systrack Diagnostics. The result was faster resolution times, reduced human agent workload, and measurably better customer experience scores. The ROI profile here is ideal for a first enterprise AI deployment: high volume, highly repetitive process, clear baseline metric, and existing workflow integration that eliminated change management friction.
Example 2: Campaign Brief Generation at Databricks
Databricks’ marketing team built “Briefbot,” an AI agent that generates 80% of a campaign brief in approximately five minutes. A task that previously consumed half a day of senior marketer time became a review-and-edit process. At scale, this translates directly to either cost savings or increased output capacity across hundreds of briefs per year. The measurable input and output made ROI calculation straightforward from day one.
Example 3: Predictive Maintenance in Manufacturing
AI-driven predictive maintenance reduces equipment downtime by 45% and maintenance costs by 25% in manufacturing settings, based on current industry deployment data. For an organization running a $10 million annual maintenance budget, that’s $2.5 million in annual savings. The payback period in this category is typically measured in months rather than years, which makes it one of the strongest ROI profiles available in enterprise AI today.
What These Three Have in Common
All three succeeded for the same four reasons. First, they targeted a measurable, high-volume process rather than a vague transformation goal. Second, ROI metrics were defined before deployment, not after. Third, they integrated into existing workflows rather than requiring parallel system adoption. Fourth, they established clear human handoff protocols so that edge cases didn’t escalate into reliability incidents.
The macro benchmark that ties this together: McKinsey reports a 5.8x ROI on AI investment within 14 months of production deployment for high-performing implementations. The qualifier “high-performing” is doing real work in that sentence. That result comes from organizations with governance, data readiness, and measurement frameworks in place before the first model goes live. This article gave you that framework. Now the measurement gap is yours to close.
What to Watch
01
CFO veto activity on AI budgets will increase through Q3 2026 as first-generation deployments hit their 18-month cost inflection point and operating expenses exceed build costs on the books. Organizations without a hidden cost accounting framework will face the largest revision requests.
02
Agentic AI inference cost benchmarks will emerge as a formal category by Q4 2026, with Gartner and Forrester publishing per-workflow cost norms for sales, finance, and IT operations agents. These will become the standard comparison points in CFO presentations replacing current per-query metrics.
03
Revenue layer ROI attribution tooling is the next major enterprise AI category. The 20% of organizations currently capturing revenue impact from AI (Deloitte 2026) share one capability: purpose-built attribution pipelines. Vendors offering this natively will see accelerated enterprise procurement cycles starting H2 2026.
Frequently Asked Questions
What is a good ROI benchmark for enterprise AI in 2026?
McKinsey reports high-performing enterprises achieve 5.8x ROI within 14 months of production deployment. A more conservative baseline: 44% of AI projects that reach production achieve positive ROI within 12 months (Forrester). For most enterprise AI investments, a payback period under 18 months is a reasonable target; anything beyond 24 months requires a compelling strategic value argument to survive CFO review.
How do you calculate AI ROI for a CFO presentation?
Translate technical metrics into P&L terms first. The core formula is: (Total value generated minus Total AI costs) divided by Total AI costs, multiplied by 100. Total costs must include inference at production scale, model retraining cycles, maintenance, and integration, not just build cost. Present the payback period alongside a conservative scenario where adoption reaches 50% of forecast; CFOs trust numbers that come with a downside model.
What hidden costs do CTOs most often miss in AI ROI calculations?
The most underestimated costs are inference at production scale ($5,000 to $50,000 per month for enterprise LLM deployments), model retraining cycles ($15,000 to $40,000 per year), data pipeline maintenance (30–50% of project budget), and MLOps monitoring retroactively implemented post-launch ($40,000 to $100,000). Together these add 30–50% beyond initial estimates. Agentic workflows compound the inference cost specifically, triggering 10–20 LLM calls per task versus one for a standard chatbot.
How long does it take to see ROI from enterprise AI?
The median time-to-value for AI agent deployments is 5.1 months from approval to first measurable business impact (BCG and Forrester 2026). Revenue impact typically materializes within 12–24 months. Sales AI agents pay back fastest at 3.4 months; finance and operations agents average 8.9 months. Data readiness and change management are the biggest timeline drivers. Teams that underestimate these phases routinely miss their payback projections by six months or more.
Why do most AI initiatives fail to deliver expected ROI?
IBM’s 2025 CEO Study found only 25% of AI initiatives delivered expected ROI. The main causes are pilot economics applied to production business cases, absence of a formal governance model, data quality issues (52% cite this as the primary blocker), and poor change management that produces low adoption regardless of technology quality. The 29% ROI gap between organizations that account for technical debt and those that don’t is the clearest single diagnostic for why most programs underperform.
What is the difference between time-to-value and payback period for AI?
Time-to-value (TTV) is the time from project approval to the first measurable business impact. Payback period is the time until cumulative returns exceed total investment. TTV can be 5 months while payback period is 14 months; they measure different things. Conflating them in business cases produces overly optimistic payback projections because the costs continue accumulating after initial impact, particularly maintenance and retraining expenses that most teams don’t model.
How do you build the CFO-CTO alignment needed to approve an AI budget?
The fastest alignment test is to ask the CFO to describe the AI initiative’s value without the CTO present. If they can’t, the program is still a technology project rather than a business investment. Alignment requires translating every technical metric into a P&L equivalent before any board presentation: model accuracy becomes error-resolution cost reduction, inference cost becomes an OpEx line item, and resolution speed becomes revenue protected from churn. Three specific sentences covering projected savings, payback period, and the conservative scenario close most CFO objections before they surface.
What AI use cases have the fastest ROI payback in enterprise settings?
Sales and SDR AI agents pay back in 3.4 months on average (Forrester 2026), making them the fastest-returning enterprise AI category. IT ticket automation and predictive maintenance in manufacturing also show strong early returns because they target high-volume, repetitive processes with measurable baselines. Finance and operations agents take significantly longer at 8.9 months average, partly due to integration complexity with legacy financial systems and higher human-in-the-loop requirements in regulated environments.
Stay ahead of enterprise technology.
NeuralWired delivers weekly intelligence for CTOs, CISOs, and AI leads — no noise, no filler.
Why 89% of AI Agent Projects Fail in 2026 — The 4-Stage Fix — NeuralWired
Artificial IntelligencePublished: May 15, 2026 · Updated: May 2026
Why 89% of AI Agent Projects Fail in 2026 — The 4-Stage Fix
Enterprise AI agent deployments are collapsing at scale, not because the models are weak, but because the architecture, governance, and data foundations weren’t built for autonomous systems. Here’s how the 11% that reach production actually do it.
Only 11% of enterprises that pilot AI agents ever get them into production. That number, drawn from Gartner’s April 2026 analysis and Deloitte’s Tech Trends report, translates to an 89% failure rate for agentic AI pilot-to-production transitions, despite global AI spending forecast to exceed $2 trillion this year. The failures aren’t happening in the models. They’re happening in the system design, governance architecture, and data pipelines that enterprises built for a different era of computing.
The stakes are no longer theoretical. McKinsey’s 2025 Global AI Survey found that while 88% of organizations use AI in at least one function, only 39% have seen any measurable impact on EBIT. Executive leadership and external auditors have raised the bar: success now requires sustained productivity gains, documented P&L impact, and a delegation chain auditable for compliance. Demo performance that handles fewer than 10,000 monthly interactions is increasingly classified as failure regardless of how well it worked in a controlled environment.
The 4-stage fix that separates the 11% isn’t a vendor solution. It’s an architectural discipline covering pilot validation, data readiness, identity governance, and closed-loop feedback. Each stage has hard decision gates. Skip one, and the agent joins the 89%.
The real failure rate data: what MIT, Gartner, and IBM actually say
The “90% failure” figure circulating in industry briefings isn’t a single study. It’s a convergence of independent findings from organizations that define failure differently, yet arrive at the same structural diagnosis. Understanding what each institution actually measured matters before you can design an effective response.
MIT’s Project NANDA, first published in July 2025, found that 95% of organizations reported zero measurable financial return from initial generative AI initiatives. Gartner’s separate analysis predicts 40% of agentic AI projects will be cancelled outright by 2027, with 60% of projects lacking “AI-ready data” abandoned entirely before that deadline. The RAND Corporation tracked a broader cohort across 2024 and 2025 and found that over 80% of AI projects never reach a production state at all.
Research Organization
Core Statistic
What They Actually Measured
MIT Project NANDA (2025)
95% failure
Organizations reporting zero measurable financial return from pilots
Deloitte Tech Trends (2026)
89% failure
Agentic AI pilots failing to reach production deployment
RAND Corporation (2024–2026)
80%+ failure
AI projects that never reach a production state
BCG (Sept 2025)
60% no value
Organizations generating no material value despite continued investment
S&P Global Market Intelligence
46% scrapped
Proof-of-concepts abandoned before production hardening
Gartner (2025–2026)
40% cancellation
Predicted agentic AI project cancellations by 2027 due to unclear ROI
The common thread across all these datasets isn’t model performance. It’s adoption that fails to penetrate core business workflows, what analysts are now calling “cosmetic AI.” Organizations that layer a conversational interface over a legacy CRM call it an AI agent. It isn’t. The distinction matters because the architectural requirements for a true autonomous agent, one that navigates systems, executes decisions, and maintains context across multi-step workflows, are fundamentally different from anything in the current standard enterprise stack.
“I’ve seen more companies fail by starting too big than fail by starting too small. Focus on building applications using agentic workflows rather than solely scaling traditional AI. That’s where the greatest opportunity lies.”
Andrew Ng, Managing General Partner, AI Fund and Founder, DeepLearning.AI, Lessons from Andrew Ng
The 4 infrastructure gaps killing agent deployments before production
When an AI agent moves from answering questions to executing tasks, navigating a CRM, managing supply chain decisions, resolving IT tickets without human input, it exposes four structural gaps that traditional enterprise architecture was never built to handle. Each gap is individually survivable. All four together guarantee failure at scale.
Gap 1: Legacy System Integration and the Polling Tax
Approximately 46% of enterprises cite legacy system integration as their primary deployment obstacle. Traditional enterprise architectures were designed for human-speed interaction and batch processing cycles measured in hours. Autonomous agents demand real-time, high-frequency decision loops measured in milliseconds.
Most agentic implementations rely on conventional APIs and ETL pipelines built for data retrieval, not autonomous decision-making. This creates the “polling tax” — agents must constantly query APIs to check for status updates rather than reacting to state changes as they occur. In a 12-step agentic workflow, the compute and egress costs from continuous polling can exceed the cost of the AI model itself. Organizations that don’t migrate to event-driven architectures find their agents too slow and too expensive for production load, even when the models perform correctly.
Gap 2: Governance Chaos and the Identity Ambiguity Problem
Only 23% of enterprises currently have a formal strategy for agent identity management. In the absence of a dedicated framework, internal teams default to sharing human credentials or access tokens with agents, a practice that 55% of enterprise leaders describe as a “chaotic free-for-all.” The result is what security teams now call Shadow Agents: autonomous entities operating without identity controls, access policies, or audit trails.
When a Shadow Agent causes a production incident, there’s no attribution path. No ownership chain. No rollback logic. Research shows that organizations establishing a dedicated AI operations function before scaling beyond pilots see 5.7x lower rollback rates than those that assign ownership only after a crisis forces the issue.
Gap 3: Orchestration Complexity and Silent Regressions
Multi-agent systems introduce exponential coordination overhead that doesn’t appear in pilot environments. In production, the bottleneck shifts from model performance to agent-to-agent communication latency and error propagation. The more dangerous problem is silent regressions, where a model update or prompt change causes incorrect outputs that surface metrics don’t catch, because the agent continues completing tasks while skipping validation steps or reasoning from flawed assumptions. These failures are invisible until a downstream system is already corrupted.
Gap 4: The Observability Deficit and Archaeology Projects
Most enterprise AI agent deployments go into production without structured evaluation harnesses or distributed tracing. When something breaks, technical teams spend weeks determining whether the failure originated in the prompt, the model, the tool integration, or the orchestration logic. These “archaeology projects” destroy stakeholder trust faster than any technical failure. Without traceability built in from day one, political pressure to cancel outpaces any technical recovery effort, and the project joins the 89%.
🔗
Integration Wall
46% cite legacy system integration as the primary failure driver. Polling-based APIs create costs that exceed the model spend itself.
🪪
Identity Chaos
Only 23% have agent identity strategies. Shadow Agents with shared credentials create unauditable risk exposure at scale.
🔄
Silent Regressions
Multi-agent coordination failures and prompt drift produce systematically wrong outputs that normal monitoring won’t surface.
🔭
Observability Gap
Deployments without distributed tracing turn failures into multi-week archaeology projects that kill stakeholder confidence.
Stage 1 — Pilot validation: what to test before you scale
The 5% cohort that consistently realizes substantial value from agentic AI treats the pilot phase as a validation exercise, not a development sprint. This means defining the business problem and baseline metrics before selecting any technology, a sequence only 15% of U.S. enterprises currently follow. Successful organizations are twice as likely to have redesigned end-to-end workflows before picking a modeling approach.
The One-Page Use-Case Charter
Misalignment between business outcomes and technical proposals kills more projects than bad models do. A successful Stage 1 produces a single-page charter — signed by the business owner, data lead, and executive sponsor, specifying the exact problem being solved, the baseline metric being improved, and the target KPIs with measurement methodology. No charter means no pilot. Projects that skip this step are statistically indistinguishable from those that never start, and they consume budget that compounds the eventual write-off.
The KPI Ladder for Agentic Performance
Vague productivity goals don’t survive contact with finance leadership. Agentic deployments require a two-tier KPI structure: lead metrics that signal whether the agent can function autonomously, and lag metrics that connect agent behavior directly to P&L impact. Both tiers must be defined before the pilot begins.
KPI Tier
Metric
Target Threshold
What It Measures
Lead Metric
Task Completion Rate
≥90%
Agent’s ability to finish workflows without human intervention
Lead Metric
Grounding Accuracy
≥95%
Reasoning anchored in source data — not hallucinated context
Lag Metric
Cost-Per-Task Reduction
9x to 66x
Economic benefit vs. human-handled equivalent workflows
Lag Metric
Payback Period
4 to 9 months
Time to recoup deployment and infrastructure costs
The 90-Day Scale Decision Gate
At the end of 12 weeks, a formal decision must be made: scale, pivot, or terminate. Terminating a failing proof-of-concept at week 12 is high-value behavior, it prevents the sunk-cost escalation that has drained enterprise AI budgets throughout 2025 and 2026. Projects that don’t hit the task completion threshold and can’t demonstrate a clear path to 9x cost reduction by this gate should be stopped, not re-resourced. The organizations that succeed treat a clean termination as a win, not a loss.
Stage 2 — Data readiness: why bad data sinks 60% of agents
Data quality is the single most common reason enterprise AI agent projects fail to deliver value. Gartner’s research is direct: 60% of AI projects that lack “AI-ready data” will be abandoned entirely through 2026. The problem isn’t storage or volume. It’s semantic alignment, whether the data an agent can access accurately reflects the business context it needs to reason about in real time.
The Semantic Context Mismatch
Traditional data systems record what happened. Agents need to understand why it happened and which policy constraints apply at the moment of decision. In most organizations, telemetry, finance, and customer data systems don’t stay aligned in real time. An agent observing that a customer received a large discount might conclude future discounts should be restricted, missing that the discount was a deliberate retention play following a major service outage. That decision is internally logical and operationally wrong. At scale, these errors compound until they cause measurable business damage that surfaces in the wrong meeting.
Why RAG Pipelines Are Failing in Production
Retrieval-Augmented Generation is the connective tissue of modern agentic systems, and it’s breaking down at production scale in three distinct patterns. Stale embeddings occur when vector databases point at static documents that aren’t updated as production policies change, causing agents to reason from outdated rules. Context loss across multi-step workflows causes what practitioners call “false confidence”, the agent proceeds with an incorrect assumption it treats as validated input. The third pattern, increasingly documented in 2026, is the “RAG Spray” attack: adversaries deliberately fragment malicious instructions across enough document chunks that they propagate across vector-space positions and bias agent decision-making at retrieval time.
Data Readiness Gate: Before a single line of agentic code is written, map every data asset to a specific business objective, establish active metadata management, and confirm that pipelines can support real-time agent queries without returning stale records. A use-case-specific data readiness score must exist before the pilot gate opens.
Stage 3 — Governance layer: identity, access, and audit trails
Nearly two-thirds of organizations cite security and risk as the top barrier to scaling agentic AI, ahead of technical limitations. That’s a governance diagnosis, not an engineering one. As AI moves from experimentation to mission-critical infrastructure, identity management becomes the chokepoint where production stability is either guaranteed or destroyed. The 2026 CISO playbook for agentic AI defines this through five controls, each addressing a failure mode visible in post-incident reviews from organizations that reached production and then rolled back.
The AGENT Framework for Identity Management
Attestation (Unique Identity): Every agent gets a cryptographically verifiable identity tied to a human owner. The SPIFFE open standard, issuing SVIDs via X.509 certificates, is the current implementation baseline for production-grade deployments.
Grant (Credentialing): Long-lived static secrets are eliminated. Credentials become just-in-time and short-lived, using OAuth 2.0 Token Exchange (RFC 8693). The agent carries an act claim identifying itself, while the subject_token identifies the user it’s acting on behalf of.
Enclosure (Sandboxing): Agents run inside sandboxes with explicit tool allow-lists and network egress controls, preventing calls to external endpoints or destructive commands on production infrastructure.
Notarization (Attributability): Every agent action is logged in a tamper-evident record identifying the user, the agent, the tool used, and the data returned. This is mandatory for ISO 42001 and HIPAA compliance chains.
Termination (Deprovisioning): An automated deprovisioning trigger must exist for retired agents, preventing “zombie identities” from persisting and accumulating access rights the organization never intended to maintain.
The OWASP Agentic Top 10 (2026)
Developed by over 100 security experts, the OWASP Agentic Top 10 categorizes vulnerability patterns specific to autonomous systems, risks that don’t appear on traditional OWASP lists because they require autonomous action to materialize.
Risk Code
Risk Name
Attack Pattern
ASI01
Agent Goal Hijack
Malicious instructions in external data rewrite the agent’s objective mid-task
ASI02
Tool Misuse
Legitimate tools used for unintended, destructive operations
ASI03
Identity & Privilege Abuse
Over-privileged agents access resources beyond their intended scope
ASI04
Agentic Supply Chain
Integrated plugins or MCP servers contain malicious code
ASI05
Unexpected Code Execution
AI-generated code escapes the sandbox and runs arbitrary commands
ASI06
Memory/Context Poisoning
Contaminated RAG databases bias all subsequent agent decisions
ASI07
Insecure Inter-Agent Comm
Impersonation or message tampering between agents in a multi-agent system
ASI08
Cascading Failures
Errors in upstream agents propagate and escalate through downstream agents
The NIST AI RMF Agentic Profile, released in early 2026, explicitly draws the critical line: generative AI risks focus on content, what the AI says. Agentic risks focus on action, what the AI does and what it modifies in production systems. That distinction changes every governance decision downstream, and teams applying only a generative AI risk posture to agentic deployments are systematically underprotected from day one.
Stage 4 — Feedback loops: how to iterate after deployment
Deployment is not the finish line. It’s the start of a data collection phase that determines whether an agent gets measurably better or quietly degrades. Successful deployments move from “human-in-the-loop” (HITL), where humans approve each individual action, to “human-on-the-loop” (HOTL), where agents self-correct from outcomes and humans monitor at the system level rather than the task level.
Reinforcement Learning from Human Feedback in Production
RLHF remains the primary mechanism for aligning agent behavior with real-world preferences after deployment. In production agentic systems, it runs across four phases. Supervised fine-tuning establishes the format of correct responses from human-written examples. Reward model training translates human preference ratings into a predictive quality model. Policy optimization, typically using Proximal Policy Optimization, lets the agent practice tasks and learn from scored outcomes. KL constraints prevent “reward hacking,” where agents find shortcuts to high scores that don’t reflect genuine improvement.
The formal optimization objective is: J(φ) = E[r_θ(x,y)] − β · D_KL(π_φ || π_ref), where the agent policy is optimized against a reward model while a KL divergence penalty prevents the policy from drifting too far from coherent baseline behavior. The β coefficient is a tunable control parameter, and calibrating it incorrectly in either direction produces either stagnation or reward hacking behavior that’s difficult to detect without explicit monitoring.
Continuous Monitoring as Governance Infrastructure
Governance in agentic systems isn’t a one-time compliance checklist. It’s a real-time monitoring loop covering three signal types: performance metrics (latency, error rates, task completion deltas across model versions), budget thresholds (to catch runaway execution loops before costs escalate to board-level visibility), and security events (guardrail violations, unusual tool call patterns suggesting prompt injection). Organizations that assign monitoring ownership before a production incident occurs see significantly lower failure rates. Those that treat post-incident ownership as a discovery process don’t get a second chance at stakeholder trust.
“We have moved past the initial phase of discovery and are entering a phase of widespread diffusion. We need to evolve from models to systems when it comes to deploying AI for real-world impact.”
Satya Nadella, CEO, Microsoft — Dwarkesh Podcast: How Microsoft is Preparing for AGI
ROI benchmarks: what success looks like in year 1
Only 41% of agent rollouts cross positive ROI within 12 months. But for organizations that get the architecture right, the productivity gains in specific departments aren’t marginal, they’re structural changes to how work gets done. The median payback period across all sectors is 6.7 months, with customer service achieving payback in 4.1 months and legal trailing at 14.8 months due to mandatory attorney review requirements on every output.
Department
Hours Saved / Week
Productivity Multiplier
Primary Use Case
Customer Service
8.7
4.2x
Tier-1 ticket resolution without escalation
Software Engineering
11.3
3.6x
Code review automation and test generation
Marketing Operations
6.1
3.1x
Brief generation and copy production
Sales Development
5.4
2.7x
Lead research and outreach personalization
Finance & Accounting
3.8
2.4x
Reporting automation and reconciliation
IT Helpdesk
5.9
2.2x
Ticket triage and password reset workflows
Human Resources
4.6
2.0x
Resume screening and job description drafts
Legal
2.9
1.4x
Contract redline assistance
Production-Grade Enterprise Deployments
The economic argument has moved past vendor benchmarks into telemetry-grade production data. Klarna replaced the equivalent workload of 853 full-time employees with a single customer service agent, reporting $60 million in savings by Q3 2025. JPMorgan Chase runs over 450 agentic AI use cases daily, including the COiN contract intelligence system and DevGen.AI for legacy code modernization at scale. Walmart deployed an autonomous inventory and demand planning agent across 4,700 stores, making replenishment decisions without human approval loops in the process. General Mills runs an AI supply chain optimization system assessing over 5,000 daily shipments and has reported more than $20 million in savings since 2024.
The pattern across these deployments is consistent. Each organization treated agent deployment as an architecture project, not a model selection exercise. The identity layer was built before the first agent went live. Data readiness was established before the first line of agentic code was written. Observability infrastructure was deployed before production traffic arrived. That sequence is the 4-stage fix in practice, applied by organizations that now sit in the 11%.
For CTOs evaluating AI agent governance frameworks or architects planning the shift to event-driven architecture, the infrastructure investment required is significant. Teams managing non-human identity at scale should evaluate how SPIFFE and short-lived credential standards align with existing zero-trust network policies before the first agent goes live, not after the first incident.
What to Watch
01
Gartner predicts 40% of enterprise applications will embed task-specific agents by 2027. Watch for Q3 2026 earnings calls where CIOs are now expected to report on agentic AI ROI, not pilots. Organizations that can’t demonstrate P&L impact by then face board-level pressure to consolidate or exit the space entirely.
02
The NIST AI RMF Agentic Profile released in early 2026 is moving from advisory to contractual. Federal procurement contracts expected in H2 2026 will require documented delegation chain accountability and autonomy tier classification. Enterprise vendors supplying AI agents to government clients should treat compliance as an H2 2026 deadline, not a future roadmap consideration.
03
The “RAG Spray” attack vector, first documented as a 2026 threat pattern, has no widely deployed defense at production scale. Watch for security vendors releasing vector-space integrity tools in Q4 2026. Organizations running production RAG pipelines without chunk-level provenance tracking are exposed now, not at some future threat horizon.
Frequently Asked Questions
Why do 89% of AI agent projects fail to reach production in 2026?
The failure is primarily organizational and architectural rather than technical. The three dominant causes are legacy system integration challenges (cited by 46% of enterprises), insufficient data readiness driving 60% of Gartner-tracked project abandonment, and the absence of formal agent identity governance, only 23% of enterprises currently have a strategy for this. Projects that address all three reach production. Projects that skip any one of them statistically don’t.
What is the polling tax in AI agent architecture and why does it kill production deployments?
The polling tax is the compounding performance and financial cost that accumulates when agents must constantly query traditional APIs for status updates rather than reacting to events in real time. In a 12-step agentic workflow, compute and egress costs from continuous polling can exceed the cost of the AI model itself. Organizations that don’t migrate to event-driven architectures find their agents too slow and too expensive to justify at production scale, even when the model performs correctly.
What is a Shadow Agent and what security risks does it create for enterprise deployments?
A Shadow Agent is an autonomous AI agent deployed by an internal team without oversight from central IT or security. These agents typically use shared human credentials, lack individual identity records, and generate no audit trail. When a Shadow Agent causes a production incident, there’s no attribution path, making incident response and compliance reporting impossible. They also accumulate access rights over time, creating a privilege escalation exposure that grows silently until it’s exploited or discovered in an audit.
How does the NIST AI Risk Management Framework apply specifically to agentic AI deployments?
The NIST AI RMF’s four core functions, Govern, Map, Measure, and Manage — apply to agentic systems, but the 2026 Agentic Profile extends this to cover autonomy tiers, behavioral governance, and delegation chain accountability. The critical distinction the profile draws is that generative AI risk centers on content (what the model says), while agentic risk centers on action (what the agent does and what it modifies in production systems). Teams applying only a generative AI risk posture to agentic deployments are systematically underprotected from day one.
What is the median payback period for enterprise AI agents in 2026?
The median payback period is 6.7 months across all sectors. Customer service deployments are the fastest at 4.1 months, driven by high autonomous resolution rates that reduce the “review burden.” Legal deployments are the slowest at 14.8 months because attorneys must review every output for liability exposure, capping the productivity multiplier at 1.4x regardless of the agent’s technical accuracy. The review burden, not the model capability, determines the ROI timeline in professional services functions.
What is the difference between human-in-the-loop and human-on-the-loop for production AI agents?
Human-in-the-loop means a human approves or reviews each individual agent action before it executes, appropriate for high-stakes or early-stage deployments where grounding accuracy hasn’t yet been validated. Human-on-the-loop means the agent executes autonomously and self-corrects from outcomes, while humans monitor at the system level rather than the task level. Staying in HITL at scale eliminates most of the cost-per-task reduction that makes agentic AI economically viable, so the migration to HOTL is a required step for any deployment targeting the standard 4–9 month payback window.
How do you prevent silent regressions from destroying a production AI agent deployment?
Silent regressions require two distinct safeguards. First, structured evaluation harnesses that run regression test suites against representative task samples on every model or prompt change, before that change reaches production traffic. Second, distributed tracing that captures the full decision path for each agent action, enabling engineers to reconstruct exactly where a failure originated without weeks of manual investigation. Organizations deploying both see dramatically lower rates of undetected regression in production, and dramatically higher stakeholder confidence when incidents do occur.
When should an enterprise terminate an AI agent pilot instead of continuing to invest in it?
The 90-day decision gate is the validated standard. At the end of 12 weeks, a pilot must demonstrate a task completion rate of at least 90%, grounding accuracy of at least 95%, and a clear path to 9x or greater cost-per-task reduction vs. the human-handled baseline. If any threshold isn’t reachable with the current architecture and data setup, the pilot should be terminated or fundamentally redesigned — not re-resourced. Successful organizations treat a 12-week termination as high-value discipline. Projects that don’t meet the gate and continue anyway statistically never reach production.
Stay ahead of enterprise technology.
NeuralWired delivers weekly intelligence for CTOs, CISOs, and AI leads — no noise, no filler.
Irfan Malik on Why AI Won’t Replace Your Best Engineers — NeuralWired
AI & WorkforceMay 13, 2026 · NeuralWired Staff
Irfan Malik Says Stop Choosing Between AI and People | Here’s Why the Data Backs Him Up
Tech entrepreneur and AI strategist Irfan Malik has been making the case for a hybrid workforce model at a moment when enterprise leaders are being forced to pick a side. With real productivity gains stuck at roughly 10% despite massive AI investment, the math is starting to align with his argument.
The pitch from AI vendors has always sounded compelling. Replace expensive engineers with automated tools. Cut hiring budgets. Let the models do the work. But the actual numbers trickling out of enterprise deployments in 2026 tell a more complicated story, one that Irfan Malik, CEO of Xeven Solutions, has been anticipating for a while. He argues that companies fixated on AI as a headcount substitute are solving the wrong problem entirely.
Malik’s framework, built around applying advanced technologies to real-world challenges with skilled human oversight, isn’t contrarian for its own sake. It’s a response to a clear pattern: enterprises that pour capital into AI tooling without investing equally in the people operating those tools tend to see modest returns, diffuse accountability, and eroded team trust. The data, from McKinsey to independent engineering research, is starting to confirm that view.
The 10x Productivity Lie That’s Driving Boardroom Decisions
Somewhere between the demo and the deployment, something gets lost. AI vendors have consistently framed their tools in terms of order-of-magnitude productivity improvements. The phrase “10x engineer” entered the lexicon and never really left. Boards heard it, allocated accordingly, and in many cases began trimming headcount on the assumption that fewer people could now do exponentially more work.
The reality, measured carefully, is far more modest. A longitudinal study by DX covering November 2024 through February 2026 tracked AI adoption across engineering teams and found that a 65% increase in AI tool usage translated to a pull request throughput gain of just under 10%, roughly 9.97%, with the typical range landing between 8% and 12%. That’s meaningful. It’s not nothing. But it is emphatically not 10x.
Key figure: AI tool usage in software engineering rose 65% between late 2024 and early 2026. Pull request throughput, the actual measurable output, increased by 9.97%. The gap between adoption rate and productivity gain tells the whole story.
The McKinsey data is sharper still. The firm’s December 2025 State of AI survey found that while 88% of enterprises now use AI in at least one business function, only 6% qualify as high performers, defined as achieving a 5% or greater improvement in earnings before interest and taxes attributable to AI. The rest are spending real money for sub-threshold results. Only 6 out of every 100 companies are extracting the kind of value the boardroom was promised.
“Only one in 50 AI investments deliver transformational value, and only one in five delivers any measurable return.”
Gartner Analyst, via Harvard Business Review, February 2026
Those are brutal numbers. And they create a specific kind of organizational trap: companies that have already reduced headcount in anticipation of AI gains they haven’t actually achieved yet, now operating with fewer people and tools that are underperforming expectations. Recovering from that position is expensive, slow, and damaging to morale.
Why Irfan Malik’s Hybrid Model Is Gaining Traction Now
Malik’s position at Xeven Skills and Xeven Solutions places him at the intersection of enterprise AI deployment and workforce development. That vantage point shapes a philosophy that’s straightforward to state and genuinely difficult to execute: build AI systems that scale, then make sure skilled humans are the ones running them. The word “hybrid” gets used loosely in this industry, but Malik applies it precisely, not as a compromise position but as a structural requirement for any AI deployment that needs to handle novel problems, ethical trade-offs, or contextual judgment.
His argument resonates because it maps onto observable failure patterns. When AI tools operate without adequate human oversight, three things tend to happen. Hallucinations go uncorrected. Edge cases get mishandled. And when things go wrong, accountability diffuses across a system that nobody fully controls or owns. These aren’t theoretical risks. They’re the documented experience of enterprises that moved too fast toward automation without maintaining the human layer that catches what the model misses.
Malik’s core thesis: AI’s value ceiling is determined by the quality of the humans working with it. The firms seeing real returns aren’t the ones who replaced their teams, they’re the ones who trained their teams to operate AI effectively at scale.
This framing also addresses something the pure-automation argument tends to skip over: the nature of the tasks that actually drive competitive advantage. Large language models perform well on well-defined, repeatable tasks with clear success criteria. They perform poorly on novel logic, system-level reasoning, and anything requiring genuine ethical judgment. The work that creates strategic differentiation tends to fall into that second category. You can’t automate your way to a better product vision.
“To strike the balance between AI tools and human talent, L&D can lead the transformation by putting people first.”
Peter Hirst, Senior Associate Dean, MIT Sloan School of Management, via HR Dive
What the Deployment Data Actually Says About AI Limits
AI tools are, at their core, probabilistic engines trained on historical data. They predict outputs with reasonably high accuracy for well-structured tasks, somewhere in the 80-90% range for simple, repeatable work. That accuracy degrades meaningfully when problems require contextual reasoning outside the training distribution, multi-step logical chains with real-world dependencies, or outputs where being confidently wrong carries operational consequences.
The DX data makes this concrete. Engineering teams using AI coding assistants saw throughput improvements, yes. But the gains concentrated in low-complexity tasks: boilerplate generation, documentation, syntax corrections. The high-value work, architecture decisions, security reviews, debugging novel failure modes, remained stubbornly resistant to automation. The humans didn’t disappear from the workflow. They shifted toward the harder end of it.
Google’s approach illustrates what responsible scaling looks like in practice. Rather than treating AI as a headcount replacement, the company has deployed it to reduce time spent on routine HR and operational processes, freeing human capacity for work requiring judgment and relationship management.
“We always keep humans in the loop. AI supports deeper, more connected leader-employee relationships rather than replacing them.”
Arnish, Google Cloud HR, via Complete AI Training, July 2025
The governance gap is a significant factor here too. McKinsey’s data attributes a substantial portion of the performance gap between high and low AI performers to data quality issues and absent governance frameworks. AI tools are only as reliable as the systems they operate within. Companies that haven’t built those systems, data pipelines, oversight protocols, escalation paths, are deploying powerful tools without the infrastructure to catch their failures. That’s a human problem, not a technical one.
The Cost Calculus: AI Tools vs. Hiring Humans
The financial argument for AI-first hiring strategies has real substance, and it would be dishonest to dismiss it. Research from Appliview published in April 2025 found that AI-assisted recruitment reduces hiring costs by 20% to 50% compared to traditional methods, against a baseline average of $4,700 per hire. For organizations with high hiring volume, that’s a genuine budget line item worth optimizing.
The complication is in the ROI timeline. AI tooling has upfront licensing costs, integration costs, and the often-underestimated cost of retraining and governance infrastructure. When those are factored in alongside the modest productivity gains the DX data documents, the financial case for wholesale human replacement weakens substantially. The 6% high-performer rate from McKinsey suggests that most companies aren’t reaching the returns that would justify that trade-off.
Dimension
AI-Only Approach
Human-Only Approach
Irfan Malik’s Hybrid Model
Upfront Cost
High (licensing, integration, governance)
High (salaries, benefits, recruitment)
Moderate (tooling + targeted hiring)
Productivity Gains
8-12% on routine tasks; near zero on complex work
Baseline; no amplification
10%+ on routine + human advantage on complex tasks
Scalability
High for defined, repeatable tasks
Limited by headcount
High; humans govern AI scale
Novel Problem Handling
Poor; hallucination and context loss
Strong
Strong; AI handles load, humans handle edge cases
Accountability
Diffuse; error attribution unclear
Clear
Clear; human oversight layer preserved
Long-term ROI
Uncertain; only 6% of firms hit 5%+ EBIT impact
Predictable but ceiling-limited
250% ROI in 18 months when training investment is included
The Jobs Picture in 2026: Growth, Not Replacement
The workforce displacement narrative has been loud. It’s also, at the aggregate level, not yet supported by the employment data. CompTIA’s 2026 State of the Tech Workforce report projects 1.9% growth in US tech employment this year, adding approximately 185,000 net new jobs to bring the sector total to 9.8 million. More than 275,000 job postings as of January 2026 explicitly require AI skills. The labor market isn’t contracting. It’s recomposing.
That recomposition matters for how companies think about their talent strategy. The skills in demand are shifting fast. Roles requiring AI fluency, prompt engineering, model oversight, and AI-augmented analysis are growing. Roles focused on purely manual, rule-based work are shrinking. The companies navigating this well are the ones building internal training programs that move existing employees into the new skill areas, rather than replacing them outright.
📈
Tech Job Growth
1.9% sector expansion in 2026; 185,000 net new jobs projected by CompTIA.
🤖
AI Skills in Demand
Over 275,000 job postings in January 2026 explicitly required AI competency.
⚠️
Displacement Risk
32% of companies plan workforce reductions of 3%+ in the next 12 months, per McKinsey.
📊
Data Science Growth
Data science roles projected to grow 420% by 2036 as AI demands analytical oversight.
The concerning number is the 32% of companies planning workforce reductions of 3% or more over the next year, also from McKinsey. That’s a meaningful portion of the market making cuts, potentially before the AI tools intended to replace that capacity are delivering reliably. If the DX and Gartner data on actual productivity gains holds, some of those organizations are going to find themselves understaffed for the complex work AI can’t handle, with tools that are producing roughly a 10% throughput improvement in the domains where they work at all.
The Training ROI Case That Most CFOs Haven’t Seen
There’s a number that should be in every workforce planning conversation but rarely is: companies that invest in AI training programs for their existing employees report a 250% return on that investment within 18 months. That figure, drawn from corporate training research, reframes the entire build-or-buy question. The calculus isn’t “AI tools versus headcount.” It’s “AI tools plus trained people versus AI tools alone.”
The training gap is real and measurable. Surveys across the MENA region found 30% of employees reporting that their employers had made little to no investment in AI-related upskilling. That’s not a technology problem. It’s a management priority problem. Organizations that treat AI deployment as a capital expenditure question without an accompanying talent development budget are leaving most of the available value on the table.
Malik’s work through Xeven Skills addresses this directly. The argument isn’t that AI is overhyped, it’s that the returns accrue to organizations that invest in people capable of directing, correcting, and extending what the tools do. That’s a more demanding operating model than simple automation, but the performance data suggests it’s the one that actually produces the returns the boardroom wants.
Frequently Asked Questions
Should companies invest more in AI tools or in hiring right now?
The McKinsey data suggests neither in isolation is sufficient. With 88% of enterprises already using AI but only 6% achieving high performance, the bottleneck isn’t access to tools, it’s the capability to operate them well. Companies that prioritize upskilling existing talent while selectively adopting AI tools see better outcomes than those treating the two as substitutes.
Will AI actually replace tech jobs at scale?
CompTIA’s 2026 data projects net growth of 185,000 tech jobs this year. The composition is shifting, AI-fluent roles are expanding rapidly while purely manual roles contract. Mass replacement isn’t happening; redistribution is. The 32% of companies planning cuts, however, signals real risk for specific roles and sectors.
What are realistic AI productivity gains for engineering teams?
DX’s longitudinal study covering late 2024 through early 2026 found gains of 8% to 12% in pull request throughput among engineering teams with 65% AI tool adoption. That’s a real improvement, concentrated in routine tasks. Complex work, architecture, security, novel debugging, showed minimal automation benefit.
What does a good AI training program for employees look like?
Effective programs combine structured learning with practical application: peer sessions where teams work through real AI-assisted workflows, clear escalation protocols for when human judgment is required, and ongoing feedback loops that measure actual output quality rather than just tool usage. Organizations tracking this carefully report 250% ROI within 18 months.
Who is Irfan Malik and why does his perspective matter here?
Irfan Malik is the CEO of Xeven Solutions and the founder of Xeven Skills, focused on applying advanced technologies to real-world enterprise challenges with human oversight at the center. His hybrid model, scale AI with skilled teams rather than replace skilled teams with AI, is gaining traction precisely because the enterprise performance data from 2025 and 2026 aligns with its core predictions.
What to Watch: Irfan Malik and the Hybrid Model’s Next Test
NeuralWired Signals
01Agentic AI pilots in 2026: The next wave of enterprise AI involves autonomous agents running multi-step workflows. How organizations structure human oversight for these systems will determine whether the 6% high-performer rate improves or contracts further.
02The 32% workforce reduction cohort: McKinsey flagged that nearly a third of companies plan significant cuts. Tracking their AI performance 12 months out will test whether the automation-first playbook actually delivers, or leaves them unable to handle the work AI can’t do.
03Irfan Malik’s scaling thesis: As Xeven Solutions and Xeven Skills expand, their performance data will offer one of the cleaner real-world tests of whether the hybrid model at scale delivers the returns the 250% training ROI figure suggests it should.
04Governance as the differentiator: McKinsey’s high-performer cohort consistently cited data quality and governance infrastructure as separating factors. Watch for governance tooling to become its own competitive category as enterprises realize the human oversight layer needs its own stack.
The debate over AI versus human talent has been framed as a zero-sum choice by people who have an interest in selling tools or in appearing decisive. The deployment evidence from 2025 and 2026 suggests it was never that simple. Productivity gains are real but modest. Transformation is rare. The companies that are getting serious returns, that 6%, are doing so by building capable human teams who know how to direct AI effectively, not by ceding that capability to the tools themselves.
Irfan Malik has been making this argument before the performance data caught up to it. Now the data is here. Whether the industry adjusts its expectations accordingly, or continues chasing the 10x number that hasn’t materialized, is the defining workforce question of the next two years.
Stay ahead of the AI workforce shift.
NeuralWired covers enterprise AI performance, workforce strategy, and the real numbers behind the hype, every week.
Trump’s UFO Files: Inside the PURSUE Initiative, the Gremlin Sensor, and the Missing Scientists Conspiracy | NeuralWired
National SecurityMay 10, 2026 | NeuralWired Staff
Trump Opens the UFO Files: Inside PURSUE, the Gremlin Sensor, and a Disclosure That Raises More Questions Than It Answers
President Donald Trump’s Department of War dropped 162 declassified UAP files on May 8. The real story isn’t alien contact. It’s a calculated shift in military posture, an AI-era sensor network, and a missing general whose disappearance has rattled Capitol Hill.
Friday morning, May 8, 2026. The war.gov/UFO portal went live and promptly buckled under traffic. Inside: 162 never-before-released government records on Unidentified Anomalous Phenomena, spanning FBI case files, NASA mission transcripts, and infrared footage that military pilots still cannot explain. Donald Trump had promised this. He delivered it. And almost immediately, the gap between what the files contain and what the public was hoping to find became the story.
No confirmed alien contact. No recovered spacecraft. What the initial tranche does provide is something more consequential for national security professionals and aerospace engineers: an official admission, for the first time at this scale, that a class of phenomena exists in American airspace that the U.S. government cannot identify, cannot explain, and cannot currently counter. That’s a different kind of bombshell.
The PURSUE Launch: What Dropped on May 8
The Department of War’s official press release described PURSUE as “the Presidential Unsealing and Reporting System for UAP Encounters,” an interagency effort coordinated across the White House, the Office of the Director of National Intelligence, NASA, the FBI, the Department of Energy, and the All-domain Anomaly Resolution Office (AARO). The initial release included PDFs, images, and videos. Additional tranches will follow on a rolling basis, published to the same public portal with no security clearance required.
The structure mirrors, deliberately, the DOJ’s approach to the Epstein files release in late 2025. Drip-feed transparency. Controlled information flow. Each tranche generating its own news cycle.
Editorial note on file counts: Different sources cite slightly different totals. The Department of War’s official release described the tranche as including PDFs, videos, and images. An independent mirror archived on GitHub counted 132 files totaling approximately 2.4 GB and 4,157 PDF pages. The official “162 files” figure cited by the administration appears to include video and image assets counted individually. NeuralWired uses the administration’s stated figure throughout.
DNI Tulsi Gabbard framed it as a commitment to “maximum transparency,” noting that the Intelligence Community was coordinating declassification efforts with the Department of War for a “careful, comprehensive, and unprecedented review.” Secretary of War Pete Hegseth had publicly reaffirmed that promise as recently as early 2026, as AARO’s caseload surpassed 2,000 reports.
“The American people can now access the federal government’s declassified UAP files instantly. The latest UAP videos, photos, and original source documents from across the entire United States government are all in one place. No clearance required.”
Pentagon Public Affairs Statement, May 8, 2026
Trump’s Department of War: Why the Rebrand Changes Everything for UAP
The renaming of the Department of Defense to the Department of War on November 13, 2025, wasn’t cosmetic. Trump and Hegseth argued the “Defense” label had locked the military into a reactive posture for decades. “War” signaled intent. The rebrand, estimated by the Pentagon to cost $52.5 million and potentially reaching $125 million according to Congressional Budget Office projections, involved shifting the primary public web infrastructure from defense.gov to war.gov and overhauling branding across every support agency.
For UAP specifically, the institutional shift mattered. Under the old DoD framing, unexplained aerial encounters were logged, filed, and periodically reviewed. Under the DOW, they’re treated as unauthorized penetrations of sovereign airspace requiring active tracking, identification, and potential interdiction. The bureaucratic language changed. So did the resource allocation.
Administrative Detail
Specifics
Initiative Name
PURSUE (Presidential Unsealing and Reporting System for UAP Encounters)
Primary Agency
Department of War (DOW), formerly DoD
Leading Official
Secretary Pete Hegseth (Secretary of War)
Public Portal
war.gov/UFO
Interagency Partners
ODNI, NASA, FBI, DOE, State Department
Rebrand Cost Estimate
$52.5M (Pentagon) to $125M (CBO)
Legal Basis
Executive Order; UAP Disclosure Act of 2025/2026
Release Cadence
Rolling tranches, no fixed schedule announced
What the Files Actually Show: Lunar Anomalies, Bronze Ellipsoids, and “Orbs Launching Orbs”
Strip away the hype. Here’s what the verified records contain.
The FBI’s Bronze Ellipsoid
One of the most discussed documents in the release is a composite sketch and associated case notes from FBI file 62-HQ-83894, covering a September 2023 encounter in the western United States. Federal special agents documented an ellipsoid metallic object they estimated to be between 130 and 195 feet in length. The object didn’t move conventionally. Witness accounts describe it appearing out of a bright light and vanishing instantaneously. The case remains unresolved. The FBI file also includes previously redacted material showing that metallic spheres and disc-shaped objects have been subjects of internal FBI investigation going back to at least 1947.
Trained federal law enforcement personnel, not hobbyist skywatchers, produced this documentation. That provenance matters when evaluating it against “explainable” baselines.
Apollo 12 and Apollo 17: The Lunar Cases
The PURSUE tranche pulled historical NASA mission archives into the disclosure for the first time at this scale. Transcripts and photographs from the Apollo 12 and Apollo 17 missions include astronaut observations that, at the time, were classified or quietly filed away. Apollo 17 imagery from December 1972 includes three unidentified dots in a triangular formation in the lunar sky. During that same mission, geologist-astronaut Jack Schmitt reported a flash on the lunar surface north of the Grimaldi crater. Apollo 12 still photos show unidentified phenomena near the horizon.
The PURSUE release frames these not as confirmed anomalies but as historical data points in the broader “unresolved” category. The government is not claiming the Moon has visitors. It is acknowledging that its own astronauts saw things they couldn’t explain, and that those observations deserve scientific re-examination rather than continued classification.
The Indo-Pacific and “Eye of Sauron” Encounters
More recent cases in the tranche include a 2024 SWIR (short-wave infrared) capture of a diamond-shaped object near Greece moving at approximately 434 knots, invisible to standard radar. A separate report covers a football-shaped object observed by U.S. Indo-Pacific Command near Japan. A 2023 Western U.S. case documents what field agents described as orb-shaped objects that appeared to launch smaller orbs.
An important caveat: Analysts, including researchers at The War Zone, have noted that at least some UAP imagery in the PURSUE archive may reflect sensor artifacts rather than anomalous objects. The “football-shaped” object near Japan, for example, may be a known FLIR lens flare effect when a bright object is captured with the video feed inverted. AARO acknowledges that most historical cases, if properly documented, would likely resolve as mundane. The “unresolved” label doesn’t automatically mean “inexplicable.”
Location
Date
Agency
Description
Apollo 12 Lunar Orbit
Nov 1969
NASA
Unidentified phenomena in still photos near lunar horizon
Apollo 17 Lunar Surface
Dec 1972
NASA
Triangular dot formation; surface flash north of Grimaldi crater
Western USA
Sep 2023
FBI
130-195 ft bronze ellipsoid; instantaneous appearance and disappearance
Western USA
2023
DOW/AARO
“Eye of Sauron” orbs; smaller orbs launched from primary object
Greece
2024
DOW/AARO
Diamond-shaped UAP at 434 knots; SWIR-only detection
East China Sea (near Japan)
2024
INDOPACOM
Football-shaped object; possible FLIR artifact under investigation
Trump’s Department of War Deploys Gremlin: The Real Infrastructure Story
While most coverage fixated on the alien question, the more consequential development in the May 8 release is the confirmed deployment of the Gremlin sensor architecture. This is where the story shifts from the past to the present.
Gremlin was developed by the Georgia Tech Research Institute specifically for AARO’s UAP detection mission. It’s a deployable, reconfigurable sensor suite that can be packed into Pelican cases and brought to any site of interest. The system integrates multiple sensing modalities simultaneously to ensure no single sensor artifact can be misread as an anomaly.
According to the AARO FY24 annual report, Gremlin completed a successful data collection test in March 2024. The system was then deployed for a 90-day “pattern of life” collection at an undisclosed national security site, with AARO Director Jon Kosloski declining to identify the location publicly to preserve collection integrity.
How Gremlin Works
📡
2D / 3D Radar
Measures range, azimuth, and elevation. 3D radar provides full positional triangulation unavailable with standard 2D systems.
🔭
Electro-Optical / IR
Long-range cameras plus short-wave and thermal infrared. Captures objects invisible to the naked eye or standard optics.
📻
RF Spectrum Monitor
Detects electronic emissions and potential jamming signals from unidentified objects entering monitored airspace.
✈️
ADS-B / Aviation Tracking
Cross-references commercial and civil aircraft transponder data, automatically filtering known traffic from anomalous tracks.
The core mission of Gremlin isn’t just to capture UAPs. It’s to establish what “normal” looks like at a given site so that deviations become immediately identifiable. Think of it as baselining. Once the system knows every satellite pass, every commercial flight corridor, every weather balloon trajectory in its field of view, the signal-to-noise ratio for genuine anomalies collapses dramatically. That’s precisely the data deficit AARO has cited as the reason so many historical cases remain unresolved: the witnesses were real, but the sensor data wasn’t there.
“Although many UAP reports remain unsolved or unidentified, AARO assesses that if more and better quality data were available, most of these cases also could be identified and resolved as ordinary objects or phenomena.”
AARO FY24 Consolidated Annual Report on UAP, U.S. Department of Defense, November 2024
AARO by the Numbers: What’s Actually Being Seen
The statistical picture from AARO’s caseload corrects several popular assumptions about UAP morphology. The flying saucer trope is a relic. Modern reports skew heavily toward spherical objects and lights.
Shape Category
Count
% of Reports
Orb / Round / Sphere
214
39.7%
Lights (unspecified)
174
32.3%
Cylinder
35
6.5%
Oval
23
4.3%
Triangle / Delta
22
4.1%
Disk
9
1.7%
Tic Tac
8
1.5%
Square / Polygon
17
3.2%
Other / Unspecified
34
6.3%
When resolved, the overwhelming majority of cases have entirely mundane origins. Balloons alone account for more than half of all closed files. The data matters because it underscores why Gremlin’s baselining approach is the right engineering solution. The system’s job is filtering this ocean of known objects so analysts can focus only on cases that genuinely cannot be explained.
Resolved Category
Count
% of Resolved Cases
Balloons
510
52.1%
Satellites
314
32.1%
Unmanned Aerial Systems (UAS)
76
7.8%
Birds
28
2.9%
Aircraft
20
2.0%
Jetpack
15
1.5%
Missile / Rocket
9
0.9%
Sensor Artifact / Other
13
1.3%
The UAP Disclosure Act: Congress Wants Control
The executive branch is leading PURSUE. But Congress has been running a parallel track. Representative Eric Burlison introduced the UAP Disclosure Act of 2025 as an amendment to the FY2026 National Defense Authorization Act, modeled on the JFK Assassination Records Collection Act. The goal is to make declassification procedurally mandatory rather than discretionary.
Key provisions include the creation of an independent nine-member review board, confirmed by the Senate, to oversee releases no single agency can block. A “25-year rule” would require full public disclosure of all UAP records within a quarter-century of their creation, with presidential certification required for any extension. The National Archives would establish a centralized UAP Records Collection drawing from every relevant agency.
The most legally provocative clause: the federal government could exercise eminent domain over any recovered technologies of unknown origin currently held by private contractors or entities. It’s a clause that has generated significant pushback from defense industry stakeholders, and its constitutionality hasn’t been tested.
Representative Anna Paulina Luna has publicly accused the Pentagon of withholding specific UAP videos from this first PURSUE tranche. Whistleblowers before the House Oversight Committee identified 46 UAP videos they say exist but weren’t included in the May 8 release. Those files are expected in future tranches, if they exist as described.
The Missing Scientists: Conspiracy Theory Meets a Real Investigation
The UAP disclosure didn’t happen in a vacuum. Since early 2026, a separate and deeply unsettling story has been running alongside it: the deaths and disappearances of more than a dozen individuals with connections, some direct, some tenuous, to aerospace, nuclear defense, and advanced physics research.
The case that catalyzed the narrative was the February 27, 2026, disappearance of retired Air Force Major General William Neil McCasland, 68, former commander of the Air Force Research Laboratory at Wright-Patterson Air Force Base. He walked out of his Albuquerque, New Mexico home, leaving behind his phone, prescription glasses, and wearable devices. Months later, his whereabouts remain unknown. The FBI is involved.
McCasland’s name had previously appeared in 2016 WikiLeaks emails involving Tom DeLonge and John Podesta, in context suggesting he had knowledge of UAP-related programs. His wife, Susan McCasland Wilkerson, wrote publicly that since his retirement 13 years prior, he “has had only very commonly held clearances” and disputed the framing that he carried extractable secrets about extraterrestrial materials.
Other individuals frequently cited in connection with the conspiracy theory include Carl Grillmair, a Caltech astrophysicist who was shot and killed outside his California home on February 16, 2026 (a suspect was subsequently arrested and charged); Monica Jacinto Reza, a materials engineer at NASA’s Jet Propulsion Laboratory who disappeared during a hike in June 2025; and Jason Thomas, an associate director at pharmaceutical company Novartis whose body was recovered from Lake Quannapowitt in Massachusetts in March 2026 after going missing in December 2025 with no foul play suspected.
The skeptical view: Medical sociologist Robert Bartholomew described the pattern as an example of “apophenia,” the human tendency to perceive meaningful connections in unrelated events. Journalist Ross Coulthart, while noting individual cases worth scrutiny, wrote that he is “at odds with many of my own colleagues who have been running stories suggesting there is some kind of sinister link.” Michael Shermer, editor-in-chief of Skeptic, observed that the exercise essentially involves searching any death or disappearance for any connection to military, aerospace, or defense fields, which will always yield apparent patterns in random noise.
Despite the skeptical consensus, the theory has reached the highest levels of government. FBI Director Kash Patel stated his agency is “spearheading the effort to look for connections into the missing and deceased scientists,” and said “if there’s any connections that lead to nefarious conduct or conspiracy, this FBI will make the appropriate arrest.” The House Oversight Committee requested information from multiple federal agencies. In April 2026, the FBI conclusively determined that one individual cited in the theory, Nuno Loureiro, had been murdered by a person acting alone out of personal spite, with no connection to classified programs.
The Strategic Reality: Drones, Adversaries, and the Muddled Picture
Beneath every layer of this story sits a cold strategic question that doesn’t need aliens to be alarming: what if some of these “unresolved” objects are Chinese or Russian platforms?
AARO has repeatedly noted that UAP activity clusters geographically near U.S. military installations and restricted testing ranges. A diamond-shaped object flying at 434 knots that is invisible to standard radar and detectable only on SWIR sensors is either a genuinely unexplained phenomenon or evidence that an adversary has achieved a stealth capability that renders American sensor infrastructure blind. Neither option is comfortable.
The 2023 Chinese surveillance balloon incident demonstrated how a prosaic platform, not resembling any known “threat profile,” could traverse American airspace largely undetected for days. The PURSUE initiative’s transparency play has a secondary strategic purpose: by publishing what is known, the DOW invites private-sector analysis to help distinguish familiar from genuinely anomalous. Clean the data publicly. Let the global scientific community handle attribution for known objects. Concentrate military resources on the truly unknown.
That’s not alien disclosure. That’s threat characterization under information asymmetry. And it’s a more defensible reason for releasing these files than any appeal to public curiosity.
Key Questions, Answered Directly
Does the PURSUE release confirm extraterrestrial life?
No. AARO Director Jon Kosloski has stated clearly that the office has found no “verifiable evidence of extraterrestrial beings.” The files confirm that a category of unexplained phenomena exists, not that those phenomena originate off-planet. The government’s official position: genuinely unknown, not confirmed alien.
How does Gremlin distinguish a drone from a genuine UAP?
By correlating data across multiple simultaneous sensors. A drone will typically emit radio frequency signals, appear on radar at predictable altitudes, and match known UAS performance profiles. An object that appears only on SWIR and not on radar, emits no RF signal, and demonstrates velocity or acceleration beyond known aerospace engineering represents a genuine gap. Gremlin’s multi-modal approach is designed to eliminate single-sensor artifacts before anything gets flagged as anomalous.
Is the “Missing Scientists” conspiracy credible?
The FBI is investigating it. That’s a factual statement. The expert consensus, however, is deeply skeptical. The individuals grouped together died or disappeared under widely varying circumstances across several years, with no confirmed institutional connection. One case has already been closed as an unrelated murder. The pattern may reflect confirmation bias rather than coordination.
Can private companies access the raw Gremlin data?
Not directly. AARO has not announced a mechanism for private-sector access to raw sensor output. The publicly released files contain processed records and declassified documents. The broader PURSUE initiative does, however, invite independent analysis of the publicly available materials, and the administration has framed DeepTech engagement as a policy goal.
When will the next PURSUE tranche be released?
The DOW has committed to rolling releases but hasn’t provided a fixed schedule. The Epstein files model suggests periodic drops rather than continuous availability. Whistleblowers have identified 46 specific videos they say exist but weren’t included in the May 8 release, which may indicate what the next tranche addresses.
What to Watch Next
NeuralWired Signal Tracker
01
Gremlin’s 90-day results. The pattern-of-life collection at the undisclosed national security site should produce the first high-fidelity, multi-modal UAP dataset in U.S. history. Whether AARO publishes those findings publicly or classifies them will define whether PURSUE is genuine transparency or managed perception.
02
The 46 missing videos. Whistleblowers before the House Oversight Committee have named specific UAP videos not included in the May 8 tranche. If subsequent releases include them, and if their content differs materially from what’s already public, the administration’s “maximum transparency” claim will face scrutiny.
03
The McCasland case. A retired four-star general connected to UAP investigations who walked out of his home and hasn’t been seen in months. The FBI is involved. Whatever the explanation, it isn’t yet known. When it becomes known, expect it to reshape the missing scientists narrative significantly in one direction or another.
04
The UAP Disclosure Act’s eminent domain clause. If the Act advances through the NDAA, the federal government’s claimed authority to seize recovered technologies held by private contractors will face a legal challenge that could expose how much material actually exists outside the public record.
The Trump administration has, for the first time, treated UAP transparency as a deliverable rather than a political inconvenience. The PURSUE files don’t close the book on what’s in American airspace. They open it, officially, with an asterisk: most of it is mundane, some of it is unsettling, and the government has now publicly admitted it doesn’t have all the answers. The Gremlin system is the next chapter. What it captures over the next 90 days may be more significant than anything that’s been released so far.
Stay ahead of the national security and deep tech signals that matter.
NeuralWired covers the intersection of policy, military technology, and the emerging science that drives both.
Trump Media’s $406M Bitcoin Wipeout: What the Q1 Earnings Really Mean | NeuralWired
Corporate CryptoMay 10, 2026 | 8 min read
Trump Media’s $406 Million Bitcoin Wipeout: What the Q1 Earnings Really Tell Us
Trump Media & Technology Group posted a staggering net loss last quarter on less than $900,000 in revenue. The culprit wasn’t operations. It was Bitcoin, and the Q1 2026 report is now the most vivid stress test yet of corporate crypto treasury strategy under President Donald Trump’s pro-Bitcoin agenda.
On May 8 and 9, 2026, Trump Media & Technology Group, the Nasdaq-listed parent of Truth Social, trading under the ticker DJT — disclosed a GAAP net loss of $405.9 million for Q1 2026. Revenue for the same period? Roughly $871,200. The company’s balance sheet, however, is a different story: $2.1 billion in financial assets, the vast majority of it tied up in Bitcoin and associated digital tokens. That gap between operating reality and balance-sheet ambition is exactly what Q1 2026 blew wide open.
The loss wasn’t from selling anything. No Bitcoin was moved, no coins dumped. Instead, accounting rules forced Trump Media to mark its crypto holdings to current market prices each quarter, and Bitcoin had just posted its worst quarterly decline since 2018, dropping roughly 22% between January and March. The paper hit: approximately $244 million in crypto markdowns, plus $108.2 million in equity investment losses, totaling $368.7 million in unrealized losses from financial assets alone.
This is the corporate Bitcoin playbook at full throttle, and full exposure.
The Numbers: A Q1 2026 Breakdown
To understand the scale of what happened, the figures need context side by side. Trump Media’s Q1 2026 report reads less like a media company earnings release and more like a crypto fund quarterly letter, with none of the hedging typical of a fund manager.