Strategic analysis of big tech companies: Microsoft, Google, Apple, Meta, Amazon, NVIDIA, OpenAI, and more. Enterprise moves, AI investments, and competitive intelligence decoded.
WebXR Arrives: Browser AR Cuts Retail Returns Up to 40%
Retail Technology / WebXR
WebXR Arrives: Browser AR Cuts Retail Returns Up to 40%
By NeuralWired Staff · July 11, 2026 · 9 min read
A shopper adds a $1,400 sectional to their cart, checks out, and returns it three weeks later because it’s four inches too deep for their living room. That single return costs the retailer more than the sofa’s margin. Multiply it by the roughly one in five online orders that come back, and you’re looking at the reason U.S. retailers are staring down $849.9 billion in returns for 2025 alone.
WebXR, the browser-native standard for 3D and augmented reality, just cleared a major technical milestone. On June 9, 2026, the WebXR Device API reached W3C Candidate Recommendation Draft status, the last formal checkpoint before the spec is considered finished. For retail teams, that’s the signal to stop treating browser AR as a side experiment and start treating it as infrastructure.
WebXR is a group of standards, built and maintained by W3C’s Immersive Web Working Group, that let a browser render 3D scenes to VR headsets, AR-capable phones, or a flat canvas on a normal web page. No native app. No app store review. No download friction between a shopper and a 3D model of your product.
It replaced WebVR, an earlier and more limited API that Mozilla engineer Vladimir Vukićević first proposed back in 2014. The Immersive Web Working Group formally took over in September 2018, and WebXR has been quietly maturing ever since, mostly out of the retail spotlight, while VR headsets got all the press.
That’s changing fast. Three things converged in 2026 to make WebXR commercially relevant instead of a developer curiosity: WebGPU becoming a browser baseline, the cross-vendor Interop 2026 initiative closing browser gaps, and AI-assisted 3D model generation collapsing the cost of producing a 3D asset per SKU from hundreds of dollars to something closer to automated.
The Real Numbers (And the Stat Getting Misquoted Everywhere)
A correction worth making up front. You’ll see “AR reduces returns by 94%” floating around vendor blogs and LinkedIn posts. It’s wrong, and it’s an easy mistake to trace. Shopify’s real figure, a 94% average conversion lift for merchants who add 3D content, keeps getting mashed together with a separate, unrelated stat: a roughly 40% reduction in return rates, tracked by Vertebrae before Snap Inc. acquired it. Different metrics, different mechanisms, same sentence in too many places. We’re using both numbers correctly below.
Here’s the baseline problem AR is actually solving. The average ecommerce return rate sits at 19 to 20.5% in 2026, two to three times higher than the 5 to 8.9% rate for brick-and-mortar stores. Nearly half of those returns, 45%, trace back to a size, fit, or color mismatch: the gap between what a shopper expected and what showed up in the box.
That gap is exactly what 3D and AR product views close. A shopper who can rotate a chair, see it at true scale in their own room, or check a shoe’s exact stitching before buying is a shopper who’s far less likely to send it back.
94% average conversion lift for merchants adding 3D content to product pages, per Shopify’s own changelog data.
Up to 40% reduction in return rates for AR/VR-enabled retailers, per Vertebrae/Snap Inc. research, driven by better pre-purchase understanding of size and fit.
50 to 70% lower engagement for app-download-gated experiences compared to browser-based ones, which is the core argument for building on the open web instead of a native app.
$12.09 billion to $15.29 billion: the virtual try-on market’s growth from 2025 to 2026, per The Business Research Company.
How It Works: Three Session Modes
WebXR doesn’t force every shopper into a headset. The spec defines three distinct session modes, and understanding which one your team actually needs changes your entire build plan.
Session Mode
What It Does
Hardware Needed
inline
Renders a 3D model directly into a normal page canvas
None; works on any phone or laptop browser
immersive-ar
Overlays the 3D product on the real world through a phone camera
AR-capable smartphone
immersive-vr
Full virtual environment, fully immersive
VR headset (Meta Quest 3, etc.)
The inline and phone-based immersive-ar modes are what nearly every retailer deploying this today actually uses. That’s the real substance behind the “no headset required” pitch, not marketing spin.
Who’s Already Using It
This isn’t theoretical. Furniture and home goods retailers, where size and fit questions kill conversion fastest, have moved first.
Retailer
Result
CB2
21% increase in revenue per visit, 13% lift in average order size
EQ3
36% increase in conversions, 88% increase in average order value
MADE.COM
Shoppers who viewed a 3D model were 25% more likely to buy than those who saw flat images only
Macy’s (furniture pilot)
Returns held under 2%, versus a normal 5 to 7% baseline, per BrandXR’s research
Virtual try-ons and 360-degree product demos are becoming one of the clearest ways brands can bring return rates down.
Helen Lin, Chief Digital Officer, Publicis Groupe
Ashley Crowder, co-founder and CEO of VNTANA, a 3D infrastructure platform used by VF Corp, Hugo Boss, and Diesel, has made a similar case: the retailers pulling ahead right now are the ones treating 3D asset production as core infrastructure rather than a one-off marketing project.
The Catch: iOS, Performance, and Accessibility
Every “browsers beat apps” pitch needs a reality check, and WebXR has three real ones.
The iOS gap is the biggest hole in the pitch
WebXR ships natively in Chrome, Edge, Opera, Samsung Internet, the Meta Quest Browser, and Safari on visionOS 2.0. It does not work natively on iPhone, iPad, or Mac. Because Apple requires every third-party iOS browser to run on WebKit under the hood, there’s no way for another browser engine to add WebXR support on iOS, and Apple itself hasn’t shipped it there.
Developers on Apple’s own developer forums have been blunt about it for years, arguing that Safari has fallen behind the rest of the field on this specific standard while Chrome and Samsung Internet moved ahead. It’s a fair criticism. For a Tier 1 audience skewing heavily toward iPhone, that means any WebXR strategy needs a fallback, typically Apple’s own AR Quick Look using USDZ files, rather than assuming browser AR reaches your whole customer base.
It’s still evolving, and performance still trails native
Candidate Recommendation Draft is not a finished spec. Reaching full Recommendation status requires two independent browsers to implement every feature, verified by a working test suite, and that work is still in progress. Browsers also remain largely single-threaded, so they can’t fully exploit GPU parallelism the way a native app can, which shows up as lower frame rates on complex 3D scenes.
Nobody’s solved accessibility yet
Canvas-rendered 3D scenes are effectively invisible to screen readers. There’s no standardized way yet to expose a 3D scene’s structure to assistive technology, which is a real compliance risk for any enterprise operating under EU or UK accessibility mandates.
Nidhi Singh, Returns Product Manager at Richpanel, adds a useful counterweight to the whole conversation: she argues headline return-rate percentages are actually the metric that matters least on their own. What matters more is refund rate and cost-per-return, numbers that reward digging past the marketing stat sheet.
What This Means for Your Team
If you’re an ecommerce director or VP of digital weighing whether this is worth a 2026 roadmap slot, here’s the practical shift.
The bottleneck moved. It’s no longer the AR code. It’s the 3D asset pipeline. A 500-SKU catalog needs a repeatable modeling process, not one-off freelance work per product.
Start small. Pilot with your top 10 SKUs, not the full catalog. Furniture, footwear, jewelry, and eyewear see the fastest payback because fit and scale drive the most returns in those categories.
Budget for maintenance, not just build. Plan for 15 to 25% of your initial build cost annually to keep the experience current as the spec and browsers evolve.
Plan the iOS fallback now. Don’t discover the Safari gap in a post-launch bug report.
Our read: the retailers who win here won’t be the ones with the flashiest AR demo. They’ll be the ones who quietly fixed their 3D pipeline first and let WebXR be the easy part.
FAQ
What is WebXR?
WebXR is a set of web standards for rendering 3D scenes to hardware that presents virtual worlds (VR) or overlays graphics on the real world (AR). It handles device selection, scene rendering, and motion tracking directly in the browser, with no app install required.
Does WebXR work on iPhone?
No. WebXR does not work natively on iPhone, iPad, or Mac. Only Safari on visionOS supports it, and even there the AR module isn’t fully enabled. Retailers targeting iOS-heavy markets need a fallback like Apple’s AR Quick Look.
How much does AR reduce ecommerce returns?
Retailers implementing AR and 3D product visualization commonly see up to a 40% reduction in return rates, driven by shoppers understanding size, scale, and fit before they buy, according to data from Vertebrae, now part of Snap Inc.
What is the difference between WebXR and WebVR?
WebVR was an earlier, experimental, VR-only API conceived by Mozilla in 2014. It was formally superseded by WebXR in 2018, which added AR support, broader device compatibility, and the inline, immersive-vr, and immersive-ar session modes.
What Comes Next
WebXR’s technical foundation is now settled enough for enterprise retail teams to build on with confidence, even while the spec finishes its last formal steps. Watch three things over the next 6 to 18 months: whether Apple moves on iOS WebXR support as Interop pressure builds, whether AI-generated 3D models keep collapsing asset costs enough to make full-catalog rollouts realistic instead of just top-SKU pilots, and whether accessibility standards catch up to the rendering technology.
Want the next breaking spec update before it hits the feeds?Subscribe to The Neural Loop for weekly briefings on the technology actually shaping enterprise decisions.
EU AI Act 2026: Why Explainable AI Just Became Law | NeuralWired
AI REGULATION / EXPLAINABLE AI
EU AI Act 2026: Why Explainable AI Just Became Law
Published July 9, 2026 · NeuralWired · 11 min read
Four different regulators, on four different continents of oversight, just landed on the same word in the same twelve months: explainability. Not “accuracy.” Not “fairness” in the abstract. Explainability, the specific, auditable ability to say why an AI system made the call it made.
If you run model risk at a bank, compliance at an insurer, or a clinical AI program at a hospital, that convergence is the story of your second half of 2026. The EU AI Act’s transparency rules go live August 2. The Federal Reserve rewrote its bank model guidance in April. State insurance regulators are piloting an actual examiner checklist right now. And the FDA has quietly made “how black-box is this thing” the line between an exempt tool and a regulated medical device.
None of these four rules say the same thing, cover the same companies, or run on the same clock. Treat them as one checkbox and you’ll miss the one that actually applies to you. Here’s the real map, sector by sector, plus the one credentialed voice arguing the entire premise is built on sand.
Quick answer, for the skimmers
Explainable AI (XAI) went from research niche to binding, examinable requirement across four sectors in a single year. The EU AI Act’s Article 13 transparency rules are enforceable from August 2, 2026, with penalties up to roughly €35 million or 7% of global turnover. U.S. bank regulators’ SR 26-2 (April 2026) covers traditional ML credit models at banks over $30 billion in assets, but explicitly excludes generative AI. Insurance regulators in 25+ U.S. states now require written AI transparency programs under the NAIC Model Bulletin. The FDA treats “how explainable is this model” as a deciding factor in whether a clinical AI tool needs premarket device review. Meanwhile, state-level AI consumer protection law (Colorado) is being rolled back under federal pressure, so the pattern to watch isn’t “AI regulation is coming,” it’s “sector regulators are tightening while state law loosens.”
This isn’t one law creating a moment. It’s four independent regulatory tracks arriving at the same demand within the same window: EU technology law, U.S. banking supervision, state insurance regulation, and federal medical device policy. That’s the actual news, and it’s why a compliance calendar built around a single deadline will fail you.
Each track defines “explainable” differently, covers different companies, and enforces on a different timeline. A bank that nails SR 26-2 compliance could still be exposed under the EU AI Act if it serves European customers. An insurer with a clean NAIC governance file could still fail a state-specific rule like New York’s, which goes further by requiring the state’s Department of Financial Services to be able to review vendor AI tools directly and demand audits.
The EU AI Act’s August 2 Deadline
Mark the date: August 2, 2026. That’s when Article 13 transparency obligations for high-risk AI systems become enforceable under the EU AI Act. High-risk, per Annex III, includes systems used in credit scoring, insurance pricing, and medical devices, exactly the sectors this article covers.
The requirement itself is deceptively simple to state and hard to satisfy: systems must be designed so their operation is transparent enough for deployers to interpret outputs and use them appropriately, and providers must disclose the technical characteristics needed to explain what the system produced.
Miss it, and the penalties aren’t symbolic. Non-compliant high-risk systems face fines up to roughly €35 million (about $38.5 million) or 7% of global annual turnover, whichever is higher. (Cross-check that figure against Article 99 directly before you cite it in a client memo. Secondary sources vary slightly on the exact wording.)
The catch nobody’s talking about
The European Commission’s own guidelines clarifying how to actually satisfy Article 13 were due in Q2 2026. That means companies may be asked to comply with obligations before Brussels has finished explaining what compliance requires. Fixed deadline, moving target.
SR 26-2: What the Fed Actually Changed for Banks
On April 17, 2026, the Federal Reserve, the OCC, and the FDIC jointly issued SR 26-2, replacing the 2011-era SR 11-7 as the governing model risk management framework for banks.
Here’s the nuance that most coverage is going to flatten: SR 26-2 is a narrowing, not an expansion. Traditional statistical and machine learning credit and fraud models stay fully in scope, subject to validation covering conceptual soundness, outcomes analysis, and ongoing monitoring. Generative and agentic AI models are explicitly carved out as “novel and rapidly evolving” and not yet governed by this letter.
The threshold that matters for your calendar: SR 26-2 is expected to be most relevant to banking organizations with more than $30 billion in total assets. If you’re under that line, this specific letter isn’t the one keeping you up at night.
What happens to the GenAI tools your bank is already using to draft adverse-action language or summarize override rationale? Nothing, for now. Regulators say they plan to issue a request for information addressing AI model risk more broadly, including generative and agentic AI, but that’s a future document, not a current rule. Translation: build a parallel, self-governed track for GenAI, because SR 26-2 won’t cover it and nothing else currently does either.
Insurance: The NAIC Bulletin and the 30-Day Test
The NAIC Model Bulletin on the Use of AI Systems by Insurers, adopted back in December 2023, has quietly become the operative insurance AI rule in most of the country. As of early 2026, 25 states plus Washington, D.C. have adopted it, up from just 11 states in April 2024.
The bulletin requires a written AI Systems (AIS) Program and specifically names the transparency and explainability of outcomes to the impacted consumer as a factor insurers must weigh.
The real test isn’t whether you have a policy document. It’s whether you could produce a plain-language explanation of an adverse decision, a denied claim or a rate increase, within 30 days of a hypothetical examiner request. Most insurance compliance teams haven’t actually run that drill.
That drill is about to get formalized. NAIC’s new AI Systems Evaluation Tool, an examiner questionnaire, is being piloted in 12 states from January through September 2026, with wider adoption expected at the NAIC Fall National Meeting. This is the mechanism that turns bulletin language into actual exam findings. It’s not live nationwide yet, but it’s close.
Healthcare: The FDA’s Black-Box Line
The FDA hasn’t issued one binding “XAI rule.” Instead, a stack of guidance functions like one: the June 2024 Transparency for Machine Learning-Enabled Medical Devices guiding principles, a predetermined change control plan guidance finalized in December 2024, and a lifecycle management guidance from January 2025.
For clinical decision support tools specifically, explainability has become the functional dividing line between “exempt software” and “regulated medical device.” The more black-box a CDS algorithm looks, especially when it’s AI-driven, the more likely the FDA is to pull it into premarket device review rather than let it operate as exempt clinical software.
This isn’t a hypothetical problem waiting to happen. The FDA has already authorized more than 580 AI-enabled medical device models, with roughly 400 of them aimed at helping radiologists catch things like malignant tumors or stroke signs, and a large share of those algorithms remain genuinely black-box, either because they’re proprietary or too complex to fully unpack. Explainability isn’t a future compliance category in healthcare. It’s already sitting inside hundreds of tools making live clinical calls.
Sector-by-Sector Comparison Table
Framework
Binding or Guidance
Effective Date
Who It Covers
Max Penalty
EU AI Act, Article 13
Binding law
August 2, 2026
High-risk AI: credit, insurance, medical devices
~€35M or 7% global turnover
SR 26-2 (Fed/OCC/FDIC)
Supervisory guidance
Issued April 17, 2026
Banks over $30B in assets; traditional ML models only
No fixed fine; supervisory action
NAIC AI Model Bulletin
State-adopted guidance
Adopted state-by-state since 2023
Insurers in 25 states + D.C.
Varies by state insurance code
FDA AI/SaMD Guidance
Guidance, device-triggering
Ongoing since June 2024
AI-enabled clinical decision support and diagnostics
Non-compliant device pulled from market
The Counter-Current: Colorado’s Rollback
Here’s the part of the story that complicates any tidy “regulation is coming” headline. While sector regulators tighten, state-level consumer protection AI law is being walked back, and fast.
Colorado’s SB 24-205, the most prescriptive state AI law on the books, with a duty of care against algorithmic discrimination, got repealed and replaced by SB 26-189, signed May 14, 2026. The replacement delays the effective date to January 1, 2027 and strips out the duty of care, deployer risk management programs, impact assessments, and several attorney general reporting obligations, swapping in a narrower disclosure-only regime.
That reversal didn’t happen in a vacuum. On April 9, 2026, xAI sued to block enforcement of Colorado’s law on constitutional grounds, and the Department of Justice moved to intervene on xAI’s side, the first time federal authorities have joined a suit against a state AI law. The root cause traces back to a December 11, 2025 executive order directing the FTC to determine when state AI laws requiring changes to “truthful outputs” are preempted by federal law, and Colorado was named directly.
Where to actually spend your budget
Sector prudential regulators, banking, insurance, EU technology law, FDA, are winning ground on explainability. Broad state consumer-protection AI law is losing ground fast. If you’re deciding where to put compliance headcount this year, follow the sector regulator, not the state legislative headline.
The Contrarian Case: Cynthia Rudin
Every regulation covered above assumes the same underlying premise: that a black-box model can be explained well enough, after the fact, to satisfy a regulator or a consumer. Dr. Cynthia Rudin, Duke University’s Interpretable Machine Learning Lab director and a 2025 ACM Fellow, has spent a decade arguing that premise is wrong.
“You can’t have accountability without transparency.”
Dr. Cynthia Rudin, Professor of Computer Science, Duke University
Rudin’s argument, laid out in her widely cited 2019 Nature Machine Intelligence paper, is that a fully faithful explanation of a black-box model would essentially make the black box redundant. In practice, popular explainability tools like SHAP and LIME produce approximations of what a model did, not a true account of it. In an interview, she went further, arguing that fairness itself is impossible to verify without an interpretable model, because you can’t reliably detect bias inside a system you can’t actually read. She also pushed back directly on the assumption that interpretable models sacrifice accuracy, telling one interviewer there’s no real evidence of that tradeoff in high-stakes settings.
Why this matters for the regulations above: Article 13 and the NAIC bulletin both require systems be “sufficiently transparent,” without mandating that the underlying model actually be interpretable by design. A bank or insurer could, in theory, bolt a SHAP dashboard onto a black-box model and satisfy the letter of these rules while the real decision-making stays opaque. Full legal compliance, without full actual explainability. That gap is the single most useful thing a skeptical reader can take from this piece.
What Compliance and Engineering Teams Should Do Now
Stop treating explainability as one checkbox. Map each AI system against each applicable framework separately: EU exposure, U.S. banking asset threshold, state insurance adoption, and FDA device classification all trigger independently.
Re-triage bank models by materiality rather than defaulting to SR 26-2’s predecessor’s uniform annual review cycle, and build a separate governance track for GenAI and agentic tools that the letter doesn’t cover.
Run the 30-day drill. Insurers should test, today, whether they can produce a plain-language adverse-decision explanation inside 30 days, not just point to a policy that says they can.
Finalize EU “instructions for use” documentation, training data characteristics, accuracy metrics, human oversight measures, before August 2, 2026, for any high-risk system touching EU customers or markets.
Classify clinical AI tools early. The more black-box a CDS tool looks, the more likely it lands in FDA’s regulated-device category, so build interpretability in before submission, not after a rejection.
The budget case is easier than it looks. Global spend on AI governance platforms sits at roughly $492 million in 2026 and is projected to cross $1 billion by 2030, according to Gartner, one of the few AI-adjacent spending categories still expanding while broader “AI ROI” skepticism grows everywhere else.
“Explainability turns a GenAI output into a defensible, auditable insight.”
Pankaj Prasad, Senior Principal Analyst, Gartner
Gartner separately predicts that by 2028, explainability will push LLM observability investment to 50% of GenAI deployments, up from just 15% today, a sign that the generative AI models least suited to today’s explainability tools are exactly where the next wave of tooling spend is heading.
Frequently Asked Questions
What is explainable AI (XAI)?
Explainable AI (XAI) refers to techniques and system designs that let humans understand why an AI model produced a specific output, the reasoning behind a credit denial, an insurance price, or a diagnosis, rather than just the output itself. It’s distinct from a purely accurate but opaque black-box model.
Why is explainable AI important in finance and healthcare?
In regulated sectors, AI decisions must be defensible to regulators, auditors, and the people affected. The EU AI Act, U.S. banking guidance (SR 26-2), the NAIC’s insurance bulletin, and FDA medical device guidance all treat opacity as a compliance risk, since unexplainable decisions can’t be audited for bias or error.
When does the EU AI Act require AI explainability?
The EU AI Act’s transparency obligations for high-risk AI systems, including those used in credit scoring, insurance pricing, and medical devices, become enforceable August 2, 2026. Non-compliant high-risk systems face penalties up to roughly €35 million or 7% of global turnover.
Does the U.S. require explainable AI in banking?
Not through a single binding federal law, but SR 26-2, issued April 2026 by the Fed, OCC, and FDIC, sets validation and transparency expectations for traditional and non-generative AI credit and risk models at banks over $30 billion in assets. Generative and agentic AI are explicitly excluded for now.
What is the difference between explainability and interpretability in AI?
Explainability generally means post-hoc techniques describing why a complex black-box model reached a decision. Interpretability means a model is transparent by design, like a decision tree or scoring system. Researcher Cynthia Rudin argues interpretable-by-design models are more trustworthy than explained black boxes.
Is explainable AI required for insurance companies?
In the states that have adopted the NAIC’s Model Bulletin on AI Systems, insurers must maintain a written AI governance program that accounts for the transparency and explainability of outcomes to the impacted consumer, particularly for adverse decisions like coverage denials or rate increases.
Where This Goes Next
By the time the EU’s implementing guidelines catch up to Article 13’s August deadline, and by the time NAIC’s evaluation tool pilot wraps in September, the “explainability as compliance checkbox” era will be over. What’s replacing it is sector-specific, examinable, and genuinely fragmented.
The through-line worth remembering: prudential and safety regulators, banking examiners, insurance commissioners, the FDA, are tightening explainability into binding practice. Broad state consumer-protection AI law is being narrowed under federal pressure. Those two trends are moving in opposite directions at the same time, and that tension, not a single new law, is the real story for the next 12 to 18 months.
Three things to watch before year-end: whether the European Commission’s Article 13 guidelines land before enforcement does, whether NAIC’s evaluation tool pilot expands beyond its 12 states at the Fall National Meeting, and whether the promised federal RFI on GenAI model risk actually appears, which would be the first sign U.S. banking regulators are ready to bring generative AI inside the SR 26-2 perimeter.
For more on what happens when AI gets the facts wrong instead of just unexplainable, see NeuralWired’s related coverage of the Deloitte AI hallucination report and FINRA’s 2026 warning, the accuracy half of the same trust problem covered here.
Get the next one first
NeuralWired’s newsletter, The Neural Loop, tracks AI regulation, enterprise deployment, and the stories vendors don’t want covered. Subscribe at neuralwired.com/newsletter.
Boeing’s aircraft technicians used to learn wiring installation from paper diagrams up to 20 feet long. Now a HoloLens headset walks them through it. The result, according to Boeing’s own training leadership, was a real cut in training time. But the number you’ve probably seen quoted, a tidy “40% faster,” doesn’t actually trace back to Boeing at all. If you’re building the business case for enterprise AR training ROI right now, that distinction is the difference between a defensible budget request and a number your CFO’s team unravels in five minutes.
This piece separates what Boeing, PwC, and a new 2025 Forrester study commissioned by Meta can actually support from what’s marketing copy dressed up as data. It also covers the part most vendor content skips: the same year enterprise training ROI got its best evidence yet, Meta and Microsoft both quietly killed their flagship enterprise VR collaboration products. Knowing where that line sits is the actual job.
Search “Boeing AR training” and you’ll land on a handful of stats that get repeated so often they’ve stopped sounding like claims and started sounding like facts: 40% faster, 75% less training time, 90% first-attempt accuracy. They don’t all come from the same place, and treating them as one unified statistic is the single most common error in coverage of this topic.
The “40% faster” figure and the claim that VR pushed first-attempt accuracy to 90% (versus 50% with manuals) show up almost exclusively on vendor marketing pages, not on anything Boeing has published or a Boeing executive has said on the record. That doesn’t make them false. It means nobody’s shown their work.
Why this matters for your build: Boeing’s own stated motivation for scaling this program is a projected shortage of roughly 769,000 new aviation maintenance technicians needed globally through 2038, from its Pilot and Technician Outlook. That’s a workforce-demand number, not a training-efficacy number, and the two get blended constantly in secondary coverage. Keep them separate.
Boeing built a scalable “xR Learning Framework” to deliver training through mobile and AR/VR devices, after an internal survey drawing more than 40,000 employee responses ranked technical-development-program improvement as a top organizational priority.
Pete Boeskov, Chief Technologist for Training and Professional Services, Boeing, via Field Service USA
The 219% ROI Figure, and Its Asterisk
The newest, and most quoted, number in this space comes from a Forrester Consulting Total Economic Impact study, published in mid-2025. Forrester interviewed six decision-makers across four organizations using Meta Quest for training, then modeled a composite 10,000-employee company with 3,300 workers trained via VR. The headline result: 219% ROI over three years, $6.1 million in benefits against $1.9 million in costs, $4.2 million in net present value, and payback in under six months.
The mechanism behind that number is worth knowing if you’re the one presenting it upward. Task-worker training time fell roughly 75%. Training time for knowledge workers fell about 50%. Onboarding sped up by 25%. Travel and in-person training costs dropped around 50%, worth an estimated $1.6 to $1.7 million over three years.
Here’s the part that belongs in your slide, not just your footnote: Meta commissioned and paid for this study. Forrester’s TEI methodology is independently recognized and has a real track record, but a recognized methodology applied to a customer sample the vendor helped select is not the same thing as an independent, randomized study. Use the number. Just don’t present it as neutral.
PwC’s Break-Even Math
If Forrester gives you the headline, PwC’s 2020 study gives you the number your finance team will actually ask for: the headcount at which VR training stops being a cost center. PwC compared classroom, e-learning, and VR delivery of the same unconscious-bias and inclusive-leadership course, built with Talespin, across 12 US office locations between February 2019 and January 2020.
VR learners finished up to 4 times faster than classroom learners and 1.5 times faster than e-learners. On cost, VR reached parity with classroom training at 375 trained learners, and became roughly 52% cheaper than classroom training once an organization hit 3,000 learners.
That 375-learner threshold is arguably more useful than any ROI percentage, because it turns an abstract “does this work” question into a concrete one: does your organization actually train that many people on the same material. If the answer is yes, the PwC data supports the investment. If you’re training 40 people once, it doesn’t.
What Walmart, Bank of America, and Intel Actually Report
Beyond Boeing and the Forrester composite, several named enterprise deployments have public, attributable figures, compiled in VR.org’s April 2026 rundown of the category.
Company
Deployment
Reported result
Walmart
1M+ employees trained via VR; Pickup Tower module
8 hours to 15 minutes training time; 30% higher satisfaction
Bank of America
50,000+ employees, Strivr platform
Scaled soft-skills and procedural training
Intel
VR safety training program
300% ROI, measured over five years
Accenture
“Nth Floor” persistent VR campus, Meta Quest
Onboarding and internal collaboration
Notice the pattern: the biggest, cleanest numbers cluster around task-specific, repeatable, physical procedures. Wiring a harness. Restocking a pickup tower. Running a safety drill. That’s not an accident, and it’s the thread that ties directly into where this whole category runs into trouble.
Why Meta Just Shut Down Its Own VR Meeting Product
Here’s the story that rarely makes it into the same article as the ROI numbers above. In February 2026, Meta shut down Horizon Workrooms, its enterprise VR meeting and collaboration product, exiting the enterprise-collaboration category entirely. The following month, Meta made Horizon Worlds mobile-only and pulled it from the Quest Store. Microsoft made a nearly identical call, retiring the Immersive Space view in Teams and shutting down Mesh across web, PC, and Quest in December 2025.
The distinction that actually matters: the same company reporting a 219% ROI on task-specific training just walked away from enterprise VR meetings. Those are two different product categories with two different evidence bases, and conflating them is how a training budget gets killed by an unrelated headline about the “metaverse dying.” Training that replaces a physical, repeatable, high-stakes procedure has real data behind it. Training that replaces a Zoom call does not, and both Meta and Microsoft have now said so with their product roadmaps, not just their press releases.
The Novelty Effect Problem Nobody’s Marketing Deck Mentions
Every headline number in this piece so far measures completion speed, test scores, or cost. None of them, including PwC’s and Forrester’s, measure whether the learning actually sticks weeks or months later. That gap has a name in the academic literature: the novelty effect.
A peer-reviewed 2023 study by researcher Josef Wolfartsberger, published in Computers in Industry, ran a direct comparison of VR-based training against traditional on-the-job training for industrial assembly tasks, measuring assembly time, error rate, and hints required. The result complicates the “VR trains people dramatically faster” story: outcomes were broadly comparable between the two methods.
VR training functions best as a useful addition to, rather than a replacement for, existing industrial training methods.
Josef Wolfartsberger, in Computers in Industry, 2023
That finding lines up with a broader pattern documented in a 2024 systematic review published in Technology, Knowledge and Learning, which synthesizes controlled studies referencing researchers including Guido Makransky and Richard Mayer. The pattern: VR engagement and enjoyment don’t reliably translate into durable skill retention once the novelty of the medium itself wears off. None of the vendor-commissioned studies driving the current ROI conversation, PwC’s included, report learning outcomes measured more than a few weeks post-training, which is exactly the window where researchers say novelty-driven gains are most likely to be inflated.
When XR Training Actually Makes Sense
Jeremy Bailenson, founding director of Stanford’s Virtual Human Interaction Lab and a co-founder of Strivr (worth disclosing: he has a commercial stake in this category), has offered a scoping framework that cuts through most of the noise. Training justifies VR when the task is dangerous, difficult or impossible to stage physically, expensive to repeat, or rare, the “DDER” test. Pilot training is the canonical example: a mistake in the real world is catastrophic, so simulating it isn’t optional, it’s the only responsible option.
Bailenson has also been blunt about the ceiling on this technology. In a 2023 talk that’s still the clearest public version of his view, he’s noted VR “is not the next smartphone,” meaning it’s a tool for specific high-stakes scenarios, not a general-purpose daily device.
Run Boeing, Walmart’s Pickup Tower module, and Intel’s safety training through the DDER filter and they all pass cleanly: physically hazardous, expensive to stage repeatedly with real equipment, or both. Run Horizon Workrooms and Microsoft Mesh through the same filter and they fail it. A meeting isn’t dangerous, difficult to stage, expensive to repeat, or rare. It’s a meeting.
FAQ
Does Boeing actually use augmented reality for training?
Yes. Boeing uses Microsoft HoloLens-based AR to guide aircraft technicians through wiring-harness installation, replacing paper diagrams that ran up to 20 feet long. Improvements in wiring speed and accuracy have been attributed directly to Boeing’s Chief Technologist for Training, Pete Boeskov.
What is the actual ROI of enterprise VR training?
A 2025 Forrester Consulting study commissioned by Meta found enterprise VR training delivered 219% ROI over three years, with payback in under six months, driven mainly by faster onboarding and lower travel and instructor costs. It’s vendor-commissioned, not an independent study.
At what company size does VR training pay for itself?
PwC’s research found VR training reaches cost parity with classroom training at roughly 375 trained learners, and becomes about 52% cheaper than classroom training once an organization trains 3,000 people on the same material.
Is the metaverse dead for business training?
No. Task-specific enterprise training, aviation maintenance, industrial assembly, safety drills, continues to show measurable results even as Meta and Microsoft both shut down their enterprise VR meeting products (Horizon Workrooms and Mesh) in late 2025 and early 2026.
Where This Goes Next
The evidence for task-specific, hands-on XR training is genuinely strong, and it’s getting stronger with each new deployment. The evidence for VR as a general collaboration or meeting layer has now failed twice in the market, in 2021 to 2023 and again with the Horizon Workrooms and Mesh shutdowns. Those are two different bets with two different track records, and the next 6 to 18 months will likely sharpen that split further rather than blur it.
Three things worth watching: whether Forrester or a comparable firm publishes a training-ROI study that isn’t vendor-commissioned, whether any of the current studies extend their measurement window past a few weeks to actually test the novelty-effect concern, and whether headset prices, already down roughly 60% since 2016, fall far enough to make fleet-scale deployment viable for mid-market companies, not just Boeing and Walmart-sized organizations.
If you’re building a business case internally, the honest version is short: task-specific, high-stakes, hard-to-repeat training has real, replicated numbers behind it. Everything else in this category is still an open question, whatever the demo reel implies.
Want research briefs like this before they’re common knowledge? Subscribe to The Neural Loop at neuralwired.com/newsletter.
Pfizer and JPMorgan Prove Quantum Computing Works in 2026
Enterprise Technology
Pfizer and JPMorgan Prove Quantum Computing Works in 2026
By the NeuralWired Research Desk | Updated July 8, 2026
Pfizer cut a four month drug simulation down to days. JPMorgan Chase ran real stock portfolios on a 98 qubit quantum computer using actual market data, not a simulation. Quantum computing real world applications are no longer confined to conference keynotes and vendor slide decks. They are showing up, quietly and specifically, inside three industries: pharmaceuticals, financial services, and logistics.
This isn’t the “quantum computing will change everything” story you’ve read a dozen times since 2019. It’s narrower than that, and more useful because of it. Three companies, three named pilots, three sets of numbers you can check yourself.
A quick correction, because accuracy matters here. You may have seen claims that Pfizer “saved 18 months” on simulation time, or that JPMorgan modeled “10,000 portfolio scenarios in seconds.” Neither figure appears in any primary source from Pfizer, XtalPi, or JPMorgan. What’s actually documented, and cited below, is arguably more interesting: a four month process cut to days, and a real 225 asset portfolio problem run on live trapped ion hardware. No inflation needed.
How Pfizer actually uses quantum physics in drug discovery
Here’s the part most coverage gets wrong: Pfizer isn’t running its drug discovery pipeline on a quantum computer. Not yet, anyway. What it’s doing is arguably more interesting, because it’s already working.
Pfizer partnered with XtalPi, a pharmaceutical tech company founded by MIT trained quantum physicists, on crystal structure prediction. It’s a quantum physics based computational technique, built on AI and cloud infrastructure rather than a standalone quantum processor, that predicts how a drug candidate’s molecules will arrange themselves in three dimensions before a single physical crystal is grown.
That prediction used to take up to four months. Through the XtalPi collaboration, it now takes a matter of days.
Pfizer describes crystal structure prediction as a process the team used to avoid attempting, given how long it took, and now runs on nearly every small molecule project.
Bruno Hancock, Global Head of Materials Science, Pfizer, Groton CT (via Pfizer.com)
Hancock also notes that a single crystal structure prediction requires computing power roughly equivalent to one million laptops. That’s the kind of number that explains why the four month wait existed in the first place, and why shrinking it to days matters commercially, not just academically.
Separately, Pfizer’s internal AI and Digital Accelerator team has published research applying a digitized counterdiabatic version of the Quantum Approximate Optimization Algorithm to molecular docking, the process of predicting how a drug candidate binds to its target protein. As of the March 2025 paper, that work ran on GPU clusters simulating quantum behavior, not on live quantum hardware. Worth flagging plainly: this is AI plus quantum-inspired computation, not a production quantum computer. Conflating the two is the single most common inaccuracy in secondary coverage of this topic.
Pfizer isn’t alone. Merck and GlaxoSmithKline are running comparable quantum-adjacent drug discovery partnerships, which tells you this is a sector-wide bet, not a one-company experiment.
If you want the single most citable data point in enterprise quantum computing right now, this is it. On July 1, 2026, JPMorgan Chase and Amazon’s AWS Center for Quantum Computing published research titled “Quantum-Informed Portfolio Selection,” and it’s the rare quantum paper that used real market data instead of synthetic test cases.
The team framed portfolio diversification as a graph theory problem (specifically, a Maximum Independent Set problem) and ran it on Quantinuum’s 98 qubit Helios trapped ion quantum computer, using actual correlation data from four major stock indices: the DAX, FTSE 100, S&P 100, and Nikkei 225, with as many as 225 individual assets.
The results are blunt about where quantum computing currently stands. Standalone QAOA, the algorithm most associated with near-term quantum optimization, failed completely on the two hardest indices, the S&P 100 and Nikkei 225, hitting a 0% success rate on its own. JPMorgan’s hybrid workaround, an algorithm called qReduMIS, achieved success probabilities of 0.40 on the S&P 100 and 0.95 on the Nikkei 225, with approximation ratios of 0.96 or better across all four indices.
That gap between “pure quantum failed” and “hybrid quantum worked” is the actual story. It’s not that quantum computers solved finance. It’s that a hardware ceiling (98 qubits couldn’t natively handle a 225 asset problem) forced a classical-quantum workaround that ended up working well.
Pistoia has credited JPMorgan’s access to NVIDIA GPU based supercomputing through Argonne National Laboratory as central to running the large-scale numerical studies behind its quantum optimization research.
Marco Pistoia, Head of Global Technology Applied Research and Head of Quantum Computing, JPMorgan Chase (via JPMorganChase Technology Blog)
JPMorgan has since filed a patent for quantum-assisted portfolio selection, and on June 3, 2026, announced a research collaboration with Oxford Quantum Circuits and AMD to build a dedicated Quantum-AI Data Centre in London, giving its quantum team a permanent testing environment for hybrid applications. Goldman Sachs, HSBC, and BBVA are running comparable pilots with IBM, D-Wave, and QC Ware, so read this as a competitive race across Wall Street, not a JPMorgan exclusive.
DHL, Volkswagen, and the logistics pilots nobody’s hyping
Logistics gets less press than pharma or finance in the quantum conversation, which is strange, because the underlying math (vehicle routing, crew scheduling, warehouse allocation) is exactly the kind of combinatorial optimization problem quantum algorithms are theoretically suited for.
DHL is benchmarking quantum-hybrid vehicle routing solvers against classical solvers for last-mile delivery, which accounts for 40 to 50% of total logistics cost. On 50 to 100 stop delivery instances, quantum-hybrid approaches currently perform comparably to classical solvers, with an expected advantage as hardware and problem sizes scale up.
Volkswagen is the most-documented enterprise quantum optimization user in the world, running pilots since 2017 across traffic routing, paint-shop scheduling, and battery chemistry research. Its 2019 Lisbon bus-routing pilot was the first public urban traffic optimization test using quantum methods.
Qantas, Airbus, and IBM Quantum ran a proof-of-concept back in 2021 applying quantum computing to flight crew scheduling, widely considered one of aviation’s hardest combinatorial problems. More recently, Airbus and BMW ran a 2024 Quantum Computing Challenge tasking entrants with optimizing a global aircraft manufacturing supply network for cost, delivery time, and carbon emissions simultaneously. Lufthansa Cargo, Amazon, and Carrefour are testing similar approaches for routing, maintenance prediction, and warehouse operations.
Industry
Lead organization
What’s actually running today
Pharma
Pfizer + XtalPi
Crystal structure prediction: 4 months cut to days
Finance
JPMorgan Chase + AWS
225-asset portfolio diversification on 98-qubit hardware
Logistics
DHL, Volkswagen, Airbus/BMW
Routing and scheduling pilots at 50 to 100 stop scale
What the market data says about where this is headed
The global quantum computing market hit $1.4 billion in 2025, according to the Quantum Economic Development Consortium’s 2026 industry report, one of the few figures in this space with a named, transparent methodology (a survey of over 7,400 quantum-engaged organizations). The broader quantum technology market is projected to roughly double by 2028. Use that figure over the vendor market-research estimates floating around, which range anywhere from $1.6 billion to $3.6 billion for the same 2025 baseline, because each vendor scopes “quantum market” differently.
Banking, financial services, and insurance hold the single largest projected quantum computing end-use market share at 26.11% in 2026, according to Fortune Business Insights, which lines up with why JPMorgan’s research is getting so much attention right now.
Capital is moving fast. Private venture investment in quantum technology hit $4.9 billion in 2025, per McKinsey’s Quantum Technology Monitor 2026, more than doubling the prior record year. McKinsey projects the broader quantum technology market could reach $60 billion to $100 billion globally by 2035, with quantum computing specifically accounting for $43 billion to $71 billion of that.
More than half of quantum computing companies expect at least an 11% revenue increase from 2025 to 2026, and 37% are projecting growth above 25%, per QED-C’s survey data. The global pure-play quantum workforce reached roughly 16,500 professionals in 2025, up about 2,000 in a single year, a growth rate that, as you’ll see below, isn’t keeping pace with demand.
The algorithm gap: why hardware is outrunning usefulness
Here’s the honest part most vendor content skips.
If a business were handed a working quantum computer tomorrow, could it actually run its intended quantum algorithm? For most of the field today, the honest answer is not really.
Robbie King, doctoral researcher in quantum computing, Caltech (as reported in coverage of the field’s current state)
That’s the structural problem underneath every pilot in this article. Qubit counts and error correction are improving faster than most experts predicted a decade ago. The theoretical work needed to find problems where quantum genuinely beats classical computing at useful scale hasn’t kept pace. JPMorgan’s own paper is a case study in this: its hybrid workaround was necessary specifically because the full 225 asset problem exceeded the 98 qubit hardware’s native capacity. That’s a hardware ceiling being managed cleverly, not quantum computing beating classical computing outright.
Talent is a separate, compounding bottleneck. McKinsey has found roughly one qualified quantum candidate for every three job openings in the field, with less than half of quantum computing roles currently filled. Hardware and algorithms could both accelerate tomorrow and adoption would still be capped by how many people know how to build on top of either.
There’s one place where the timeline genuinely has moved up, and it’s not commercial optimization. It’s cryptography.
People whose judgment on quantum hardware and error correction I trust more than my own now tell me a fault-tolerant quantum computer capable of breaking deployed cryptography ought to be possible by around 2029.
Scott Aaronson, Schlumberger Centennial Chair of Computer Science, UT Austin, and elected member of the U.S. National Academy of Sciences (via scottaaronson.blog, May 1, 2026)
Aaronson has spent years as quantum computing’s most credible public skeptic. That he’s now sounding an alarm, specifically about cryptography and not about drug discovery timelines or supply chain ROI, is worth sitting with. Coverage that blends “quantum could break encryption soon” with “quantum will transform your logistics network soon” is collapsing two very different maturity curves into one story. They’re not the same story, and treating them as one is where a lot of quantum journalism goes wrong.
Google set an internal 2029 deadline to migrate to post-quantum cryptography, announced in a March 2026 blog post, part of a broader “harvest now, decrypt later” security conversation now spreading across finance and government. If your organization handles sensitive data with a long shelf life, that deadline applies to you regardless of whether quantum computing ever delivers on the drug discovery or portfolio optimization promises above. For more on what that migration actually involves, see our guide to the NIST post-quantum migration deadlines.
What CTOs and technical leaders should actually do
Nothing here is operational yet for most companies. Every pilot named in this article, Pfizer/XtalPi, JPMorgan/Quantinuum, DHL, Volkswagen, Airbus/BMW, is a hybrid research collaboration, not a production system quietly replacing classical infrastructure. If you’re a technical leader wondering whether to act now, here’s the honest breakdown:
Benchmark before you budget. JPMorgan’s paper shows the crossover point where quantum-hybrid starts beating classical depends heavily on problem structure, not just raw problem size. Run that math on your own optimization workloads before committing spend.
Start quantum talent planning now, not later. With workforce growing roughly 14% a year against surging job openings, waiting until you have a defined quantum use case means competing for talent that’s already scarce.
Treat post-quantum cryptography migration as non-negotiable. Unlike the optimization and simulation use cases above, PQC migration has a real deadline attached to it (2029, per Google’s own internal target) independent of whether quantum delivers business ROI on any particular schedule.
Frequently asked questions
Is quantum computing actually being used today?
Yes, in narrow pilots. Pfizer, JPMorgan, DHL, Volkswagen, and Airbus all run hybrid quantum-classical programs today, but every documented case remains a research pilot or proof-of-concept rather than a production system replacing classical infrastructure at scale, as of mid-2026.
How is quantum computing used in drug discovery?
Quantum physics based computational methods, often paired with AI and cloud computing, predict a drug candidate’s 3D molecular structure through crystal structure prediction, far faster than traditional X-ray crystallography. Pfizer’s XtalPi partnership cut this from up to four months down to a matter of days.
How is quantum computing used in finance?
Banks use quantum and hybrid quantum-classical algorithms mainly for portfolio optimization, risk analysis, and option pricing. JPMorgan Chase’s July 2026 research with AWS ran real stock-index portfolio diversification on a 98-qubit Quantinuum trapped-ion computer using live market data.
What is the market size of quantum computing?
Estimates vary by scope, but the Quantum Economic Development Consortium put the global quantum computing market at $1.4 billion in 2025, with the broader quantum technology market projected to roughly double by 2028, per its 2026 industry report.
Which industries benefit most from quantum computing?
Banking, financial services, and insurance hold the largest projected quantum computing market share, at 26.11% in 2026, per Fortune Business Insights, followed by pharmaceuticals and logistics-manufacturing optimization.
Is quantum computing overhyped?
Partly. Hardware progress has outpaced expert predictions from a decade ago, but the algorithms needed to exploit that hardware for real business problems, and the talent to build them, both lag well behind, according to researchers including Caltech’s Robbie King.
Where this goes next
What you now know that most coverage of this topic gets wrong: quantum computing isn’t quietly running production systems at Pfizer, JPMorgan, or DHL. It’s running specific, named, hybrid pilots, and the results (a four month process cut to days, a 225 asset portfolio problem solved on real hardware) are genuine engineering progress without being business transformation, yet.
Watch three things over the next 6 to 18 months: whether JPMorgan’s qReduMIS approach gets adopted by other banks now racing on the same problem, whether Pfizer or a competitor moves crystal structure prediction work onto actual quantum hardware rather than quantum-inspired classical infrastructure, and whether Google’s 2029 post-quantum cryptography deadline starts pulling forward migration timelines at other major cloud and financial providers.
The technology that will actually reshape your industry in the next few years might not be the one generating the most headlines. Sometimes it’s the specific, unglamorous pilot quietly working, not the sweeping claim that doesn’t hold up under a fact check.
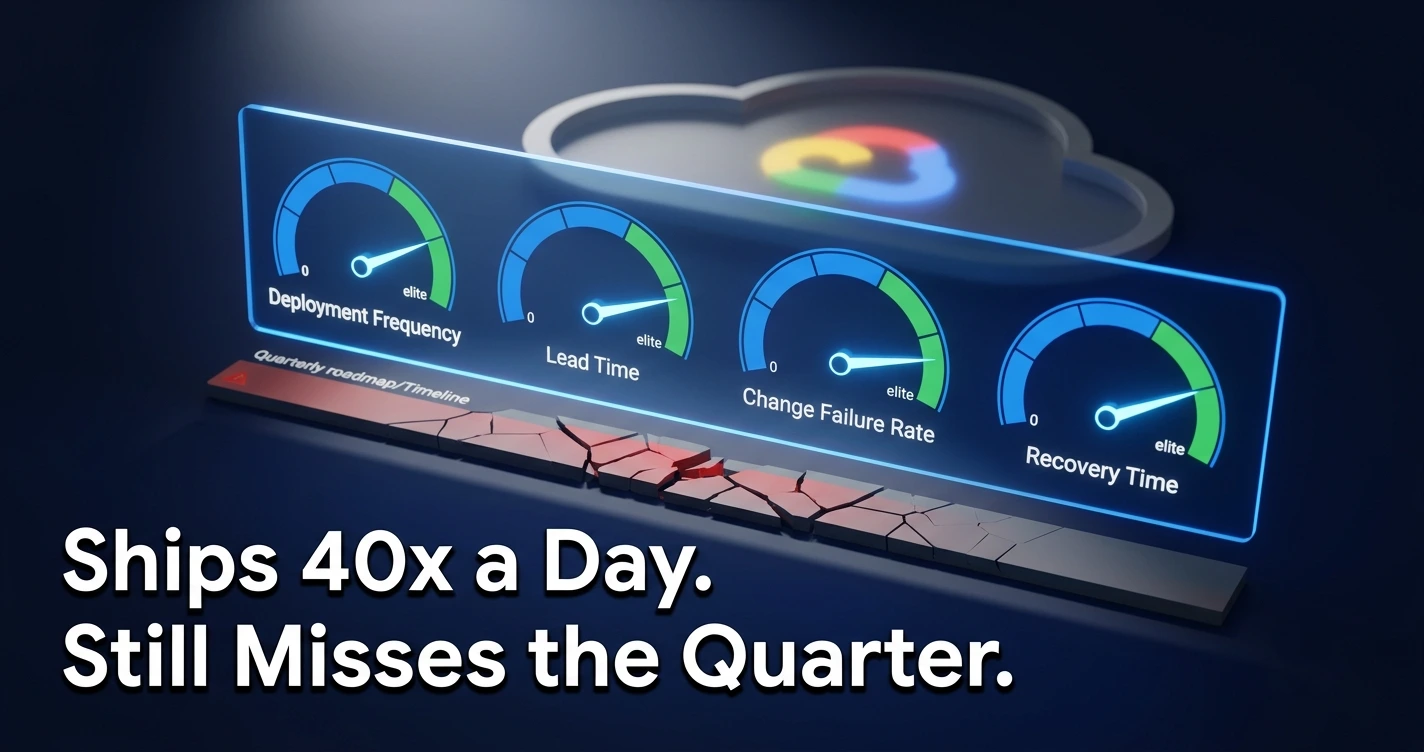
Deployment frequency is up. Lead time is down. Every dashboard is green. And your VP of Engineering still can’t explain why the roadmap slipped a quarter behind. If that sounds familiar, you’re not measuring the wrong things badly. You’re measuring the wrong things well.
DORA metrics, the deployment frequency, lead time, change failure rate, and recovery time framework born out of Google Cloud’s DevOps Research and Assessment program, have become the default scoreboard for engineering performance. In 2024, only 19% of teams surveyed hit “elite” status on that scoreboard. Yet DORA’s own research team has publicly warned against using these numbers to judge team performance at all. So what are engineering leaders supposed to trust instead?
DORA started as a research program, not a dashboard. Dr. Nicole Forsgren, Jez Humble, and Gene Kim built it, and their 2018 book Accelerate introduced what became known as the Four Keys: deployment frequency, lead time for changes, change failure rate, and time to restore service. Google Cloud has run the program since acquiring the founding team’s research in 2018.
In 2024, DORA added a fifth metric: rework rate, which tracks how many deployments are actually emergency fixes for problems the last deployment caused. That addition alone tells you something. The original four measure how fast you move. Rework rate exists because moving fast and moving in circles started to look identical on the old dashboard.
Quick definition: An “elite” DORA performer deploys on demand, has a lead time under one day, keeps change failure rate near 5%, and restores service in under an hour. In 2024, roughly one in five surveyed teams qualified. Source: DORA 2024 State of DevOps Report
The “Elite Performer” Number Nobody Questions
Here’s the stat that gets stapled to every engineering leadership deck: elite performers deploy 182 times more frequently than low performers, and they restore service 2,293 times faster. Those numbers are real, pulled from a survey of more than 39,000 professionals for the 2024 State of DevOps Report. They’re also the least useful numbers in the report if you’re trying to explain a missed quarter.
Look at what happened to the middle of the distribution instead. Between 2023 and 2024, the share of low-performing teams grew from 17% to 25%. The share of high performers shrank from 31% to 22%. The industry didn’t get better at DevOps last year. It got worse, on average, while adopting more DevOps tooling than ever.
Metric
2023
2024
Low-performing teams
17%
25%
High-performing teams
31%
22%
Elite-performing teams
not tracked
19%
That’s the gap the headline is pointing at. A team can hit every DORA benchmark and still be part of a shrinking pool of teams whose actual delivery outcomes are stagnant or backsliding.
Why Speed and Goals Keep Diverging
DORA’s own research team saw this coming. In October 2023, according to reporting cited on DORA’s Wikipedia entry, the team explicitly warned against using the Four Keys to evaluate individual teams’ performance. That’s an unusual thing for a research program to say about its own flagship metrics. It’s also exactly what you’d expect once a research tool turns into a KPI baked into Jira, GitLab, and every engineering-analytics dashboard on the market.
This is Goodhart’s Law showing up in production code. Once deployment frequency becomes the target, it stops measuring what it used to measure. Teams under pressure to hit a number will split pull requests into smaller, more frequent deploys without changing what actually ships. They’ll quietly under-report incidents to protect their change failure rate. None of that improves the product. All of it improves the chart.
Teams pressured to raise their deployment rate by a fixed percentage can hit that target simply by shipping smaller changes more often, without touching the bugs or incidents that actually determine whether users are happy.
Laura Tacho, CTO, DX · getdx.com/podcast
DORA even flags this tension inside its own 2024 data. Teams that adopted internal developer platforms saw individual productivity and overall organizational performance improve, but the report also found decreased change stability and throughput as a side effect. Speed up one lever, and another one moves without anyone touching it.
What AI Adoption Did to the Data
If DORA metrics were shaky before, AI made the cracks visible. The 2024 report found that a 25% increase in AI adoption correlated with a 1.5% decrease in throughput and a 7.2% decrease in stability, DORA’s own team flagged this as correlational rather than causal, but the direction is notable.
By the time the 2025 State of AI-assisted Software Development Report came out, AI use had reached 90% of surveyed professionals, with more than 80% reporting productivity gains. But 30% still said they had little or no trust in the code AI generated for them. The report’s core finding, drawn from nearly 5,000 professionals and over 100 hours of qualitative interviews, was blunt: AI doesn’t fix a broken team. It amplifies whatever was already there. Strong teams get stronger. Struggling teams get their existing dysfunction on fast-forward.
That’s the mechanism behind the headline. A team with process debt that starts using AI coding tools doesn’t quietly improve. It ships more, faster, with the same underlying gaps, and those gaps show up downstream as missed goals rather than upstream as slow commits.
The Case Against DORA Entirely
Not everyone thinks DORA metrics deserve the reverence they get. Dr. Junade Ali, a software engineering manager who ran independent polling with Survation and J.L. Partners, published a pointed critique on HackerNoon in January 2024 arguing the entire premise is backwards.
His research found that both software engineers and the general public rank data security, data accuracy, and bug prevention well above deployment speed when asked what matters in software delivery. That directly contradicts what the Four Keys are built to optimize for. Ali also points out that DORA’s team doesn’t publish raw survey data, unlike polling organizations bound by disclosure rules such as the British Polling Council, which require full data tables within two working days of publication.
It’s hard to find a hypothesis connecting the Four Key Metrics to the outcomes that developers and the public actually say they care about most.
Dr. Junade Ali, Software Engineering Manager · HackerNoon, January 2024
His research also found something worth sitting with: 98% of UK business decision-makers and 96% of their US counterparts agreed that the actual goal of an engineering team is delivering high-quality software on time, not shipping the highest possible number of deploys. Nobody polled thinks speed is the goal. Yet speed is what gets measured, reported, and rewarded.
What Replaces DORA in 2026
The clearest answer to “what should we measure instead” so far is DX Core 4, a framework announced in December 2024 by DX co-founder and CEO Abi Noda and DX CTO Laura Tacho, built with input from DORA co-creator Dr. Nicole Forsgren and Dr. Margaret-Anne Storey. It’s worth being upfront here: DX sells the platform that implements this framework, so its published outcomes come from the vendor itself, not an independent auditor.
With that disclosed, the numbers are still notable. Tested across more than 300 organizations, DX Core 4 has been associated with 3 to 12% increases in engineering efficiency and a 14% increase in R&D time spent on new feature development. The framework’s structure is the real change: it pairs DORA’s speed metrics with effectiveness, quality, and business impact measures, so a team can’t improve one number by quietly breaking another.
The big question is, what should we actually be measuring? DORA’s throughput numbers alone were never built to capture developer experience or business impact.
Abi Noda, Co-founder & CEO, DX · LeadDev, December 2024
The market is already voting with its budget
Platform engineering investment backs this shift up. Gartner projections cited in industry compilations put platform engineering team adoption at 80% of large software organizations by 2026, up from 45% in 2022 (worth verifying directly against a current Gartner release before you cite the figure yourself). The broader DevOps software market itself is priced anywhere from roughly $15 billion to nearly $19 billion for 2026 depending on which research firm you ask, a wide enough range that any single number should be treated as directional, not precise.
Our read: this signals engineering leadership is done treating DORA as a finished answer. The direction for 2026 is DORA plus a counterbalancing quality or business-impact metric, not DORA replaced outright.
Frequently Asked Questions
What are the DORA metrics?
DORA metrics are five software delivery measurements, deployment frequency, lead time for changes, change failure rate, failed deployment recovery time, and rework rate (added in 2024), developed by Google Cloud’s DORA research program to evaluate delivery speed and stability.
What is an elite DORA performer?
In DORA’s 2024 report, elite performers deploy on demand, have lead times under a day, keep change failure rates near 5%, and recover from failures in under an hour. Only about 19% of surveyed teams qualified as elite that year.
Are DORA metrics enough to measure engineering success?
No. DORA’s own team warned in October 2023 against using the Four Keys to evaluate individual teams. Newer frameworks like DX Core 4 pair DORA with developer experience and business impact metrics to avoid a narrow, gameable view of performance.
What is Goodhart’s Law and how does it apply to DORA metrics?
Goodhart’s Law holds that once a measure becomes a target, it stops being a good measure. Applied to DORA, teams pressured to hit deployment-frequency targets can split pull requests artificially or under-report incidents to protect their numbers, without improving actual delivery outcomes.
What is DX Core 4?
DX Core 4 is a 2024 framework combining DORA, SPACE, and DevEx research into four dimensions: speed, effectiveness, quality, and business impact. It was built by DX’s Abi Noda and Laura Tacho with input from DORA co-creator Dr. Nicole Forsgren.
Where This Goes Next
Here’s what the data actually tells you, once you stop reading the headline numbers in isolation: DORA metrics were never designed to be a scoreboard for individual teams, and the program’s own researchers said so in writing back in 2023. What they measure well is delivery speed and stability at an aggregate level. What they can’t tell you is whether that speed is producing anything your business actually wanted.
Over the next 6 to 18 months, expect three things to play out. First, more engineering orgs will pair DORA with a second framework, DX Core 4 or something built in-house, rather than reporting DORA numbers alone in board decks. Second, AI’s split effect (individual productivity up, organizational stability shaky) will keep showing up in DORA’s own annual reports until teams fix underlying process debt instead of layering AI on top of it. Third, watch for tooling vendors to start marketing “beyond DORA” dashboards as a category, the same way “shift-left security” became a category once perimeter security stopped being enough on its own.
Three things worth watching yourself over the next few quarters: whether your org’s change failure rate moves in the same direction as your deployment frequency, whether anyone above you is asking about rework rate at all, and whether a platform engineering investment is quietly trading stability for speed without anyone naming the tradeoff out loud.
Apple Gave Up on Vision Pro. Hospitals Didn’t Get the Memo.
By the NeuralWired Research Desk · July 8, 2026 · 9 min read
Apple sold roughly 390,000 Vision Pro units in 2024. In 2025, that number fell to 45,000, an 88% collapse that even a mid-cycle chip refresh couldn’t reverse. Yet a few weeks ago, a surgeon in Hauppauge, New York used the same headset to help remove a patient’s cataract. MacRumors reported that Apple has quietly stopped building the future of this product. The operating rooms using it right now didn’t get the message, and they’re not slowing down.
That split, a consumer product left for dead and an enterprise product just getting started, is the real Apple Vision Pro story in mid-2026. If you’re evaluating spatial computing hardware for your organization, or just trying to figure out whether visionOS is a platform worth building on, the headlines about Apple “giving up” are only half the picture. Here’s the other half, with the numbers to back it up.
Start with what’s verified. MacRumors reported on April 29, 2026, citing insider sources, that Apple has effectively halted active Vision Pro development following the October 2025 M5 refresh, which did nothing to move demand. Much of the original team, the report claims, has been reassigned, some of them now working under Vision Pro creator Mike Rockwell, who has led Siri since March 2025.
Within days, gHacks, TechSpot, Slashdot, and MacDailyNews had all corroborated the reporting. The consistent detail across every outlet: Apple has sold around 600,000 Vision Pro units total since the February 2024 launch, a fraction of what the company originally hoped for, and the device carries an unusually high return rate for a modern Apple product.
None of this happened in a vacuum. Apple and Meta both pulled back hard on VR marketing in 2025. Sensor Tower data, cited by The Register, shows Apple’s Vision Pro ad spend across eight major markets dropped more than 95% year over year. Meta’s Quest spend fell over 55% in the same window. When both leaders in a category stop advertising it at the same time, that’s not a coincidence. That’s a category telling you something.
The Numbers, Side by Side
IDC’s Francisco Jeronimo laid out the shipment math in a interview with The Register on January 2, 2026. It’s the cleanest single data trail in this entire story, so it’s worth putting in one place.
Metric
Figure
Source
Vision Pro units shipped, 2024
390,000 (~$1.4B revenue)
IDC
Vision Pro units shipped, 2025
45,000
IDC
2026 forecast (rebound tied to rumored cheaper model)
290,000 units (~$636M)
IDC
Cumulative units sold since Feb 2024 launch
~600,000
MacRumors insider sources
VR/MR headset category shipments, 2025
Down 42.8% industry-wide
IDC AR/VR Headset Tracker
Smart glasses shipments, 2025
Up 211%
IDC AR/VR Headset Tracker
Global enterprise AR/VR spend, 2026
~$12B, up ~20% YoY
IDC and adjacent forecasters, via VR.org
Notice that IDC still expects growth in 2026, just not back to 2024 levels. And notice the category-wide pattern: this isn’t an Apple problem specifically. Meta’s own Quest headset shipments fell 42.3% year over year even as its Ray-Ban smart glasses line boomed. Consumers aren’t rejecting Apple. They’re rejecting headsets, full stop, in favor of lighter glasses that don’t require blocking out the room to use them.
“It will never happen.”
Francisco Jeronimo, VP, IDC, on the idea that AR and VR would replace smartphones, via The Register, January 2, 2026
Jeronimo’s broader point, beyond that one blunt line, is that the consumer bet was always the wrong bet. He argues the real opportunity sits with organizations that can justify the cost through measurable efficiency gains, not with mainstream shoppers who were never going to strap on a $3,499 computer to check email.
The Pushback: Not Everyone Agrees Apple Quit
Here’s where the story gets genuinely contested, and where a lot of coverage this spring flattened a real disagreement into a clean narrative. Independent Apple analyst John Gruber, whose Daring Fireball has tracked Apple insider sourcing since 2002, directly disputed the “Apple gave up” framing the day after MacRumors published.
“It is not true that the teams have been redistributed.”
John Gruber, Daring Fireball, April 30, 2026, responding to MacRumors’ reporting
Gruber went further, stating that this was news to Apple’s own Vision Product Group and that visionOS 27, along with new hardware on two fronts, AR glasses and additional immersive Vision headsets, remains in active development for a WWDC 2026 reveal. That’s a specific, on-record contradiction of a specific, sourced claim, from two outlets with real Apple-insider track records.
Our read: this isn’t a case where one side is obviously right. MacRumors and Gruber have both been reliable Apple sources for years. The likeliest explanation sits in the middle: Apple has scaled back Vision Pro’s consumer ambitions and marketing hard, while keeping a smaller, more enterprise-and-glasses-focused platform team alive. Whether that counts as “giving up” depends entirely on what you expected Vision Pro to become in the first place.
Where Vision Pro Is Actually Winning
While the consumer story stalled, a quieter one built momentum inside hospitals and factories. On April 27, 2026, SightMD announced that ophthalmologist Dr. Eric Rosenberg had performed a Vision Pro assisted cataract surgery at its Hauppauge, New York facility using the ScopeXR platform. The actual first case had happened back in October 2025. By April 2026, hundreds of Vision Pro assisted cataract procedures had been completed.
That’s not an isolated stunt. Named institutional deployments now include:
Mayo Clinic, using it for surgical rehearsal and emergency response training
Boston Children’s Hospital, running CyranoHealth’s nurse training app
Stryker, using myMako for orthopedic surgical planning
Cedars-Sinai, for clinician empathy training and the Xaia mental health app
Siemens Healthineers, running its Cinematic Reality anatomy visualization tool
Purdue University, building a digital twin manufacturing training hub
IDC’s Ramon T. Llamas frames the broader XR platform race, of which this is one skirmish, in terms of staying power rather than early wins.
“Meta has a strong start, but both Apple and Google bring expertise.”
Ramon T. Llamas, Research Director, IDC AR/VR, December 2025, via Next Reality
Llamas compares the current jockeying to the early smartphone platform wars of the late 2000s, where the field leader at year one wasn’t necessarily the field leader at year five. It’s a useful frame, though it’s worth being honest about scale. Hundreds of cataract procedures and 60 clinical trials are real proof points, not evidence of mainstream clinical infrastructure. The $12 billion enterprise AR/VR spend figure isn’t Vision Pro specific either. It spans Meta Quest and Pico deployments too.
The CEO Exit That Ties It Together
There’s one more thread that hasn’t been widely connected, and it makes this moment bigger than a hardware sales story. Apple announced on April 20, 2026 that Tim Cook will step down as CEO effective September 1, 2026, with hardware chief John Ternus taking over.
Ternus’s predecessor in the SVP of hardware role, Dan Riccio, stepped aside in 2021 specifically to oversee what became Vision Pro, a project TechCrunch itself has called “ill-fated.” So the product now reportedly stalled out is the same one that pulled Apple’s hardware leadership away from other priorities for years, right as the next CEO inherits a company that has to decide what spatial computing actually means for its next decade.
What This Means If You’re Building on visionOS
If you’re an enterprise IT leader, XR developer, or CTO weighing procurement decisions right now, here’s the practical read.
The de-risking case: Apple pulling back on consumer volume actually helps enterprise buyers in one narrow way. You’re no longer competing with mainstream demand for limited supply, and Apple has an obvious incentive to court exactly the ROI-driven buyers, hospitals, manufacturers, universities, that Jeronimo describes as the real opportunity.
The platform risk case: Even disputed, the MacRumors report puts long-term visionOS support on the table as a real question. Software vendors like Osso Health and Medivis, along with hospital IT teams that have already built on the platform, now need contingency plans if Apple’s investment genuinely slows, regardless of what Gruber says about internal roadmaps.
The realistic timeline: IDC doesn’t expect Vision Pro unit volume to return to 2024 levels even in 2026, forecasting 290,000 units against 390,000 two years earlier. “Enterprise niche saves Vision Pro” is a plausible trajectory. It is not yet a confirmed one.
For a parallel case study in how a bigger platform owner walks away from a metaverse bet while enterprise use cases survive on different infrastructure, see our earlier coverage of Microsoft’s Mesh shutdown and the enterprise metaverse retreat, which covers BMW’s parallel bet on NVIDIA Omniverse for industrial digital twins.
FAQ
Is Apple Vision Pro discontinued in 2026?
No. Apple still sells the M5 refreshed Vision Pro and continues shipping visionOS updates. MacRumors reported in April 2026 that Apple has largely paused active development and reassigned much of the original team, a claim independent Apple writer John Gruber has publicly disputed.
Did Apple give up on the Vision Pro?
Reports differ. MacRumors cited insider sources saying Apple stopped active development and reassigned staff. Daring Fireball’s John Gruber disputed this directly, saying it was news to Apple’s own Vision Product Group and that new hardware and visionOS 27 remain in active development.
How many Apple Vision Pro units have sold?
Roughly 600,000 units total since the February 2024 launch, per MacRumors insider sourcing, well below Apple’s original internal targets. IDC shipment data shows 390,000 units in 2024 and just 45,000 in 2025.
Is Apple Vision Pro used in hospitals?
Yes. Surgeons at SightMD performed a Vision Pro assisted cataract surgery in 2025, and institutions including Mayo Clinic, Boston Children’s Hospital, Cedars-Sinai, and UC San Diego Health use it for surgical training, rehearsal, and clinical trials.
Where This Goes Next
The consumer verdict on Vision Pro is close to final. An 88% sales collapse, a 95% ad spend cut, and a disputed but credible report of internal reassignment all point the same direction. What isn’t final is what Apple does with the platform underneath it.
Watch three things over the next six to eighteen months: whether WWDC 2026 actually delivers visionOS 27 and new hardware as Gruber predicts, whether IDC’s 290,000 unit rebound forecast for 2026 materializes or misses again, and whether hospital deployments like UC San Diego Health’s clinical trials scale from dozens of cases into standard-of-care infrastructure. Any one of those breaking clearly will settle the argument this article can’t.
IoT Data Overload: Why Most of It Never Gets Analyzed
Published July 8, 2026 · NeuralWired.com
GE Digital’s monitoring center processes more than 200 billion data tags a day from a million sensors across 5,000 power plant assets in 60-plus countries. Most companies running IoT fleets never get close to that ratio of data collected to data used. The gap between what your sensors capture and what your systems actually act on is now the defining bottleneck in enterprise IoT, and closing it has become the real argument for edge computing.
If you’re building or budgeting for an IoT data architecture in 2026, this is the article for you: enterprise architects, CTOs, and platform engineering leads who need to know what’s real in the edge computing narrative, and what’s still marketing.
IDC’s Global DataSphere research puts total IoT-generated data at roughly 79.4 zettabytes annually, a figure the firm hasn’t publicly refreshed for 2026 as of this writing. That’s about 79.4 trillion gigabytes, produced by a device population IoT Analytics counted at 21.1 billion active connections at the end of 2025, up 14% year over year.
You’ve probably seen a version of the claim that “99% of IoT data is never analyzed.” Here’s the problem: no primary 2026 source actually supports that exact number.
Fact-check note: The “only a sliver of your data gets used” claim traces back to IDC’s 2014 Digital Universe study, sponsored by EMC, which found less than 5% of the 2013 global data supply was analyzed, and just 1.5% was what IDC called “target rich,” meaning easily accessible, real-time, and high-impact. That’s the real ancestor of today’s “1%” headline framing. It’s directionally accurate but not a fresh 2026 statistic, and any article that presents it as one is passing along a decade-old number with a new coat of paint.
The underlying point still holds. As sensor costs have fallen from over $200 per unit five years ago to under $50 today, the volume of raw data generated has scaled far faster than most organizations’ capacity to analyze it. The bottleneck isn’t collection anymore. It’s filtering.
As AI’s focus shifts from training to inference, edge computing becomes necessary to address latency and privacy needs, opening business models that centralized infrastructure couldn’t support.
Paraphrased from Dave McCarthy, Research Vice President, Cloud and Edge Services, IDC · R&D World, December 2025
Why edge computing, not more cloud storage
Gartner has projected that 75% of enterprise-generated data would be processed outside a traditional centralized data center or cloud, up from under 10% in 2019. That figure has been circulating for several years now without a fresh confirmation, so treat it as directional rather than a current 2026 data point. But the architectural logic behind it hasn’t gone away: if you’re waiting for a round trip to a centralized cloud region before a factory floor sensor can trigger a shutoff valve, you’ve already lost.
AI increasingly lives closer to where data and users actually are, at the edge, on-device, in the real world, rather than centralized in the cloud.
Paraphrased from John Roese, Chief Technology Officer, Dell Technologies · R&D World, December 2025. Dell sells edge hardware, worth noting as context for this view.
Here’s where it gets messy for anyone trying to size a budget: research firms can’t agree on how big the edge computing market actually is.
Source
2025/2026 estimate
Scope
Global Market Insights
~$21.4 billion
Narrow, infrastructure-only
MarketsandMarkets
~$658.1 billion
Broad, includes adjacent AI/hardware spend
IDC (spending, not market size)
~$261 billion (2025), $380B by 2028
Enterprise edge spending, 13.8% CAGR
That’s a roughly 30x spread between the low and high estimates, entirely a function of what each firm counts as “edge computing.” If a vendor hands you a single market-size number without a methodology footnote, ask for one before it goes anywhere near a board deck.
The pilot purgatory problem
Here’s the number that should worry you more than any data-volume statistic: a widely cited McKinsey finding puts 84% of industrial IoT initiatives stuck in pilot mode, with more than a quarter stalled for over two years. Cisco’s older count put pilot survival at just 26%. Adoption isn’t the hard part. Scaling is.
Most IIoT programs collapse under vague mandates rather than specific, measurable KPIs tied to a real downtime-cost baseline.
Paraphrased from Stephan Liozu, Chief Value Officer, Zilliant; adjunct professor, Case Western Reserve University · IndustryWeek
Liozu has relayed a manufacturing CEO’s description of pilot-stage IIoT projects as stuck somewhere worse than purgatory. And the trend line isn’t improving on its own: MaintainX’s 2025 State of Industrial Maintenance survey found predictive maintenance adoption among maintenance teams actually fell, from 30% in 2024 to 27% in 2025. That’s the opposite of the smooth upward curve most vendor decks imply.
What actually works: GE and Shell’s real numbers
Skip the vendor slide decks. Here are two cases with attributable, on-record numbers.
GE Digital’s Global Electricity Monitoring and Diagnostics Center processes over 200 billion data tags daily from a million sensors across 5,000 power plant assets. Our deeper look at GE and Shell’s real IIoT ROI numbers found GE’s actual documented downtime reduction sits at 5%, notably smaller than the rounder 20% figure that circulates in secondhand retellings. That gap matters: it’s a useful reminder that even legitimate case studies get inflated as they pass through marketing copy.
Shell’s 2019 oilfield vibration and pressure-sensor deployment cost $87,000 and returned over $1 million in avoided downtime and deferred maintenance, according to IoT World Today’s reporting. It remains one of the few IIoT ROI cases with sourcing that holds up to scrutiny, which says something about how rare well-documented ROI actually is in this space.
For a sense of what this looks like outside heavy industry, our recent piece on Amazon’s smart building ROI numbers is worth a look. Same underlying discipline, different vertical.
What ties these together: Both Shell and GE’s real numbers came from narrow, specific use cases with a measurable baseline, not a company-wide “digital transformation” mandate. That’s the pattern that separates the 84% stuck in pilot mode from the ones that scale.
The accuracy gap nobody talks about
Consumer AI applications tolerate roughly 95% accuracy. Nobody’s harmed if a recommendation engine gets it wrong occasionally. Industrial systems don’t get that margin.
Consumer AI applications tolerate roughly 95% accuracy, while industrial models require near-zero error margins, 99.5% or higher, a far higher bar than most AI and edge hype accounts for.
Paraphrased from Jeff Winter, VP of Business Strategy, Critical Manufacturing · remarks at IIoT World Days 2025
That gap is why edge AI’s clearest wins so far cluster in more forgiving domains: retail checkout, consumer cameras, building automation. The highest-stakes industrial control loops, the ones the “operational intelligence” narrative loves to reference, are still catching up. If your architecture roadmap assumes consumer-grade edge AI accuracy translates directly to a chemical plant or a power turbine, that assumption needs a second look before it reaches production.
Unplanned downtime already costs U.S. industrial manufacturers around $50 billion a year, with large plants losing an average of $253 million annually. That’s the cost of inaction, and it’s the number that should anchor any edge computing business case instead of a disputed market-size figure.
Three things worth watching over the next 6 to 18 months:
The EU Cyber Resilience Act. Incident-reporting obligations begin September 11, 2026, with full obligations from December 11, 2027. Edge deployments decentralize where sensitive operational data lives, which directly expands compliance scope for manufacturers and IoT vendors.
Inference, not training, drives edge budget. The strongest current argument for edge investment isn’t raw IoT data volume anymore. It’s the shift from centralized model training to real-time inference at the point of use.
Narrow pilots with a real KPI, not company-wide mandates. Every documented ROI case in this piece started with a specific, measurable problem and a cost baseline, not a broad “digital transformation” initiative.
Our take: the data-volume framing that dominates IoT marketing (zettabytes, “you’re only using 1% of your data”) makes for a good headline but a weak business case. The number that actually gets budget approved is the cost of the downtime you’re not preventing.
FAQ
What is IoT edge processing?
IoT edge processing means analyzing or acting on sensor data close to where it’s generated, on the device or a nearby gateway, instead of sending everything to a centralized cloud data center. It reduces latency, cuts bandwidth costs, and enables real-time decisions even with limited connectivity.
How much data do IoT devices generate?
IDC estimates connected IoT devices generate roughly 79.4 zettabytes of data annually in its most recent published forecast, equivalent to about 79.4 trillion gigabytes. IDC hasn’t publicly updated this figure for 2026 as of this writing.
Why do most IoT projects fail to scale?
A widely cited McKinsey finding shows 84% of industrial IoT initiatives get stuck in pilot mode, often because they launch with vague goals like “improve efficiency” instead of a specific, measurable KPI tied to a real cost baseline.
What percentage of enterprise data is processed at the edge?
Gartner projected 75% of enterprise-generated data would be processed outside a centralized data center or cloud, up from under 10% in 2019. The figure is several years old now and should be treated as directional rather than a current data point.
How big is the edge computing market?
Estimates vary enormously: 2025 to 2026 figures range from roughly $21 billion (Global Market Insights) to over $650 billion (MarketsandMarkets), depending entirely on what’s counted as “edge computing.” Treat any single figure with caution unless the methodology is disclosed.
Want more analysis like this?
Subscribe to The Neural Loop for weekly enterprise AI and infrastructure coverage.