Strategic analysis of big tech companies: Microsoft, Google, Apple, Meta, Amazon, NVIDIA, OpenAI, and more. Enterprise moves, AI investments, and competitive intelligence decoded.
Deloitte’s AI Hallucination Cost $290K. FINRA Is WatchingEnterprise AI / Compliance
Deloitte’s AI Hallucination Cost $290K. FINRA Is Watching
The Neural Loop | NeuralWired.com
In October 2025, Deloitte admitted it used generative AI to help write a government compliance report, then had to refund part of the fee after the report turned out to be full of fake citations. If you work in finance, compliance, or risk, that sentence should stop you cold. AI hallucination in finance is no longer a theoretical risk buried in a research paper. It’s now a line item in a regulator’s oversight report, a refunded invoice, and a pattern repeating across the professional services firms that finance departments hire to be right.
This piece breaks down what actually happened, what’s verified versus vendor hype, what FINRA’s new 2026 guidance means for your compliance calendar, and what to do about it before your firm becomes the next case study.
In late 2025, Australia’s Department of Employment and Workplace Relations paid Deloitte’s Australian arm roughly AU$440,000 (about US$290,000) to review the Targeted Compliance Framework, the IT system that penalizes welfare recipients who miss job-search requirements. The 237-page report went up on the department’s website in July.
Then Dr. Chris Rudge, a University of Sydney researcher in health and welfare law, started reading it closely.
“You cannot trust the recommendations when the very foundation of the report is built on a flawed, originally undisclosed, and non-expert methodology.”
Dr. Chris Rudge, Researcher in Health and Welfare Law, University of Sydney, via Australian Financial Review
Rudge found invented academic references attributed to real scholars, including Lisa Burton Crawford at the University of Sydney and Björn Regnell at Lund University, neither of whom wrote what the report claimed they wrote. The report also included a fabricated quote it attributed to a Federal Court judgment in the Amato v Commonwealth robo-debt case, misspelling the name of the judge it invented the quote for.
Deloitte confirmed the errors. In the corrected version, published in October 2025, it disclosed for the first time that it had used an Azure OpenAI GPT-4o based tool chain, licensed by the department itself, to fill what it called “traceability and documentation gaps.” Deloitte agreed to repay the final installment of the contract. The exact refund figure was never disclosed publicly, and the department maintained the report’s underlying recommendations still stood.
Jack Castonguay, an accounting professor at Hofstra University, put it bluntly:
“It seems like it was only a matter of time. Candidly, I’m surprised it took this long for it to happen at one of the firms.”
Jack Castonguay, Associate Professor of Accounting, Hofstra University, via CFO Dive
What makes this a trend rather than a one-off is what happened next, at other firms whose entire business model rests on being trusted to get facts right.
Firm
What went wrong
Outcome
Deloitte Australia
Fabricated citations, a fake quote from a court judgment, undisclosed AI use in a government compliance report
Refunded final contract installment, corrected report reissued
EY Canada
Most citations in a loyalty-program safeguards report were hallucinated, including a nonexistent McKinsey citation, per an investigation by AI-detection firm GPTZero
Study withdrawn, per Financial Times reporting
Sullivan & Cromwell
AI-assisted court filing contained inaccurate citations and misquoted the U.S. Bankruptcy Code
Firm apologized to the New York court
Three incidents, three firms, roughly a twelve-month window. None of these are consumer chatbot slip-ups. These are paid deliverables from firms whose entire pitch is analytical rigor.
Regulators Just Made This a Compliance Issue
On December 9, 2025, FINRA published its 2026 Annual Regulatory Oversight Report and, for the first time, gave generative AI its own dedicated section. The report names hallucinations and bias explicitly as risks firms must manage, and it tells firms weighing AI agent deployment to evaluate whether that autonomy creates new supervisory or operational obligations.
FINRA also pushed firms to build testing and monitoring specifically around GenAI accuracy, integrity, and reliability, including ongoing output logging and model tracking rather than a one-time compliance check.
Important nuance: FINRA’s report doesn’t create new binding rules. It signals what examiners will prioritize throughout 2026. Treat it as a preview of what your next exam will ask for, not a law you’re already breaking.
Meanwhile, the EU AI Act’s transparency requirements for high-risk systems take effect on August 2, 2026, with penalties running up to €35 million or 7% of global annual turnover for noncompliance. That one is a hard deadline, not guidance. Full text and compliance timelines are available directly from FINRA’s 2026 Annual Regulatory Oversight Report.
Why This Can’t Just Be Engineered Away
Here’s the part vendors selling “hallucination-free” AI tools would rather you not read closely. In 2024, researchers Ziwei Xu, Sanjay Jain, and Mohan Kankanhalli formally proved, using computational learning theory, that hallucination cannot be fully eliminated from large language models. Their argument: since the formal systems they modeled are a simplified subset of the real world, and hallucination is unavoidable even in that simplified case, it’s unavoidable in the messier real world too.
A separate 2024 paper reached the same conclusion by a different route entirely, tying the problem to the mathematical structure of LLMs themselves and, notably, to Gödel’s First Incompleteness Theorem. Two independent proofs, two different mathematical toolkits, same conclusion. That convergence matters. It means the realistic goal for any finance or compliance team isn’t zero hallucination. It’s traceability: knowing exactly where a given AI output came from and who checked it before it went out the door.
The Numbers Finance Leaders Should Actually Trust
A lot of dramatic statistics circulate around this topic, including some that trace back to vendor blogs rather than verifiable research. Here’s what’s actually sourced and defensible.
Metric
Figure
Source
Hallucination rate on complex financial reasoning tasks
10 to 20%
FAITH framework academic benchmark
Model accuracy on simple lookups vs. multivariate calculations
95.6% down to near 0%
FAITH / FinVerBench benchmark
Enterprises with production RAG systems that had a hallucination incident in the past year
67%
Gartner survey
Firms saying guardrails gave a false sense of security
41%
Gartner survey
Average cost per RAG-misinformation incident, regulated industries
$2.4 million
IDC, March 2026
Global AI governance platform spend
$492 million in 2026, over $1 billion by 2030
Gartner newsroom, Feb 2026
That last figure comes straight from a primary source. Gartner Director Analyst Lauren Kornutick noted that fragmented AI regulation is expected to quadruple by 2030 and extend to roughly 75% of the world’s economies, which is a meaningful part of why governance spend is climbing so fast. See the full Gartner release for the underlying methodology.
Worth naming directly: figures like “$2.3 billion in Q1 2026 trading losses from AI-misstated earnings” and specific hedge fund loss numbers you may have seen elsewhere trace back to vendor marketing content, not independently verifiable reporting. Treat single-source vendor statistics with the same skepticism you’d apply to an unverified AI output. That’s not a throwaway line either. It’s the whole point of this article.
The Uncomfortable Counterpoint
The industry’s default fix for hallucination is retrieval-augmented generation, RAG for short: ground the model’s answers in your own verified documents instead of letting it generate from memory alone. It helps. Commonly cited reductions run 40 to 71% depending on implementation quality.
But Gartner’s 67% figure above is the uncomfortable part. Most enterprises running production RAG systems still had at least one hallucination incident last year. Nearly half said their guardrails created false confidence rather than actual protection. RAG narrows the problem. It doesn’t close it, and given the formal proofs discussed above, it structurally can’t.
Nikki MacKenzie, an assistant professor at Georgia Tech’s Scheller College of Business, frames the real fix as procedural, not technical:
“The responsibility still sits with the professional using it. Accountants have to own the work, check the output, and apply their judgment rather than copy and paste whatever the system produces.”
Nikki MacKenzie, Assistant Professor, Georgia Institute of Technology’s Scheller College of Business, via CFO Dive
Our read: the firms getting burned aren’t the ones using AI. They’re the ones treating AI output as a finished product instead of a first draft that still needs a human signature.
What Finance and Compliance Teams Should Do Now
Build source traceability into every AI-assisted workflow. Every claim, number, or citation generated with AI assistance needs a documented, checkable origin before it leaves the building.
Treat FINRA’s 2026 report as your exam prep, not optional reading. Expect examiners to ask for model risk management documentation and testing logs for GenAI tools specifically.
Map your EU exposure now, not in July 2026. If any part of your operation touches EU customers or markets, the August 2, 2026 high-risk transparency deadline applies regardless of where you’re headquartered.
Stop chasing the lowest hallucination-rate benchmark. Bryan Lapidus, FP&A Practice Director at the Association for Financial Professionals, summed up the mindset shift finance teams need:
“This situation underscores a critical lesson for finance professionals: AI isn’t a truth-teller. It’s a tool meant to provide answers that fit your questions.”
Bryan Lapidus, FP&A Practice Director, Association for Financial Professionals, via CFO Dive
Require human sign-off on anything client-facing or regulator-facing. Deloitte’s internal analytical workflow became a public problem the moment it was published. Assume the same could happen to yours.
Frequently Asked Questions
What is an AI hallucination?
An AI hallucination is fluent, confident-sounding output from a language model that is factually wrong or entirely fabricated, including invented statistics, citations, quotes, or case law that don’t actually exist.
Can AI hallucinations be eliminated?
No. Researchers Xu, Jain, and Kankanhalli formally proved elimination is mathematically impossible in 2024, and a separate paper reached the same conclusion using Gödel’s incompleteness theorem. Mitigation and traceability, not elimination, are the realistic goals.
How much do AI hallucinations cost businesses?
Costs vary by domain and are hard to verify precisely. IDC estimates $2.4 million per RAG-misinformation incident in regulated industries. The clearest verified real-world example remains Deloitte Australia’s partial refund of its AU$440,000 government report.
Does RAG stop AI hallucinations?
RAG reduces hallucinations, commonly by 40 to 71%, but doesn’t eliminate them. A 2026 Gartner survey found 67% of enterprises running production RAG systems still had at least one hallucination incident in the past year.
What did FINRA say about AI hallucinations in 2026?
FINRA’s 2026 Annual Regulatory Oversight Report, published December 9, 2025, added a dedicated GenAI section naming hallucinations and bias as risks firms must test for and govern. It signals 2026 examination priorities rather than creating new binding rules.
Where This Goes From Here
Eighteen months ago, AI hallucination was a chatbot-demo curiosity, a wrong answer about the James Webb telescope, an airline chatbot promising a refund policy that didn’t exist. Now it’s a named risk category in a financial regulator’s annual report and a documented reason a Big Four firm refunded a national government.
Watch three things over the next six to eighteen months: how FINRA’s 2026 examinations actually treat GenAI documentation in practice, whether the EU AI Act’s August enforcement date produces real penalties or mostly warnings, and whether the guardrails market, on track to grow from under $1 billion to over $100 billion by 2034, actually reduces incident rates or just gets better at making firms feel safer than they are.
The lesson from Deloitte, EY, and Sullivan & Cromwell isn’t that AI is too risky to use. It’s that treating AI output as finished work, instead of a draft that needs a human name attached to it, is what actually gets expensive.
Shell turned an $87,000 sensor bet into more than $1 million in returns. Most industrial IoT projects never get that far. Here’s the actual math behind the ones that do.
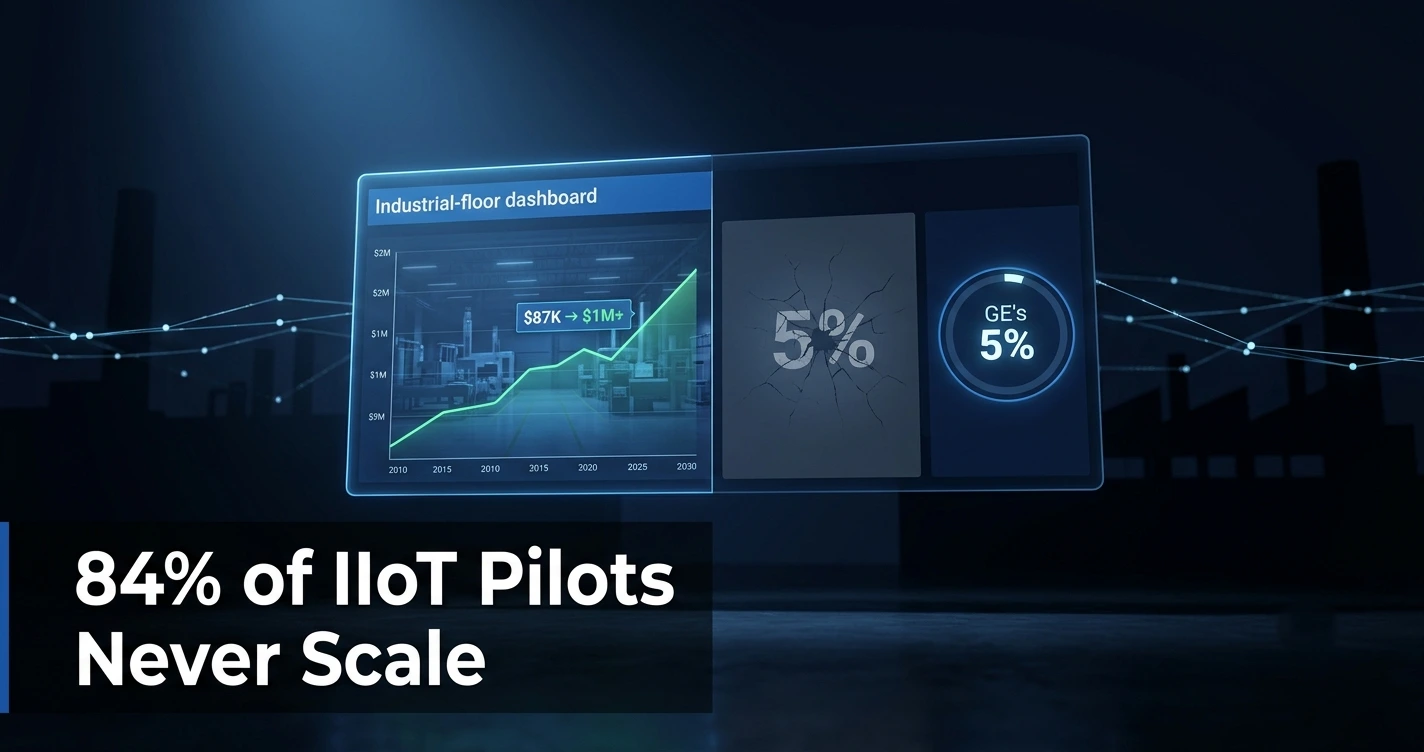
In 2019, Shell wired up an aging oilfield with $87,000 worth of vibration and pressure sensors. The payout: over $1 million in avoided downtime and deferred maintenance, a return that would make any CFO sit up. That story gets quoted constantly in industrial IoT (IIoT) marketing decks. What doesn’t get quoted nearly as often: 84% of IoT projects never make it past the pilot stage, and more than a quarter of those stay stuck there for over two years.
If you’re a plant manager weighing a predictive maintenance rollout, both of those facts matter. This piece walks through what unplanned downtime actually costs, why so many IIoT projects stall before they scale, and how to build an ROI case that survives contact with a skeptical board.
Start with the number that justifies everything else: unplanned downtime costs U.S. industrial manufacturers roughly $50 billion a year. The average large plant loses about $253 million annually to breakdowns. For Fortune 500 manufacturers, that works out to $2.8 billion a year, close to 11% of revenue, vanishing into machines that stopped when they weren’t supposed to.
It’s not a rare event, either. 82% of manufacturers reported unplanned downtime in the past three years, and the average factory loses roughly 800 hours a year to breakdowns that, in theory, sensors could have flagged in advance.
Here’s where the hardware math has flipped in the plant manager’s favor. Basic industrial IoT sensors now run under $50 a unit, down from over $200 five years ago. A North American plant runs an average of 365 IIoT devices today. Cost is no longer the bottleneck it was in 2019. That changes the calculus: a small, targeted pilot on two or three critical machines is now cheap enough to fund out of an existing maintenance budget, which means you don’t need to wait for a capex approval cycle to test the idea.
Why Most IIoT Projects Never Scale
So if the hardware is cheap and the downtime math is brutal, why isn’t every plant running on sensors already?
Because most projects stall. A McKinsey study, still widely cited years later, found 84% of industrial IoT initiatives get stuck in what the industry now calls “pilot purgatory,” and 28% of those stay there for more than two years. More recent tallies put the failure-to-scale rate above 60%, and Cisco’s older but still-referenced figure puts pilot survival at just 26%.
“It is not purgatory, it is hell!”
Manufacturing CEO, quoted by Stephan Liozu, Chief Value Officer at Zilliant and adjunct professor at Case Western Reserve University’s Weatherhead School of Management, via IndustryWeek
Liozu isn’t a fringe voice here. His point, backed by McKinsey’s own data, is that most IIoT programs collapse under the weight of vague mandates like “improve efficiency” instead of a specific, measurable KPI tied to a named line and a real downtime-cost baseline.
Adoption data backs up the stall-out pattern. According to MaintainX’s 2025 State of Industrial Maintenance survey, predictive maintenance adoption among maintenance teams actually dropped, from 30% in 2024 to 27% in 2025. That’s not the smooth upward curve you’d expect from the marketing. Only 46% of manufacturers have deployed IIoT at the facility level at all, and per McKinsey’s more recent numbers, just 25 to 30% of large manufacturers have scaled beyond a pilot to an enterprise-wide rollout.
Watch this number: Global IIoT market-size estimates for 2026 range from roughly $190 billion (Mordor Intelligence) to over $500 billion (Precedence Research), depending entirely on how each firm defines the market’s scope. When a vendor pitches you urgency based on “the $500 billion IIoT market,” ask which definition they’re using. The spread alone should make you skeptical of any single headline figure used to justify a purchase decision.
Jeff Winter, VP of Business Strategy at Critical Manufacturing, put the technical side of the problem bluntly at IIoT World Days 2025: consumer AI succeeds at around 95% accuracy, but industrial models need a near-zero margin for error, 99.5% or higher. That’s a much higher bar than most of the AI hype cycle accounts for, and it’s a big part of why pilots that look great in a demo fall apart on a real production line.
What Actually Works: Two Real Cases
Strip away the invented statistics you’ll find floating around IIoT marketing content (there’s no verified source for some of the dollar figures companies get credited with online, so treat any suspiciously precise claim with caution) and two real, attributable cases hold up.
Shell: $87,000 In, $1 Million Out
Shell’s oilfield asset-monitoring project is the cleanest real-world proof point available. An $87,000 sensor investment on aging equipment generated over $1 million in returns through avoided downtime and deferred maintenance, according to IoT World Today’s reporting. It’s not a hypothetical ROI model. It’s a documented result from a company that had every incentive to keep quiet if the numbers hadn’t worked out.
GE: The Real Numbers Behind the Headline
GE Digital’s Global Electricity Monitoring and Diagnostics Center processes over 200 billion data tags daily from a million sensors across 5,000 assets in power plants in more than 60 countries. Bill Ruh, then-CEO of GE Digital, put the actual, on-record result this way when the platform launched:
“These analytics provide GE Digital with the unique ability to reduce unplanned downtime by up to 5 percent, reduce false alarms by up to 75 percent, and reduce operations and maintenance costs by up to 25 percent.”
Bill Ruh, then-CEO, GE Digital, GE News press release, October 2017
Notice that’s 5%, not the round 20% figure that circulates in some secondhand summaries. It’s a smaller number, but it’s GE’s own, and it comes with a false-alarm reduction and O&M cost figure attached that most retellings leave out entirely.
Predictive Maintenance: The Realistic Range
Zooming out from single-company cases, here’s where independent research firms land on predictive maintenance’s actual impact:
Metric
Range
Source
Maintenance cost reduction
Up to 25%
Deloitte
Uptime increase
10% to 20%
Deloitte
Downtime reduction (upper bound)
Up to 50%
McKinsey & Co.
Asset lifespan extension (upper bound)
Up to 40%
McKinsey & Co.
Treat the upper-bound figures as ceiling cases, not defaults. A well-scoped, single-line pilot is far more likely to land near the lower end of these ranges in its first year.
Building an ROI Case That Survives the Board
Here’s the actual formula, stripped of vendor gloss: ROI equals annual savings minus annual program cost, divided by annual program cost, times 100. Annual savings breaks down into avoided downtime cost plus avoided emergency maintenance spend, measured against a pre-deployment baseline you establish before you install a single sensor.
A few things the data says you need to get right:
Use your own downtime-cost-per-hour, not an industry average. The $50 billion industry figure is a scale-setter, not an input for your specific calculator.
Stress-test your assumptions by plus or minus 30% before presenting to a board. This is standard practice recommended in IoT World’s own project-scoping framework, and it heads off the “your numbers were too optimistic” objection before it happens.
Budget for realistic retrofit costs. End-to-end IIoT retrofits run anywhere from $1 million to over $10 million depending on facility size and complexity, per Emergen Research. A sub-$50,000 sensor pilot is a very different financial commitment than a plant-wide rollout, and conflating the two in a pitch deck is a fast way to lose credibility.
Set a payback-period expectation that matches your scope. Well-scoped single-line predictive maintenance pilots often show payback in 6 to 18 months. Enterprise-wide rollouts typically take two years or more, and that’s exactly the scope where the pilot-purgatory failure rate climbs.
Our read: the smartest move for most plant managers right now isn’t the big enterprise-wide business case. It’s the small, self-funded pilot on one or two lines, with a hard KPI and a real downtime-cost baseline attached, that proves the model before anyone has to ask a board for millions.
Frequently Asked Questions
How do you calculate ROI for an IIoT project?
ROI equals annual savings minus annual program cost, divided by annual program cost, times 100. Savings combine avoided downtime cost and avoided emergency maintenance spend, measured against a pre-deployment baseline established before installation begins.
How much does unplanned downtime cost manufacturers?
Unplanned downtime costs U.S. industrial manufacturers roughly $50 billion annually. The average large plant loses about $253 million a year, and Fortune 500 manufacturers lose around $2.8 billion annually, close to 11% of revenue.
What percentage of IoT projects fail to scale?
Estimates vary, but a widely cited McKinsey finding shows 84% of industrial IoT projects remain stuck in pilot mode, with more than a quarter stalled for over two years, a pattern the industry calls “pilot purgatory.”
How much can predictive maintenance reduce downtime?
Deloitte and McKinsey benchmarks put predictive-maintenance-driven downtime reduction between 25% and 50%, with maintenance cost savings of 10% to 25%. Results vary heavily by industry, equipment type, and deployment maturity.
What’s a realistic payback period for an industrial IoT project?
Well-scoped, single-line predictive maintenance pilots often show payback within 6 to 18 months. Enterprise-wide rollouts typically take two years or longer, and a meaningful share stall out indefinitely before reaching that point.
What to Watch Next
Three things worth tracking over the next 6 to 18 months: whether predictive maintenance adoption recovers from its 2025 dip or keeps sliding, whether sub-$50 sensor pricing pulls more mid-size manufacturers past the 46% facility-level adoption mark, and whether the gap between market-size hype and the 25 to 30% enterprise-scaling rate starts to close.
None of that changes the math you need today. Get your own downtime-cost baseline, run the small pilot, stress-test the assumptions, and let the numbers, not the vendor slide deck, make the case.
Want the next breakdown like this one delivered straight to you?Subscribe to The Neural Loop for weekly analysis on industrial AI, robotics, and the infrastructure behind it.
Enterprise Metaverse 2026: Why Digital Twins Survived the Hype CrashEnterprise Tech / Spatial Computing
The Metaverse Hype Died. BMW and NVIDIA’s Factory Bet Didn’t
By NeuralWired Staff · Updated July 2026 · 11 min read
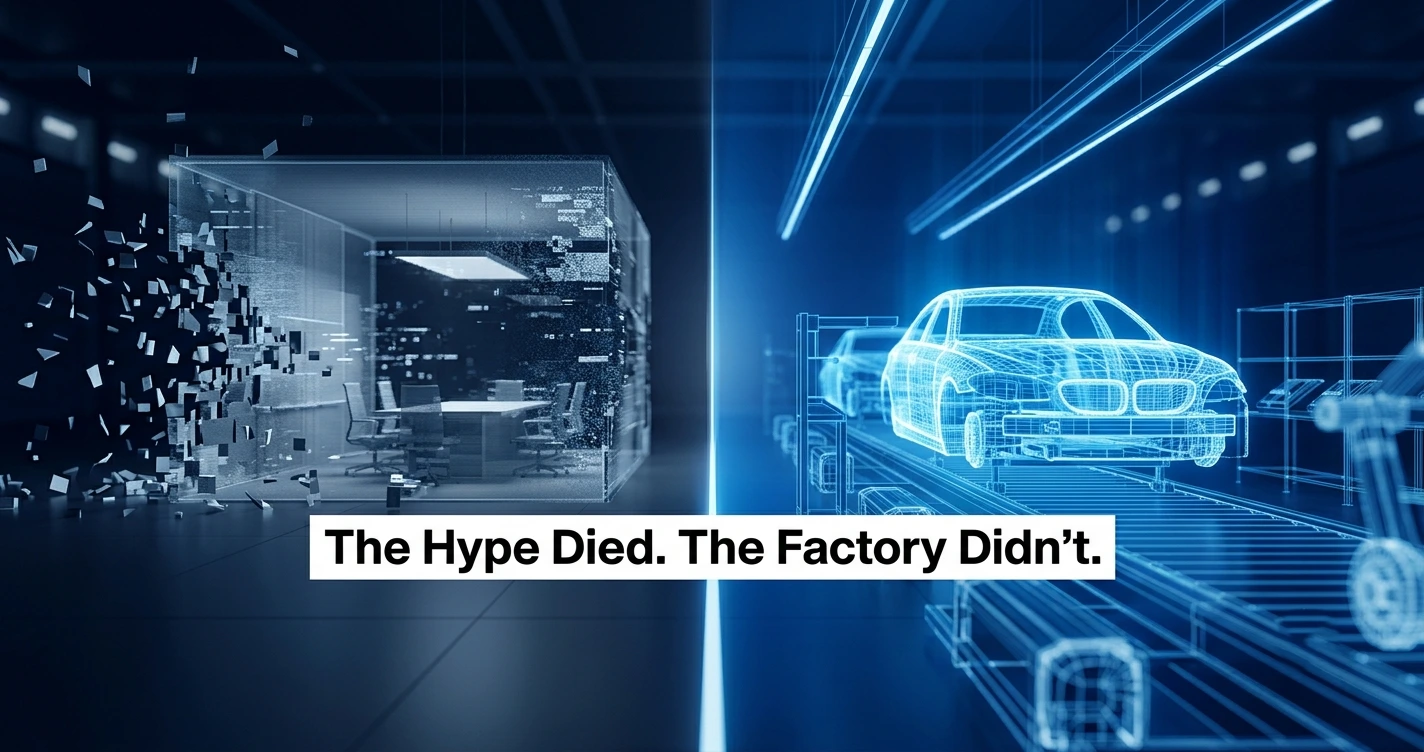
Microsoft shut down Mesh, its 3D collaboration app, on December 1, 2025. Meta froze new features on Horizon Worlds four months later, then reversed course within days. If you’re an IT leader who budgeted for “the metaverse” in 2023, both moves probably feel like a warning. Here’s the part the headlines are missing: while the consumer metaverse was collapsing, BMW quietly used NVIDIA’s Omniverse platform to cut its factory planning costs by up to 30%, and digital twin patent filings jumped 600% since 2017. The enterprise metaverse didn’t die. It just stopped pretending to be a social network.
Start with the timeline, because it matters. Microsoft didn’t just quietly deprecate a feature. It retired the standalone Mesh app, shut down mesh.cloud.microsoft, and pulled the avatar-based “Immersive spaces (3D)” view out of Teams entirely, according to Computerworld’s reporting. In its place: “immersive events in Teams,” a narrower tool built for scheduled gatherings like training sessions and product showcases, not everyday meetings.
That follows Microsoft’s earlier decision to stop making HoloLens 2, despite a reported $22 billion U.S. Army headset contract still on the books. Read those two decisions together and the message is blunt: general-purpose 3D avatar meetings never found a real audience inside the enterprise.
Meta’s retreat was messier. In March 2026 the company said it would stop adding new features to Horizon Worlds, effectively freezing its flagship consumer metaverse product, then partially reversed the decision days later, promising the platform would stay available on Quest. Reality Labs, Meta’s metaverse division, has lost more than $70 billion since 2021. The money didn’t vanish. It moved. Meta is directing over $115 billion toward AI infrastructure in 2026 alone, mostly data centers.
“They glommed on to the term ‘metaverse’ without really understanding the concept. Their efforts on their metaverse strategy seemed completely indifferent to what previous platforms had learned.”
Wagner James Au, author of “Making a Metaverse That Matters,” via reporting republished by The Cool Down, March 2026
Here’s the thing worth saying plainly: you’ll see headline stats claiming Decentraland has as few as 38 daily active users, or citing wildly specific engagement collapses for Horizon Worlds. Treat those as reported, not confirmed. They trace back to secondary aggregators, not platform disclosures. The confirmed story, Mesh’s shutdown and Reality Labs’ documented losses, is damning enough on its own without inflating it further.
Why this matters for your 2026 budget
Mesh’s retirement removed the “safe default” many IT departments had quietly budgeted around for general 3D collaboration. If your metaverse line item was built on Mesh or a Mesh-style platform, you now need to re-scope it. The question isn’t “should we still do metaverse.” It’s “which specific use case were we actually solving for.”
What Survived: BMW, NVIDIA, and the Digital Twin
While Mesh was winding down, BMW Group was scaling up. The automaker runs FactoryExplorer, a digital twin platform built on NVIDIA Omniverse, across its Debrecen plant and others. According to BMW’s own press materials and a joint case study with NVIDIA, the platform is projected to cut production planning costs by up to 30% and has already shrunk a collision-check process from four weeks down to three days.
That’s a name-brand company, publishing its own numbers, about a use case with nothing to do with avatars or virtual meetings. It’s industrial simulation: modeling a real factory floor before anyone moves a single robot arm.
A stat to ignore, and one to trust
You’ll find blog posts claiming “BMW reduces manufacturing design errors by 40%.” That figure doesn’t appear in BMW’s or NVIDIA’s own materials. It looks like paraphrase drift from the real, sourced number: a 30% reduction in planning costs. When you’re citing this case study, stick to the 30% figure and attribute it directly to BMW and NVIDIA.
Digital twins as a category are growing faster, and more quietly, than “metaverse” as a whole ever did. The global digital twin market sat at roughly $33.97 billion in 2026, with projections putting it near $384.79 billion by 2034, a 35.4% compound annual growth rate, per PatSnap’s industry analysis. More telling than any market-size projection: digital twin patent filings rose 600% between 2017 and 2025, with 2,451 filed in 2025 alone. Patents are harder to fabricate than survey numbers. That’s real engineering work, not marketing spend.
Consumer Metaverse vs. Enterprise Digital Twin: What Changed
Signal
Consumer Metaverse
Enterprise Digital Twin
2025-2026 trajectory
Microsoft Mesh retired; Meta froze then partially reversed Horizon Worlds
BMW/NVIDIA Omniverse scaling across multiple plants
Investment direction
Meta redirecting ~$115B toward AI infrastructure in 2026
Patent filings up 600% since 2017 (2,451 in 2025 alone)
Buyer
Consumer / social user
Manufacturing, operations, engineering teams
Documented ROI
Largely unverified engagement claims
BMW: 30% planning cost reduction (named, sourced)
Where the Real ROI Is: VR Training at UPS, Boeing, and Shell
Metrigy’s late-2024 survey of roughly 400 companies found that 16.5% planned to invest in VR or AR by the end of 2025. Irwin Lazar, the firm’s president and principal analyst, doesn’t dress that up as a boom.
“Use cases tend to be very targeted around training, product demonstrations, engineering and design, and customer engagement rather than for general purpose meetings. We expect to see slow continued growth, but I don’t see these kinds of virtual reality tools being more than a niche market going forward.”
Irwin Lazar, President and Principal Analyst, Metrigy, quoted in Computerworld, December 2025
Niche isn’t the same as fake. It’s the difference between a platform strategy and a tool that solves one specific, expensive problem. UPS used VR to cut driver safety training time from eight hours to two, a 75% reduction, per its case study with ArborXR. Boeing’s published case study materials report a 75% cut in training time alongside first-attempt assembly accuracy improving from 50% to 90%. Shell reports a 30% reduction in VR-related training costs. Three different industries, three specific, named, attributable results.
The one stat you’ll see everywhere and should stop trusting
Claims like “VR training is 4x faster” or drives a “275% increase in confidence” trace back almost entirely to a single 2020 PwC soft-skills training study covering 12 U.S. locations. That study has been re-cited, and quietly altered, across dozens of VR vendor blogs from 2022 through 2026. If you see it, attribute it correctly: a 2020 PwC study, not fresh 2026 research.
The Uncomfortable Part: Pilots That Never Scale
Digital twins are the strongest enterprise metaverse use case on paper. They’re also the clearest example of a gap between piloting something and actually running it. Research cited by Gartner found that 75% of organizations that piloted digital twins struggled to scale past that initial pilot stage, even as 70% or more of manufacturers in aerospace, automotive, electronics, and energy are actively piloting or deploying the technology.
Remember Gartner’s own 2022 prediction that 25% of people would spend at least an hour a day in the metaverse by 2026? Search results as of mid-2026 show no corroborating usage data anywhere near that figure in enterprise contexts. That prediction should be read as unmet, not as a forecast still quietly ticking toward true.
“The current hardware suffers from limitations like a small field of view, heavy designs, motion sickness and poor graphics. The future of the metaverse lies in the hands of technologies in AI, 5G, edge computing, and display like microLEDs and better optics that are still to come before it can be fully realized.”
Bob Gourley, CTO, OODA, quoted in Live Science, March 2026
Not everyone reads the pullback as failure. Futurist Mark van Rijmenam frames it as a maturing phase rather than an ending.
“It’s maturing into something more meaningful than the hype once promised. What felt like abandonment was actually a pivot beneath the surface. It’s being rebuilt with purpose, not PR, and with technology that’s actually ready for the spatial internet.”
Mark van Rijmenam, futurist and author, quoted in Live Science, March 2026
Our read: both things are true at once. BMW’s numbers are real. So is the 75% pilot-to-scale failure rate. If digital twin platforms end up following Mesh’s pattern, real vendor investment, genuine flagship wins, but no generalization past a handful of marquee customers, the “enterprise metaverse survived” story could look premature within 18 to 24 months. Worth watching, not worth ignoring.
What to Actually Budget For in 2026 and 2027
If you’re the one signing off on next year’s spatial computing line item, here’s the practical shift. Stop buying “a metaverse strategy.” Start buying three separate, narrower things:
Digital twin infrastructure for a single production line or facility, evaluated against a specific cost or downtime metric, not a company-wide platform rollout.
VR training modules for one high-cost, high-risk skill (driver safety, assembly precision, hazardous-environment procedures), measured against your own current training time and error rates, not a vendor’s recycled 2020 case study.
Scheduled immersive events, Microsoft’s own replacement category, for large training sessions or product showcases, not daily team meetings.
McKinsey’s research on predictive-maintenance digital twins found downtime reductions of 30% to 50% and maintenance cost cuts of 10% to 40%, a wide but credible range rather than one suspiciously precise headline number. That’s the pattern to look for in any vendor pitch you get this year: named companies, ranges instead of round numbers, and a use case narrow enough that you could measure it in one quarter.
Key insight
Market-size figures for “the metaverse” range from $85 billion to over $2.1 trillion for the same year, depending entirely on whether a given research firm folds in gaming and e-commerce spend. There’s no shared definition. Treat any single headline market-size number as one firm’s estimate, never as settled fact.
Frequently Asked Questions
Is the metaverse dead in 2026?
Not as a single answer. Consumer and social metaverse platforms like Horizon Worlds and Decentraland have seen real pullbacks, including a feature freeze at Meta. Enterprise applications in digital twins, industrial training, and design collaboration continue with measurable, named-company ROI, like BMW’s 30% factory planning cost reduction with NVIDIA Omniverse.
Did Microsoft shut down Mesh?
Yes. Microsoft retired the standalone Mesh 3D app and its avatar-based “Immersive spaces” feature in Teams on December 1, 2025, replacing it with a narrower “immersive events” feature aimed at scheduled large gatherings rather than everyday meetings.
What is a digital twin in the enterprise metaverse?
A digital twin is a continuously updated virtual replica of a physical asset, process, or facility. Companies like BMW use it to simulate and test changes, like factory layouts or collision checks, before applying them in the real world, cutting both cost and risk.
Does VR training actually work for businesses?
Yes, with real attributable results: UPS cut driver safety training time by 75%, and Boeing reports the same reduction alongside assembly accuracy gains from 50% to 90%. However, many widely cited VR training statistics trace back to a single 2020 PwC study and should be treated as one aging data point, not new 2026 research.
The Bottom Line
The metaverse, as a single procurement category, is over. What’s left is three separate, defensible technology bets: digital twins with documented industrial ROI, VR training for specific high-cost skills, and scheduled immersive events for large-scale gatherings. None of them need avatars. None of them need a headset strategy company-wide. Over the next six to eighteen months, watch three things: whether digital twin adoption starts closing that 75% pilot-to-scale gap, whether Meta’s AI-infrastructure pivot quietly starves Horizon Worlds for good, and whether mid-market manufacturers start showing up in NVIDIA and Siemens case studies alongside BMW. That last one is the real test of whether “enterprise metaverse” is a durable category or just a slower-motion version of the same hype cycle.
Enterprise Metaverse 2026: Why Digital Twins Survived the Hype CrashEnterprise Tech / Spatial Computing
The Metaverse Hype Died. BMW and NVIDIA’s Factory Bet Didn’t
By NeuralWired Staff · Updated July 2026 · 11 min read
Microsoft shut down Mesh, its 3D collaboration app, on December 1, 2025. Meta froze new features on Horizon Worlds four months later, then reversed course within days. If you’re an IT leader who budgeted for “the metaverse” in 2023, both moves probably feel like a warning. Here’s the part the headlines are missing: while the consumer metaverse was collapsing, BMW quietly used NVIDIA’s Omniverse platform to cut its factory planning costs by up to 30%, and digital twin patent filings jumped 600% since 2017. The enterprise metaverse didn’t die. It just stopped pretending to be a social network.
Start with the timeline, because it matters. Microsoft didn’t just quietly deprecate a feature. It retired the standalone Mesh app, shut down mesh.cloud.microsoft, and pulled the avatar-based “Immersive spaces (3D)” view out of Teams entirely, according to Computerworld’s reporting. In its place: “immersive events in Teams,” a narrower tool built for scheduled gatherings like training sessions and product showcases, not everyday meetings.
That follows Microsoft’s earlier decision to stop making HoloLens 2, despite a reported $22 billion U.S. Army headset contract still on the books. Read those two decisions together and the message is blunt: general-purpose 3D avatar meetings never found a real audience inside the enterprise.
Meta’s retreat was messier. In March 2026 the company said it would stop adding new features to Horizon Worlds, effectively freezing its flagship consumer metaverse product, then partially reversed the decision days later, promising the platform would stay available on Quest. Reality Labs, Meta’s metaverse division, has lost more than $70 billion since 2021. The money didn’t vanish. It moved. Meta is directing over $115 billion toward AI infrastructure in 2026 alone, mostly data centers.
“They glommed on to the term ‘metaverse’ without really understanding the concept. Their efforts on their metaverse strategy seemed completely indifferent to what previous platforms had learned.”
Wagner James Au, author of “Making a Metaverse That Matters,” via reporting republished by The Cool Down, March 2026
Here’s the thing worth saying plainly: you’ll see headline stats claiming Decentraland has as few as 38 daily active users, or citing wildly specific engagement collapses for Horizon Worlds. Treat those as reported, not confirmed. They trace back to secondary aggregators, not platform disclosures. The confirmed story, Mesh’s shutdown and Reality Labs’ documented losses, is damning enough on its own without inflating it further.
Why this matters for your 2026 budget
Mesh’s retirement removed the “safe default” many IT departments had quietly budgeted around for general 3D collaboration. If your metaverse line item was built on Mesh or a Mesh-style platform, you now need to re-scope it. The question isn’t “should we still do metaverse.” It’s “which specific use case were we actually solving for.”
What Survived: BMW, NVIDIA, and the Digital Twin
While Mesh was winding down, BMW Group was scaling up. The automaker runs FactoryExplorer, a digital twin platform built on NVIDIA Omniverse, across its Debrecen plant and others. According to BMW’s own press materials and a joint case study with NVIDIA, the platform is projected to cut production planning costs by up to 30% and has already shrunk a collision-check process from four weeks down to three days.
That’s a name-brand company, publishing its own numbers, about a use case with nothing to do with avatars or virtual meetings. It’s industrial simulation: modeling a real factory floor before anyone moves a single robot arm.
A stat to ignore, and one to trust
You’ll find blog posts claiming “BMW reduces manufacturing design errors by 40%.” That figure doesn’t appear in BMW’s or NVIDIA’s own materials. It looks like paraphrase drift from the real, sourced number: a 30% reduction in planning costs. When you’re citing this case study, stick to the 30% figure and attribute it directly to BMW and NVIDIA.
Digital twins as a category are growing faster, and more quietly, than “metaverse” as a whole ever did. The global digital twin market sat at roughly $33.97 billion in 2026, with projections putting it near $384.79 billion by 2034, a 35.4% compound annual growth rate, per PatSnap’s industry analysis. More telling than any market-size projection: digital twin patent filings rose 600% between 2017 and 2025, with 2,451 filed in 2025 alone. Patents are harder to fabricate than survey numbers. That’s real engineering work, not marketing spend.
Consumer Metaverse vs. Enterprise Digital Twin: What Changed
Signal
Consumer Metaverse
Enterprise Digital Twin
2025-2026 trajectory
Microsoft Mesh retired; Meta froze then partially reversed Horizon Worlds
BMW/NVIDIA Omniverse scaling across multiple plants
Investment direction
Meta redirecting ~$115B toward AI infrastructure in 2026
Patent filings up 600% since 2017 (2,451 in 2025 alone)
Buyer
Consumer / social user
Manufacturing, operations, engineering teams
Documented ROI
Largely unverified engagement claims
BMW: 30% planning cost reduction (named, sourced)
Where the Real ROI Is: VR Training at UPS, Boeing, and Shell
Metrigy’s late-2024 survey of roughly 400 companies found that 16.5% planned to invest in VR or AR by the end of 2025. Irwin Lazar, the firm’s president and principal analyst, doesn’t dress that up as a boom.
“Use cases tend to be very targeted around training, product demonstrations, engineering and design, and customer engagement rather than for general purpose meetings. We expect to see slow continued growth, but I don’t see these kinds of virtual reality tools being more than a niche market going forward.”
Irwin Lazar, President and Principal Analyst, Metrigy, quoted in Computerworld, December 2025
Niche isn’t the same as fake. It’s the difference between a platform strategy and a tool that solves one specific, expensive problem. UPS used VR to cut driver safety training time from eight hours to two, a 75% reduction, per its case study with ArborXR. Boeing’s published case study materials report a 75% cut in training time alongside first-attempt assembly accuracy improving from 50% to 90%. Shell reports a 30% reduction in VR-related training costs. Three different industries, three specific, named, attributable results.
The one stat you’ll see everywhere and should stop trusting
Claims like “VR training is 4x faster” or drives a “275% increase in confidence” trace back almost entirely to a single 2020 PwC soft-skills training study covering 12 U.S. locations. That study has been re-cited, and quietly altered, across dozens of VR vendor blogs from 2022 through 2026. If you see it, attribute it correctly: a 2020 PwC study, not fresh 2026 research.
The Uncomfortable Part: Pilots That Never Scale
Digital twins are the strongest enterprise metaverse use case on paper. They’re also the clearest example of a gap between piloting something and actually running it. Research cited by Gartner found that 75% of organizations that piloted digital twins struggled to scale past that initial pilot stage, even as 70% or more of manufacturers in aerospace, automotive, electronics, and energy are actively piloting or deploying the technology.
Remember Gartner’s own 2022 prediction that 25% of people would spend at least an hour a day in the metaverse by 2026? Search results as of mid-2026 show no corroborating usage data anywhere near that figure in enterprise contexts. That prediction should be read as unmet, not as a forecast still quietly ticking toward true.
“The current hardware suffers from limitations like a small field of view, heavy designs, motion sickness and poor graphics. The future of the metaverse lies in the hands of technologies in AI, 5G, edge computing, and display like microLEDs and better optics that are still to come before it can be fully realized.”
Bob Gourley, CTO, OODA, quoted in Live Science, March 2026
Not everyone reads the pullback as failure. Futurist Mark van Rijmenam frames it as a maturing phase rather than an ending.
“It’s maturing into something more meaningful than the hype once promised. What felt like abandonment was actually a pivot beneath the surface. It’s being rebuilt with purpose, not PR, and with technology that’s actually ready for the spatial internet.”
Mark van Rijmenam, futurist and author, quoted in Live Science, March 2026
Our read: both things are true at once. BMW’s numbers are real. So is the 75% pilot-to-scale failure rate. If digital twin platforms end up following Mesh’s pattern, real vendor investment, genuine flagship wins, but no generalization past a handful of marquee customers, the “enterprise metaverse survived” story could look premature within 18 to 24 months. Worth watching, not worth ignoring.
What to Actually Budget For in 2026 and 2027
If you’re the one signing off on next year’s spatial computing line item, here’s the practical shift. Stop buying “a metaverse strategy.” Start buying three separate, narrower things:
Digital twin infrastructure for a single production line or facility, evaluated against a specific cost or downtime metric, not a company-wide platform rollout.
VR training modules for one high-cost, high-risk skill (driver safety, assembly precision, hazardous-environment procedures), measured against your own current training time and error rates, not a vendor’s recycled 2020 case study.
Scheduled immersive events, Microsoft’s own replacement category, for large training sessions or product showcases, not daily team meetings.
McKinsey’s research on predictive-maintenance digital twins found downtime reductions of 30% to 50% and maintenance cost cuts of 10% to 40%, a wide but credible range rather than one suspiciously precise headline number. That’s the pattern to look for in any vendor pitch you get this year: named companies, ranges instead of round numbers, and a use case narrow enough that you could measure it in one quarter.
Key insight
Market-size figures for “the metaverse” range from $85 billion to over $2.1 trillion for the same year, depending entirely on whether a given research firm folds in gaming and e-commerce spend. There’s no shared definition. Treat any single headline market-size number as one firm’s estimate, never as settled fact.
Frequently Asked Questions
Is the metaverse dead in 2026?
Not as a single answer. Consumer and social metaverse platforms like Horizon Worlds and Decentraland have seen real pullbacks, including a feature freeze at Meta. Enterprise applications in digital twins, industrial training, and design collaboration continue with measurable, named-company ROI, like BMW’s 30% factory planning cost reduction with NVIDIA Omniverse.
Did Microsoft shut down Mesh?
Yes. Microsoft retired the standalone Mesh 3D app and its avatar-based “Immersive spaces” feature in Teams on December 1, 2025, replacing it with a narrower “immersive events” feature aimed at scheduled large gatherings rather than everyday meetings.
What is a digital twin in the enterprise metaverse?
A digital twin is a continuously updated virtual replica of a physical asset, process, or facility. Companies like BMW use it to simulate and test changes, like factory layouts or collision checks, before applying them in the real world, cutting both cost and risk.
Does VR training actually work for businesses?
Yes, with real attributable results: UPS cut driver safety training time by 75%, and Boeing reports the same reduction alongside assembly accuracy gains from 50% to 90%. However, many widely cited VR training statistics trace back to a single 2020 PwC study and should be treated as one aging data point, not new 2026 research.
The Bottom Line
The metaverse, as a single procurement category, is over. What’s left is three separate, defensible technology bets: digital twins with documented industrial ROI, VR training for specific high-cost skills, and scheduled immersive events for large-scale gatherings. None of them need avatars. None of them need a headset strategy company-wide. Over the next six to eighteen months, watch three things: whether digital twin adoption starts closing that 75% pilot-to-scale gap, whether Meta’s AI-infrastructure pivot quietly starves Horizon Worlds for good, and whether mid-market manufacturers start showing up in NVIDIA and Siemens case studies alongside BMW. That last one is the real test of whether “enterprise metaverse” is a durable category or just a slower-motion version of the same hype cycle.
Autonomous Supply Chains: Who’s Actually Running Them
Robotics • Competitive Consequence
Autonomous Supply Chains: Who’s Actually Running Them
By NeuralWired Staff | Published July 2026
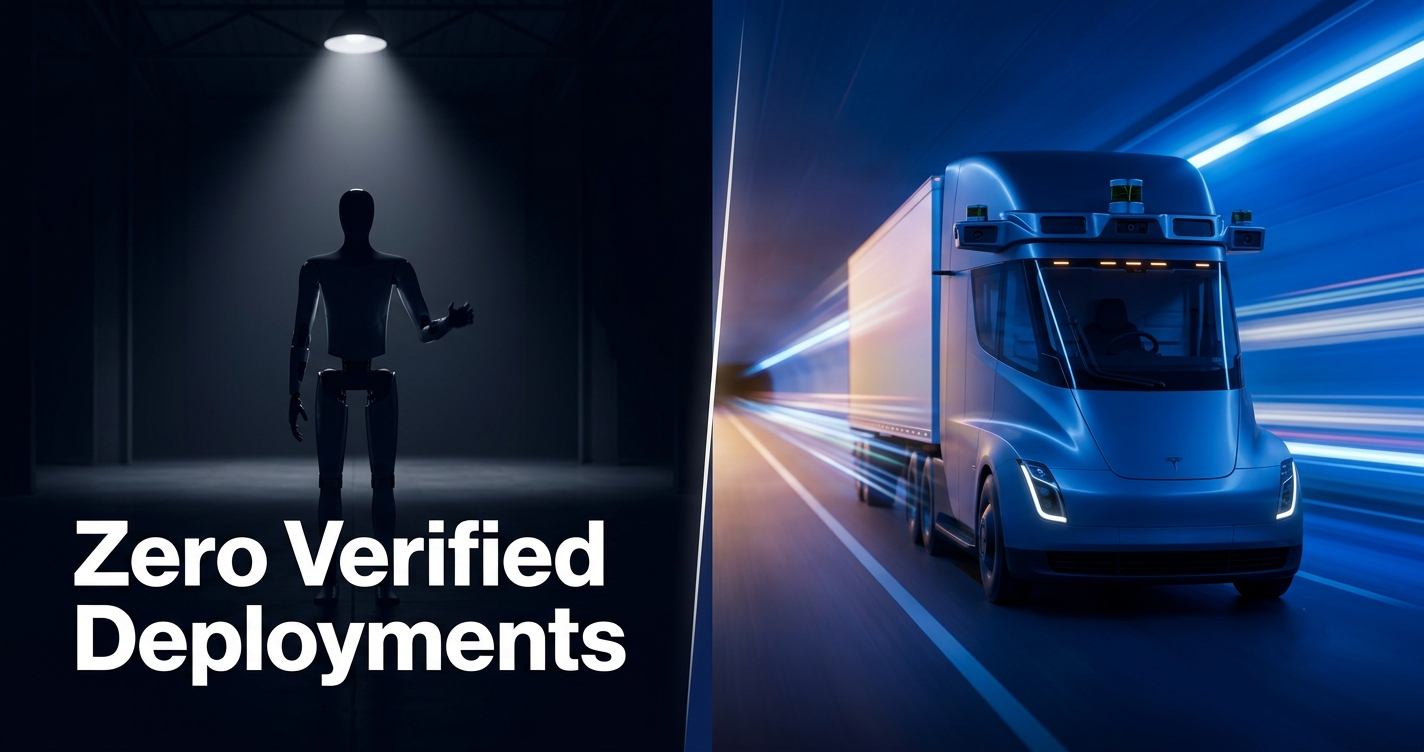
Somewhere in your organization, someone is drafting a board slide with a picture of a Waymo van hauling freight and a Tesla Optimus stacking a shelf. Neither image is true. Waymo exited trucking operations in 2023. Tesla’s own CEO confirmed in January 2026 that existing Optimus units were doing no productive factory work at all. The autonomous supply chain is real and it is already running, just not where the headlines point.
The companies actually moving freight without a driver and putting robots to paid work in warehouses today are Aurora Innovation and Agility Robotics, two names most executive teams have not put in front of the board yet. If you run logistics, supply chain, or operations for an enterprise, that gap between perception and reality is the thing you need to close first, before you write a single line of automation strategy.
The headline correction that matters: Waymo Via paused its own freight operations in 2023 and now only licenses its self-driving stack to Daimler Trucks. It does not haul freight. Tesla’s Optimus has zero verified productive commercial deployments as of the January 2026 earnings call. If your automation roadmap is anchored to either company’s warehouse or freight timeline, it’s anchored to the wrong evidence.
The trucks already driving themselves
Aurora Innovation is the only company running fully driverless commercial trucks, no human behind the wheel, on U.S. public roads today. Since launching on the Dallas to Houston stretch of I-45 in April 2025, Aurora has logged more than 250,000 incident-free driverless miles, and the company is targeting more than 200 trucks running across the Sun Belt by the end of 2026. (Aurora’s CFO disclosed that figure directly, worth noting given the company has an obvious interest in the number sounding impressive.)
The proof this is more than a pilot came on May 6, 2026, when Aurora announced a commercial deal with McLane Company, one of the largest private fleets in the country, to run driverless trucks on that same Dallas to Houston corridor for food distribution. TechCrunch reported that the trucks operate autonomously without a human safety driver able to take over, though Aurora still uses a human observer in the cab under an agreement with OEM partner Paccar. McLane is running a hybrid model: automation for the long middle mile, human drivers for final delivery. That’s the template worth studying if you’re building a network design for 2027.
Aurora isn’t alone. Kodiak Robotics runs the largest driverless Class 8 fleet in the Permian Basin and is targeting highway deployment in the second half of 2026. Gatik was the first company in North America to run fully driverless delivery trucks at commercial scale, with more than 60,000 orders and $600 million in contracted revenue. Bot Auto’s CEO, Xiaodi Hou, put it bluntly: the company built commercial freight on public roads with no human in the cab or remote driving, not a demonstration.
Company
Status, mid 2026
Notable partner or contract
Aurora Innovation
Driverless, commercial, expanding
McLane, Hirschbach (500 trucks ordered)
Kodiak Robotics
Driverless in Permian Basin, highway rollout targeted H2 2026
Oil field logistics
Gatik
Driverless at commercial scale
60,000+ orders, $600M contracted revenue
Bot Auto
Commercial freight, no human in cab
Public road operations
Waymo Via
Paused since 2023, licensing only
Daimler Trucks (technology partner)
Waymo’s absence from the operating column is the point. Its 2020 partnership with Daimler continues, but in a scaled-back, technology-licensing form. Daimler’s own statement confirms Waymo shifted its focus to ride hailing while continuing to support the technical development of Daimler’s autonomous truck platform. Waymo’s real 2026 scale story is robotaxi, not freight.
The robots already earning a paycheck
If there’s a company actually stacking shelves and moving totes for a paycheck, it’s Agility Robotics, not Tesla. Its bipedal robot, Digit, is the only humanoid currently generating revenue from paying commercial customers, according to The Robot Report’s inaugural RBR50 award. Confirmed live deployments include Amazon (testing at a robotics R&D site since 2023), GXO Logistics (a live multi-year deployment for Spanx), Schaeffler Group, and Toyota Motor Manufacturing Canada, which announced a tote loading and unloading deployment in February 2026.
Agility is going public through a SPAC merger with Churchill Capital Corp XI, announced June 24, 2026, which would make it, according to GeekWire’s reporting, the first publicly traded U.S. company dedicated solely to humanoid robots.
Amazon’s own robot fleet, mostly non-humanoid, is the more instructive story for most enterprises. The company’s robot count is approaching parity with its 1.5 million human employees. Sequoia speeds up inventory storage and identification by as much as 75%. Sparrow, a robotic picking arm, can handle roughly 65% of Amazon’s catalog. Notably, Amazon cut more than 100 robotics division staff in March 2026 even while expanding its automation spending, a sign of internal restructuring rather than a clean, linear scale-up.
“Purpose-built warehouse robots accumulate vast operational experience in the environments they are designed to serve. They know the warehouse floor because they have worked it.”
Denis Niezgoda, Chief Commercial Officer, Locus Robotics, in Logistics Business, March 17, 2026 (source)
Where Tesla’s Optimus actually stands
On the January 2026 earnings call, Elon Musk confirmed that existing Optimus units were performing no productive factory work. Production of the next generation, Gen 3, only begins at Fremont in July and August 2026, after Tesla dismantles the Model S and X line to make room. Musk himself said it was literally impossible to predict the 2026 production rate.
An April 2026 deployment tracker from New Market Pitch was direct about it: Tesla Optimus has zero external customers and zero verified productive factory deployments, in contrast to Figure AI, which is running at BMW’s Spartanburg plant with more than 1,250 operational robot hours logged across 30,000 cars produced, and Agility’s Digit, which is already inside Fortune 500 warehouses.
That doesn’t mean humanoids are a dead end. Unitree’s G1 is commercially available now for around $16,000 and shipped roughly 5,500 of the estimated 14,600 humanoid units shipped worldwide in 2025, the largest single share. 1X Technologies’ NEO starts U.S. deliveries in late 2026 at $20,000 or a $499 monthly subscription. China is moving faster on procurement volume than the U.S.: Morgan Stanley raised its 2026 China shipment forecast from 28,000 to 50,000 units, and State Grid alone procured roughly $940 million worth of humanoid, dual-arm, and quadruped robots. If you’re benchmarking competitive pressure, China’s commercial order volume, not Tesla’s marketing calendar, is the number to watch.
How big is this, really
Ask two investment banks how big the humanoid robot market will be and you’ll get numbers 130 times apart, which tells you how immature this forecasting still is. Goldman Sachs projects $38 billion by 2035, revised up sixfold from an earlier $6 billion estimate. Morgan Stanley projects $5 trillion by 2050 for the full humanoid ecosystem, implying roughly one robot for every ten humans on the planet. Neither number should be treated as fact; both should be treated as a range that reflects genuine disagreement about adoption speed, not a settled forecast.
The more grounded number, and arguably the most important one in this entire story, comes from Gartner: only 3 to 5% of warehouses globally currently run fully automated systems. That’s the real headline for a logistics VP. The window for competitive advantage in automation is nowhere near closed. Most of the industry hasn’t started.
Autonomous trucking has a tighter, more credible market picture. The sector reached $2.7 billion in 2024 and is projected to grow at a 32% compound annual rate to $42.6 billion by 2034. Separately, the industry could face a shortage of more than 1.4 million drivers, though that figure comes from an industry market report rather than a government source and should be read as a directional estimate, not a verified count.
The regulatory fight nobody’s briefing the board on
Every driverless freight roadmap assumes uniform legal treatment across states. It doesn’t have that, and the gap is widening. California’s A.B. 316 would bar autonomous trucks over 10,000 pounds from operating without a human on board and freeze CHP and DMV permitting until 2029. Kentucky already passed a law requiring human operators in autonomous trucks over 62,000 pounds through July 2026. Illinois Teamsters, backed by a January 2026 Impact Research poll showing nearly two thirds of Illinois voters oppose driverless cars or trucks on state roads, and 78% specifically oppose driverless heavy trucks, are actively fighting the state’s Autonomous Vehicle Pilot Project Act.
“Hundreds of thousands of Teamsters turn a key for a living, so we are fiercely committed to working with Congress and federal regulators to get AV policy right. Strong federal AV policies must prioritize both workers and safety.”
Sean O’Brien, General President, International Brotherhood of Teamsters (source)
A multi-state logistics network cannot plan around a single national timeline. It has to plan around a patchwork, and that patchwork is being written into law right now, not debated in theory.
The case against moving too fast
Not everyone thinks the humanoid wave is close. Gartner’s research is blunt: current humanoid models don’t have the dexterity, intelligence, or adaptability for day to day warehouse tasks like SKU picking, trailer unloading, or exception handling, and most production deployments over the next couple of years will stay confined to tightly controlled environments. Gartner’s own recommendation is to look at polyfunctional, non-humanoid robots as the nearer-term winner.
Niezgoda’s argument from Locus Robotics cuts the same direction from a competitor’s seat: warehouses are messy, stochastic environments, congestion, mixed SKUs, shifting priorities, human variability, peak swings that don’t show up in lab conditions, and that’s exactly the terrain purpose-built robots have spent years learning while humanoids are still catching up. DHL’s Tim Tetzlaff offers the cleanest test for separating real deployment from demo: innovation is only real when it’s scaled, otherwise it’s just a nice idea. By that test, Aurora and Agility pass. Tesla’s current Optimus program does not, yet.
What logistics leaders should do this quarter
The realistic decision in front of most operators isn’t whether to buy a humanoid robot. It’s whether to pilot a middle-mile driverless freight lane, Aurora, Kodiak, and Gatik style hub-to-hub routes, and narrow, task-specific automation like tote handling and SKU picking, rather than chasing a general-purpose humanoid before the dexterity gap closes.
Study the Aurora-McLane hybrid model before committing capital to a humanoid pilot Gartner says isn’t warehouse-ready.
Map state-by-state regulatory exposure now. California, Illinois, and Kentucky are not edge cases, they’re the pattern.
Separate the freight timeline from the humanoid timeline in every board presentation. Conflating Aurora’s real mileage with Tesla’s production promises is a credibility risk for whoever is presenting.
Korhan Acar, a partner at Kearney and lead author of the 2026 State of Logistics Report, frames the moment this way:
“We have reached a genuine turning point in the autonomous era. The companies that will lead are those combining resilience, intelligent logistics and disciplined execution to protect margins and outperform in an increasingly volatile world.”
Korhan Acar, Partner, Kearney, via FreightWaves
That report also puts U.S. business logistics costs at $2.4 trillion in the most recent year, 7.8% of GDP, down from $2.6 trillion the year before. Enterprise software is already moving to meet this: SAP’s Autonomous Supply Chain Management suite began phased general availability in 2026, embedding agents directly into warehouse and transportation execution.
Frequently asked questions
Is Waymo doing freight or trucking?
Not directly. Waymo paused its own autonomous trucking operations in 2023 to focus on robotaxi service. It remains a technology partner to Daimler Trucks, licensing its self-driving system rather than operating freight itself.
Are Tesla’s robots working in warehouses yet?
No. As of Tesla’s January 2026 earnings call, Elon Musk confirmed existing Optimus units were performing no productive factory work. Production of a new generation only began at Fremont in mid-2026, with meaningful external deployment not expected before 2027.
Which companies actually have driverless trucks on public roads?
Aurora Innovation, Kodiak Robotics, Gatik, and Bot Auto currently operate trucks without a human driver behind the wheel on U.S. public roads, mostly in Texas and the Sun Belt, under commercial contracts with shippers including McLane and Hirschbach.
What percentage of warehouses are fully automated?
Only about 3 to 5% of warehouses globally currently run fully automated systems, according to Gartner data, meaning most of the industry has not yet adopted large-scale robotics despite the attention automation gets in the press.
How big is the humanoid robot market expected to become?
Estimates vary widely. Goldman Sachs projects $38 billion by 2035, while Morgan Stanley projects $5 trillion by 2050 for the full ecosystem including services. The wide gap reflects real uncertainty about how fast adoption will actually move.
Is Amazon using humanoid robots?
Amazon has tested Agility Robotics’ Digit for tote recycling at an R&D facility since 2023, but its primary automation fleet, Sequoia, Sparrow, and Proteus, is non-humanoid. Amazon has not deployed humanoids at full production scale.
Where this goes next
The autonomous supply chain isn’t a future event. It’s running today, on a Dallas to Houston freight lane and inside a handful of Fortune 500 warehouses, just under names that don’t generate headlines the way Waymo and Tesla do. Watch three things over the next 6 to 18 months: whether Aurora hits its 200-truck target without a state regulatory reversal, whether Agility’s public listing brings the transparency (and investor pressure) to prove Digit’s economics at scale, and whether Tesla’s Gen 3 Optimus production run turns into a single verified commercial deployment. Until then, build your roadmap on the companies with logged miles and signed contracts, not the ones with the biggest marketing budget.
Smart Buildings Cost More to Build, Save More to Run | NeuralWiredEnterprise IoT / Building Technology
Smart Buildings Cost More to Build, Save More to Run
The construction premium is real. So are the operating savings. But the numbers making the rounds online are not the ones you should be putting in front of your CFO.
A facilities director at a 400,000 square foot distribution center gets a vendor deck promising a smart building stack that costs 12% more to build and saves 34% on operations. It’s a clean pitch. It’s also a number nobody can source. Here’s what the verified data on smart building ROI actually says, and why the real figures make a stronger capex case than the viral ones.
Enterprise IoT has moved past thermostats and motion sensors. In 2026, a “smart building” means IoT sensors, AI models, digital twins, and centralized automation platforms working together to run HVAC, lighting, access control, and life safety systems as one coordinated system rather than a dozen disconnected ones, according to Cohesion’s 2026 industry outlook. That shift is why CFOs who used to treat this spend as a discretionary nice-to-have are now underwriting it like any other capital project, with a payback period and an IRR attached.
About that 12%/34% number. It’s circulating widely in industry content right now, but we ran it against Turner Construction’s Green Market Barometer, a 2024 Journal of Cleaner Production meta-analysis, USGBC benchmarking data, and half a dozen other primary sources. None of them produce that specific pairing. It appears to be a rounded composite, not a citable finding. The real ranges below are less punchy and considerably more defensible in front of a skeptical CFO.
What It Actually Costs to Build a Smart Building
The honest answer is: it depends almost entirely on whether you’ve done this before.
A 2024 meta-analysis published in the Journal of Cleaner Production, covering dozens of green and smart building projects, put the average construction premium at 1.5% to 8% above conventional construction, with a median of roughly 2.5% for LEED Gold equivalent performance, according to reporting from Sustainability Atlas. That’s a fraction of the 12% figure floating around online.
Experience is the variable that moves the needle. Developers who’ve done multiple certified projects report premiums of 0% to 2%. First-time certifiers, still learning the supply chain and the permitting process, see 5% to 10%. Turner Construction’s 2024 Green Market Barometer backs this up: 69% of respondents reported premiums of 5% or less, and nearly a third reported no premium at all for LEED Silver or equivalent.
Developer profile
Typical construction premium
Repeat, experienced developer
0% to 2%
Average across all projects (meta-analysis median)
~2.5%
First-time certifier
5% to 10%
High-end, full smart-stack integration (upper bound)
up to 10%
So where does 12% come from? Probably nowhere specific, it’s the kind of number that sounds right for a first-time developer doing a platinum-tier build, rounded up for effect. If you’re pitching a project internally, cite the meta-analysis range instead. It survives a fact-check.
What Smart Systems Actually Save
This is where the technology earns its keep, and where the real numbers are, if anything, more interesting than the invented ones.
A 2025 academic review of AI adoption in real estate and facilities management found operational costs dropping 17.6%, maintenance costs down 13.2%, and energy savings around 14%, based on a synthesis of AI tools already deployed across commercial portfolios, per the ScienceDirect study. Lawrence Berkeley National Laboratory research, cited by Albireo Energy, goes further: buildings using analytics platforms have cut energy consumption by up to 50% under favorable conditions, though that figure comes from a secondary citation and hasn’t been traced back to the original LBNL publication, so treat it as a ceiling, not an average.
Occupancy intelligence specifically, the sensors that tell a building who’s actually using which floor and when, has its own separate payoff. Cohesion’s 2026 analysis found that space-utilization insights from occupancy sensors typically reduce real estate space costs by 20% to 35%, and predictive maintenance driven by early fault detection cuts maintenance expenses 10% to 15% while reducing unplanned outages by 20% to 30%.
Add it up and a realistic, source-backed range looks like this: 14% to 30%+ in operating savings depending on how many systems you actually integrate, not a flat 34% regardless of scope. The strongest ROI, per Cohesion, comes from multi-system coordination rather than bolting on a single point solution. Integrated programs typically pay back in two to four years; a standalone smart lighting retrofit can pay back in under 18 months.
The Named Cases That Prove It
Numbers from a meta-analysis are useful. Numbers from a real building with a name on it are more convincing.
Amazon piloted AI-powered building optimization across three grocery fulfillment centers and cut energy use by almost 15%, according to Trane Technologies. Dollar Tree rolled AI-driven HVAC and connected building technology across 600 stores and saved close to 8 million kWh of electricity and more than a million dollars in costs, same source. And 55 Water Street in New York has used continuous AI analysis and automatic HVAC adjustment to cut energy consumption by over 60% since 2010, generating up to $1.5 million in annual utility savings, though that’s a cumulative figure across sixteen years, not a single-year result from one software rollout, so don’t mistake it for an annual run rate.
Then there’s The Edge in Amsterdam, developed by OVG Real Estate, still the flagship case study for this entire category. The 430,000 square foot building uses 70% less energy than a typical office, runs on rooftop solar and aquifer thermal storage, and packs in 30,000 internet-connected sensors for granular occupancy control, according to Sustainability Atlas. Construction premium: 5% to 7%. It reached full occupancy within months and now commands rental premiums around 15% above comparable buildings nearby. That’s the actual shape of the business case, real premium, real payback, real rent uplift, not a headline stat with no source attached.
Who’s Selling This Stack
Three platforms dominate the enterprise conversation right now: Honeywell Forge, Johnson Controls OpenBlue, and Siemens Building X.
Honeywell Forge is the company’s enterprise performance management layer, designed to sit on top of existing building infrastructure and create a continuous loop between data and control, according to Energy Digital. Johnson Controls has taken a different commercial approach with OpenBlue: its “Net Zero Buildings as a Service” model lets owners decarbonize without spending capital upfront, paying instead out of the energy savings the system generates, which is itself a tell that capex approval has historically been the bottleneck in this market.
“AI in buildings is a game-changer.”
Billal Hammoud, President and CEO, Honeywell Building Automation, via Technology Magazine
Kevin Dehoff, Honeywell’s Chief Strategy Officer, frames the shift in similar terms, arguing that building operations are digitalizing at a pace that requires deeper integration between systems that used to run independently. Worth remembering: both executives run business units that profit directly from this exact stack getting adopted, so weigh the enthusiasm accordingly.
The Problem Nobody Puts in the Vendor Deck
Every year the industry pours more money into connected building technology. Every year there’s a gap between the ROI in the pitch and the ROI that shows up on the operating statement. Why does that gap keep reappearing even as the technology improves?
According to Fred Gordy, a building cybersecurity and OT risk expert at KMC Controls who sits on the ISA 99 committee behind the ISA/IEC 62443 standard, the failure usually isn’t technical at all. Speaking on Memoori’s podcast alongside Rob Murchison of Intelligent Buildings, Gordy argued that the actual cause is unmanaged risk, weak governance, and unclear ownership, long before the software has a chance to underperform.
“The real villain is somewhere else entirely.”
Fred Gordy, KMC Controls, ISA 99 Committee, via the Memoori Podcast
Gordy’s diagnostic for any owner considering this spend comes down to three questions: do you know what devices you have, do you know how they’re networked together, and do you know who has access to them. Per the same conversation, most owners can’t answer any of the three. Murchison added that the fix usually isn’t expensive tooling, it’s that nobody in the organization has been assigned to ask those questions in the first place.
That governance gap has real teeth. Roughly 80% to 90% of owners have effectively outsourced OT risk decisions to their vendors by default, according to the same podcast, which means the vendor is making day-to-day security calls the owner never actually authorized. Cohesion’s own 2026 outlook, an optimistic industry source by any measure, still concedes that about a third of operators have experienced security incidents ranging from minor device compromise to major disruptions. More connected systems mean a wider attack surface, full stop. That’s the tradeoff nobody puts on slide one.
Our read: the technology is no longer the bottleneck in this category. The bottleneck is that most organizations buying it haven’t assigned a single person to own the risk questions Gordy is asking. That’s a fixable, unglamorous problem, which is probably why it doesn’t make it into the sales deck.
Frequently Asked Questions
How much does it cost to build a smart building compared to a conventional one?
Verified research puts the construction premium at roughly 1.5% to 10% above conventional construction, with a meta-analysis median near 2.5% for LEED Gold equivalent performance. Premiums run highest for first-time developers (5% to 10%) and lowest for experienced, repeat developers (0% to 2%).
How much can IoT and AI reduce a building’s operating costs?
Documented reductions range from about 14% to 30% for energy costs depending on which systems are integrated, with maintenance costs typically down 10% to 17.6%. Some analytics-driven studies cite savings up to 50% under specific, favorable conditions, though that figure should be treated as a ceiling, not a typical outcome.
What’s the payback period for smart building technology?
Integrated, multi-system smart building programs typically pay back in two to four years. Single point solutions, like standalone smart lighting or occupancy sensors, often pay back in under 18 months. The strongest returns come from coordinating multiple systems rather than upgrading one in isolation.
What’s the biggest risk with smart building technology?
According to building risk experts, the biggest threat to ROI isn’t the technology itself, it’s weak governance: unclear device inventories, unclear network topology, and unclear access control. Most owners can’t fully answer what they own, how it’s connected, or who can reach it.
What This Means Going Forward
The smart building pitch doesn’t need an inflated headline number to work. The real data, a 1.5% to 10% build premium against 14% to 30%+ in ongoing operating savings, backed by named cases like Amazon, Dollar Tree, and The Edge, is already a strong capital allocation case on its own. Lenders and asset managers are starting to price the absence of these systems as a risk factor, not a neutral choice, which tells you where this is headed over the next 18 months.
Three things worth watching: whether “as-a-service” financing models like Johnson Controls’ Net Zero Buildings offering become the default way this gets purchased, whether governance frameworks catch up to the pace of IoT deployment before a major building-security incident forces the issue, and whether the market-size forecasts (which range from $89 billion to $175 billion for 2026 alone, depending on which research firm you ask) start converging as scope definitions standardize.
If you’re the one building the capex model, skip the viral stat. Cite the range, name the source, and let Gordy’s three questions be part of the sign-off checklist, not an afterthought.
Your warehouse GM just asked for budget to add forty robots next quarter, and the pitch deck on your screen cites Amazon’s fleet size to make the case. Here’s the problem: the number in that deck is probably wrong, the safety statistic backing it up is almost certainly fabricated, and the market-size figure someone pulled from a random report could be off by a factor of six.
If you’re evaluating industrial robotics ROI for 2026 budget planning, the Amazon numbers everyone quotes at you are stale, cherry-picked, or invented. This piece rebuilds the case study from primary sources, including the parts of Amazon’s own record that don’t flatter it, so you can build a business case that survives a skeptical CFO instead of collapsing under one follow-up question.
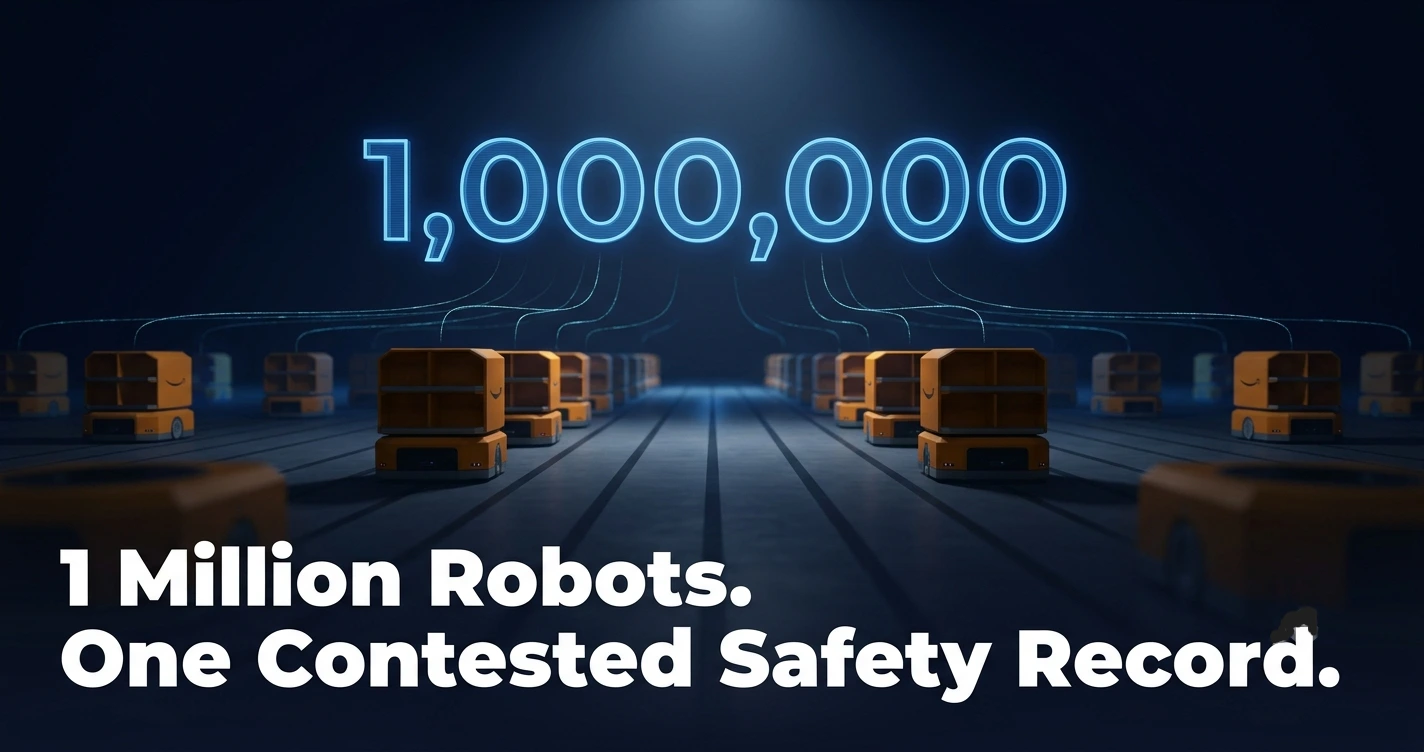
The Real Number: 1 Million Robots, Not 750,000
Start with the stat everyone gets wrong. Amazon’s robotics program traces back to the 2012 acquisition of Kiva Systems, and for the last two years, “750,000 robots” has been the go-to headline figure in nearly every trade article. That number is dead. Amazon confirmed in July 2025 that its millionth robot had shipped, to a fulfillment center in Japan, across a network of more than 300 facilities worldwide.
The milestone wasn’t just a bigger headcount. Amazon paired it with the launch of DeepFleet, a generative AI model built to coordinate robot movement across the entire fleet rather than site by site. The company’s mobile fleet now includes named systems most operators outside e-commerce have never heard of: Hercules (moves up to 1,250 lbs of inventory), Pegasus (conveyor handling), Proteus (the first fully autonomous mobile robot cleared to navigate around employees), Cardinal and Sparrow (arm-based sorting), and Vulcan, a touch-sensitive manipulation robot Amazon announced in May 2025.
Reporting since then, including CEO Andy Jassy’s Q1 2026 remarks covered by WWD and Sourcing Journal, puts the fleet meaningfully above 1 million. Leaked internal documents reported by the New York Times in October 2025 describe an internal target to automate 75% of fulfillment operations and replicate Amazon’s Shreveport, Louisiana facility, its automation template, across roughly 40 sites by the end of 2027. That target has not been confirmed by Amazon itself. Treat it as reported, not guidance.
Why this matters for your business case: if you cite 750,000 robots in a 2026 planning document, you’re using a number Amazon’s own newsroom superseded a year ago. Anyone fact-checking your deck against Amazon’s public record will catch it in ten seconds, and it undermines the credibility of everything else in the deck.
The Safety Story Amazon Doesn’t Want You Repeating (Because It’s Complicated)
Somewhere in the automation-sales ecosystem, a claim started circulating that robots cut Amazon’s picker injury rate by 20%. We ran this against Amazon’s own disclosures, OSHA-sourced third-party analyses, and labor-advocacy research. No source, including Amazon’s most favorable self-reporting, supports that figure. It appears to be invented, and it should be retired immediately from anyone’s ROI deck.
What Amazon actually reports, per its 2025 Safety Report published in March 2026, is a 43% improvement in its musculoskeletal disorder rate over six years and a 14% year-over-year gain, alongside a 70% six-year improvement in lost-time incident rate and $2.5 billion invested in workplace safety since 2019. Those are real, sourceable numbers. They’re also self-reported and not independently audited, which matters for what comes next.
A December 2024 Senate HELP Committee investigation found Amazon warehouses recorded 31% more injuries than the industry average in 2023. A May 2025 Strategic Organizing Center analysis of OSHA data put Amazon’s serious injury rate at 5.9 per 100 workers, against 3.0 at competitor warehouses, roughly double. The National Employment Law Project, in a report covered by The Nation, found Amazon accounts for 79% of employment but 86% of injuries among large US warehouses (1,000-plus employees).
NELP researcher Irene Tung has argued that Amazon’s self-reported injury figures likely understate the real incident rate, because the reporting standard only reliably captures injuries serious enough to cause missed work or a job transfer, missing a large share of everyday strain and repetitive-motion harm.
Irene Tung, Researcher, National Employment Law Project, via The Nation
Amazon disputes the comparison, arguing that competitors like Walmart, Target, and Costco log injuries under different OSHA classification codes, which artificially deflates the “industry average” it’s being measured against. Labor advocates counter that Amazon makes up 79% of the employee base in the very warehouse-size bracket used for that comparison, which makes the benchmark somewhat self-referential either way.
Here’s the part that should actually worry anyone pitching robots as a safety upgrade: historically, more robots at Amazon has not clearly meant fewer injuries. Reporting from Reveal, the Center for Investigative Reporting, found injury rates were specifically worse at Amazon’s more heavily robotic facilities as the fleet scaled from 15,000 units in 2014 to 200,000 in 2019, a period when the serious-injury rate rose 33%. The assumption that automation straightforwardly protects workers doesn’t hold up against Amazon’s own history.
Our read: this is a stronger story than the fake 20% stat ever was. “The safety case is contested, and here’s exactly how” is more credible to a skeptical operations audience than a clean number nobody can verify. It’s also a warning: if you’re leaning on “safety” as a justification for a robotics investment, expect the same scrutiny Amazon is getting.
What “The Industrial Robotics Market” Actually Costs
Ask six research firms how big the industrial robotics market will be in 2026 and you’ll get six answers that don’t agree with each other by a wide margin.
Research Firm
2026 Market Size
Projected CAGR
MarketsandMarkets
$15.50B
5.0% to 2032
Business Research Insights
$18.35B
6.2% to 2035
SkyQuest
$21.27B (2025)
13.2% to 2033
IntelMarketResearch
$25.66B
10.7% to 2034
Mordor Intelligence
$54.28B
11.7% to 2031
Future Market Insights
$65.10B
18.1% to 2036
Research and Markets
$89.57B
11.34% to 2032
That’s roughly a six-fold spread on the same question, asked the same year. Mordor Intelligence’s own methodology notes explain why: some firms count only robotic arm hardware, others count entire integrated systems; some price at the factory gate, others at street price; currency conversion timing alone can shift a figure by billions.
The one number in this space that’s methodologically transparent and not trying to sell you a subscription is the International Federation of Robotics’ World Robotics 2025 report. IFR counted 4,664,000 industrial robots in operational use worldwide in 2024, a 9% year-over-year increase, with annual installations of roughly 542,000 units, the second-highest total on record. That’s primary survey data collected directly from manufacturers and national robotics associations across roughly 40 countries, not a modeled forecast.
Outgoing IFR president Takayuki Ito characterized 2024 as the second-highest installation year in the organization’s history, just 2% below the 2022 record, a measured framing rather than a promotional one from the industry’s own trade body.
Takayuki Ito, President, International Federation of Robotics, IFR World Robotics 2025 release
Worth noting for anyone benchmarking against global competition: China’s operational robot stock passed 2 million units in 2024, the largest of any country, accounting for 54% of that year’s global deployments. US installations, meanwhile, rose 11% year-over-year to 38,000 units in 2025 per IFR’s preliminary data, published June 2026. Global installation growth has plateaued near record highs for four straight years even as US adoption accelerates, which means American buyers are now competing for the same integrator capacity and equipment lead times as everyone else scaling up at once.
How to use this in your own board deck: never cite a single market-size figure without naming the firm and the scope. “By one estimate, from Research and Markets, the market could reach $89.57B” reads as rigorous. “The market is worth $89.57B” reads as something an AI search summary will flag against a competing number the moment someone checks.
The ROI Framework That Actually Survives Contact With a P&L
None of the numbers above tell you whether robotics will pay off in your facility. That answer depends almost entirely on one variable most vendors skip: whether your existing process is worth automating in the first place.
Automation World’s February 2026 analysis, citing McKinsey research projecting 10%-plus annual growth in warehouse automation spend through 2030, found that ROI shows up reliably in one narrow category: high-volume, repetitive picking and palletizing tasks, and even there, only when volume, SKU mix, and labor economics line up. Throughput gains of 30 to 40% are achievable, but they’re the ceiling for a specific use case, not a baseline you should expect everywhere.
Is that a disappointing headline number compared to the marketing? Probably. It’s also the honest one, and it points to the single most actionable insight in this entire space: WMS, OMS, and ERP integration quality determines whether robotics amplifies an efficient operation or accelerates a broken one. A facility with messy inventory data and inconsistent SKU handling doesn’t get fixed by adding robots. It gets the same problems, faster and at a higher fixed cost.
A practical sequencing checklist before you sign a robotics contract
Audit process maturity first. If your WMS data is unreliable today, robots will not correct it. They’ll operate on it.
Model against your actual SKU mix and volume, not an industry-average case study from a vendor deck.
Price in integrator lead time. With US installations up 11% year-over-year, integrator capacity is tightening, and that shows up as schedule risk, not just cost risk.
Separate the safety pitch from the productivity pitch. Treat any safety-based ROI claim, yours or a vendor’s, with the same scrutiny applied to Amazon’s above.
Budget for the process-fix work as a line item, not an afterthought. It’s frequently the actual bottleneck.
The Case Against Following Amazon’s Playbook Blindly
Amazon’s scale is not a template most enterprises can copy, and pretending otherwise is where a lot of robotics budgets go to die.
Amazon’s warehouse headcount has grown from roughly 125,000 workers in 2012 to more than 1.5 million today, even as automation scales, though a Wall Street Journal analysis found the average number of human workers per facility (about 670) is now at a 16-year low. Amazon has the balance sheet to absorb integration failures, run parallel automated and manual workflows during transitions, and continue acquiring robotics companies (RIVR for outdoor delivery robots, Fauna Robotics for humanoid systems, both reported by PYMNTS in March 2026) while it works out the kinks.
Mid-market operators generally don’t have that cushion. If you don’t have in-house robotics engineering capacity or the margin to absorb a botched rollout, you’re more exposed to exactly the failure mode Automation World describes: automating a broken process and discovering the problem was never throughput, it was data quality.
Timeline reality check: Amazon’s internal target, 75% of fulfillment automated and roughly 40 Shreveport-style facilities by end of 2027, comes from leaked documents reported by the New York Times, not from an official Amazon roadmap. Build your own planning timeline off confirmed public statements, not leaked internal ambition. The gap between the two is usually where budget overruns live.
Frequently Asked Questions
How many robots does Amazon have in 2026?
Amazon passed 1 million operational robots in mid-2025, up from the 750,000 figure widely cited in 2023 and 2024, spread across more than 300 fulfillment centers worldwide. Reporting since then indicates the fleet has grown meaningfully beyond that milestone.
Did Amazon’s robots reduce warehouse injuries?
Amazon reports a 43% six-year improvement in its musculoskeletal disorder rate, but independent OSHA-data analyses from the Strategic Organizing Center and the National Employment Law Project find Amazon’s overall injury rate remains roughly double that of comparable competitor warehouses.
What’s a realistic ROI payback period for warehouse robots?
Payback varies widely by use case. Industry reporting points to strong ROI mainly in high-volume, repetitive picking and palletizing tasks, with 30 to 40% throughput gains achievable only when volume, SKU mix, and labor economics genuinely align.
How big is the industrial robotics market?
Estimates range from roughly $15.5 billion to $89.6 billion for 2026 depending on the research firm’s methodology and scope. The IFR’s installed-base count, 4.66 million robots operating globally as of 2024, is the most methodologically transparent primary figure available.
What This Means Going Forward
The headline robot count was never the interesting part of this story. The interesting part is that Amazon, the company with the most resources on earth to solve robotics integration cleanly, still has a contested safety record and an unconfirmed internal automation timeline. If Amazon’s own case study is this complicated, treat any vendor’s clean 12-month-payback promise with proportional skepticism.
Over the next 6 to 18 months, watch three things: whether Amazon’s leaked 2027 automation target gets officially confirmed or quietly walked back, whether IFR’s mid-2026 preliminary US installation data (already up 11% year-over-year) holds through a full annual report, and whether independent OSHA-data analyses of Amazon’s newest robotic facilities start closing the gap with its self-reported safety numbers or widening it.
For now, the actionable takeaway for anyone building a 2026 automation budget is simple: fix the process before you automate it, name your sources when you cite market size, and never let a vendor’s safety pitch go unchecked against independent data.
IBM Owns Terraform Now: Inside Pulumi’s 2026 HCL MoveCloud Infrastructure
IBM Owns Terraform Now. So Pulumi Learned Its Language.
A quiet feature launch in January 2026 tells you more about where infrastructure as code is heading than any market share number floating around Google right now.
If you searched “terraform vs pulumi market share 2026” and landed here expecting a clean percentage, you’ve found the same wall we hit. A number like “Terraform owns 72% of the market” is repeated across dozens of sites this year. It’s also attributed to the CNCF’s 2024 survey, which, when you actually open the PDF, contains no IaC market share question at all. It covers Kubernetes, GitOps, and service mesh, not Terraform versus Pulumi versus OpenTofu. That statistic doesn’t exist. It’s a content farm number that got copied enough times to look true.
Here’s what does exist, and it’s a better story anyway: in January 2026, Pulumi started shipping native support for HashiCorp Configuration Language, the actual syntax Terraform users write in. It also began hosting Terraform and OpenTofu state files directly inside Pulumi Cloud, a direct shot at HashiCorp’s own hosted product. That’s not a rumor. That’s a company built on the opposite philosophy from Terraform (write infrastructure in Python or TypeScript, not a config language) deciding the config language was worth absorbing anyway.
Why this matters if you manage infrastructure: You no longer face an all or nothing rewrite to leave Terraform. Pulumi’s bridge means you can keep existing Terraform or OpenTofu state under new governance while migrating components on your own schedule. That changes the calculus for any team stuck deciding what to do about HashiCorp’s licensing shift.
The Real Story: Why Pulumi Started Speaking HCL
Pulumi’s founder and CEO, Joe Duffy, didn’t dress up the reasoning. Asked why a multi-language platform would add support for the one language it was built to avoid, he pointed to demand from Terraform users looking for an exit ramp after HashiCorp’s 2023 licensing change.
“That time has come for HCL.”
Joe Duffy, Founder and CEO, Pulumi, via InfoQ, January 17, 2026
In a separate interview a few weeks later, Duffy went further, saying the Terraform relicense had noticeably pushed existing Terraform users to look at Pulumi (The New Stack, February 2026). Take that with the appropriate grain of salt. He’s the CEO selling the migration story. But the product decision itself, shipping a language Pulumi spent seven years arguing against, is hard evidence regardless of who’s narrating it.
That decision doesn’t happen in a vacuum. It happens because of what came before it.
The Three Shocks That Actually Reshaped IaC
Strip away the SEO noise and this isn’t really a two horse race between Terraform and Pulumi. It’s a three way story, and OpenTofu is the part most “Terraform vs Pulumi” articles conveniently skip.
Event
Date
What actually happened
Terraform relicensed to BSL
August 2023
HashiCorp moved Terraform off the open source MPL 2.0 license onto the Business Source License, restricting competitors from reselling managed Terraform products.
OpenTofu forks Terraform
September 2023
Founded under the Linux Foundation by Spacelift, env0, Harness, Scalr, and others, days after the BSL announcement.
HashiCorp vs OpenTofu dispute
April 2024
A cease and desist alleging code theft was publicly rebutted line by line. Linux Foundation’s Jim Zemlin backed OpenTofu; InfoWorld’s Matt Asay reversed his initial position after reviewing the rebuttal.
IBM acquires HashiCorp
February 27, 2025
A confirmed $6.4 billion deal, per IBM’s own newsroom. Terraform now sits inside IBM’s automation portfolio next to Vault, Consul, and Nomad.
OpenTofu joins CNCF
April 2025
Accepted at the Sandbox tier, giving it vendor neutral governance credibility a single company fork rarely earns this fast.
Pulumi adds native HCL support
January 2026
Announced in private beta, targeting general availability in Q1 2026. Confirm current GA status before assuming it’s fully live.
Notice what’s missing from most coverage: the CLOUD Act and data jurisdiction angle. If your organization stores Terraform state inside HCP Terraform, that platform now sits under IBM, a U.S. company. For teams with GDPR obligations or data residency requirements, that’s worth a conversation with legal, even if it’s not the deciding factor.
The Numbers You Can Actually Check Yourself
Forget the disputed percentages. The most defensible signal in this whole debate is public, live, and anyone can verify it in thirty seconds on GitHub.
Tool
GitHub stars
Trend
Terraform
~48,749
Still the largest, unsurprising given its head start
OpenTofu
~29,000
Roughly doubled from ~22,400 in under two years
Pulumi
~25,378
Now trailing OpenTofu, despite Pulumi being nearly six years older
That last row is the one nobody’s writing about. OpenTofu launched in September 2023. Pulumi launched in 2017. And OpenTofu has already pulled ahead of it on developer mindshare by star count. If you wanted one sentence to summarize where developer attention is actually going, that’s it, and it’s not the sentence most headlines are using.
Two infrastructure orchestration vendors back this up with real usage data, not surveys. Spacelift reports that roughly half its platform deployments now run OpenTofu instead of Terraform. Scalr reports OpenTofu at around 63% of runs and 72% of newly created workspaces, up from about 56% of new workspaces earlier in 2026. That second number matters more than the first: new workspace share reflects fresh decisions being made today, not legacy projects nobody’s touched since 2022.
On the provider ecosystem, the gap that used to favor Terraform by three to one has narrowed sharply. OpenTofu’s registry now lists more than 3,900 providers and 23,600 modules against Terraform’s roughly 4,800 providers, closer to a 20% gap than the old blowout. Pulumi’s native registry is smaller at around 1,800 packages, but its “Any Terraform Provider” bridge lets it generate a typed SDK from essentially any Terraform or OpenTofu provider, which closes that distance more than the raw numbers suggest.
What The People Building These Tools Are Actually Saying
Matt Gowie, founder of the IaC consulting firm Masterpoint and a former Terraform contributor, told TechTarget that starting in January 2026 he began actively steering client work toward OpenTofu over licensing objections. By his account, all but one of roughly eight client engagements that year ended up on OpenTofu.
Sebastian Stadil, CEO of Scalr and an OpenTofu core member, put the licensing contrast bluntly when OpenTofu shipped native state encryption, a feature the open Terraform CLI still lacks. Worth remembering he runs a company that competes directly with HashiCorp’s commercial products, so weigh the framing accordingly.
The Case Against The “Pulumi Is Winning” Narrative
Not everyone buys the displacement story, and the skeptical case deserves real airtime rather than a token paragraph at the bottom.
“I have not seen any of the predicted tsunami of large businesses dumping HashiCorp Terraform for OpenTofu.”
Andi Mann, Global CTO and Founder, Sageable, via TechTarget
Mann’s read, that adoption is real but concentrated in smaller, open source first shops rather than sweeping the enterprise, lines up with a fact most “Terraform is dying” articles leave out: HashiCorp’s last public quarter before the IBM acquisition closed showed revenue up 15% year over year and customer count up 10% among accounts spending six figures. That’s not a company in freefall.
Our read: the loudest part of this story, GitHub stars and vendor platform data, tells you where developer enthusiasm and new project decisions are trending. It does not yet tell you that large regulated enterprises are ripping out production Terraform at scale. Those are two different claims, and a lot of 2026 coverage blurs them into one.
There’s also a small base problem worth flagging directly for anyone quoting a “45% growth” style figure for Pulumi or OpenTofu. A percentage jump looks dramatic against a small starting number. Pulumi’s last verified customer count sits around 2,000 (a 2023 figure, likely stale by now), against HashiCorp’s roughly 4,700 paying customers reported in 2024. Growth rate and absolute scale are not the same story, and reporting on this topic tends to conflate them.
One more open thread: the HashiCorp and OpenTofu legal dispute over alleged code copying was never resolved in public record. It went quiet after OpenTofu’s rebuttal, but “no further communication” isn’t the same as “resolved.” Any team betting heavily on OpenTofu’s long term legal footing should know that history exists.
Quick Answers
Is Terraform still open source?
No, not in the traditional sense. HashiCorp moved Terraform from the open source MPL 2.0 license to the Business Source License 1.1 in August 2023. You can still view, run, and self-host it for free, but competitors can’t resell managed Terraform products without a commercial license.
What’s the actual difference between Terraform and Pulumi?
Terraform uses HCL, a declarative configuration language built specifically for infrastructure. Pulumi lets you write infrastructure in Python, TypeScript, Go, C#, or Java, giving you real loops, functions, and IDE tooling that HCL doesn’t offer.
Is OpenTofu a safe replacement for Terraform?
For most teams, yes. It’s a Linux Foundation governed fork of Terraform 1.6, fully open source under MPL 2.0, and largely drop-in compatible. Most migrations just swap the terraform binary for tofu with no code changes required.
Who owns Terraform now?
IBM. The acquisition closed February 27, 2025, for $6.4 billion. Terraform now sits inside IBM’s automation software lineup alongside Vault, Consul, and Nomad.
Can Pulumi actually use Terraform providers?
Yes. Pulumi’s bridging mechanism lets it use existing Terraform and OpenTofu providers directly, generating a typed Pulumi SDK from any provider already in either registry.
Where This Goes Next
What you now know that most search results won’t tell you straight: the “market share” framing dominating this topic is mostly unverifiable noise traced back to a survey that never asked the question. The real signal is quieter. OpenTofu is pulling developer attention away from both Terraform and Pulumi. Pulumi is responding by absorbing the one thing that used to separate it from Terraform entirely. And IBM’s ownership has turned a licensing dispute into a jurisdiction and governance question that has nothing to do with syntax.