Strategic analysis of big tech companies: Microsoft, Google, Apple, Meta, Amazon, NVIDIA, OpenAI, and more. Enterprise moves, AI investments, and competitive intelligence decoded.
Data Observability in 2026: Why 53% of Data Leaders Already Use It
Data & AI Infrastructure
Data Observability Hit 53% Adoption. Most Teams Still Find Out From a Customer.
By NeuralWired Staff · Published July 3, 2026 · 9 min read
A pipeline breaks at 2am. Nobody’s watching. By the time the CEO opens their dashboard at 9am, it’s empty, and the first question in the Slack thread is always the same: how long has this been broken? For a growing share of data teams, that question now has an uncomfortable answer, because Gartner’s first dedicated Market Guide for data observability, published in February 2026, shows the category isn’t emerging anymore. It’s already mainstream, and the teams still without it are now the outliers, not the innovators.
Data observability is the practice of monitoring the health and behavior of data as it moves through pipelines, covering freshness, volume, schema, distribution, and lineage. It doesn’t just tell you a job failed. It tells you why, and whether the failure quietly poisoned everything downstream.
Gartner’s Market Guide draws a line that a lot of buyers still blur: data quality asks whether the data itself is accurate. Data observability asks whether the system delivering that data is healthy. Confuse the two, and you end up buying a data quality tool to fix a pipeline reliability problem, or vice versa. That confusion, Gartner notes, is a real source of wasted budget across enterprise data teams.
The five pillars. Freshness, volume, schema, distribution, and lineage. Nearly every platform in this category, from Monte Carlo to Bigeye to Soda.io, is built around detecting and explaining failures across these five dimensions.
Why Gartner’s Report Matters Right Now
Gartner doesn’t publish a Market Guide for a category until enterprise budget has already moved. That’s the real story buried in the February 23, 2026 report from analysts Melody Chien, Michael Simone, Jason Medd, and Lydia Ferguson: this is confirmation, not prediction.
The headline number is stark. Data and analytics leaders who’ve already implemented data observability tooling sit at 53%, with most of the remainder planning to within 18 months, according to Gartner’s 2025 State of AI-Ready Data Survey. If you’re a data platform lead who’s been putting this off as a nice-to-have, the market already decided otherwise.
Gartner’s own market-sizing puts 2024 data observability revenue at roughly $346.4 million, up 20.8% year over year. That figure is worth anchoring on specifically because it comes from Gartner’s own analysis, unlike the wildly divergent third-party market forecasts floating around (more on that below).
The AI Agent Pivot Changing the Category
Here’s what changed in the last four months, and it’s the real reason this topic is worth your attention today rather than a year ago. Monte Carlo, the company credited with coining “data observability” when CEO Barr Moses founded it in 2019, has repositioned itself around AI agents. It shipped new Agent Observability capabilities on March 12, 2026, and announced a Databricks Agent Bricks integration on June 2, 2026, at Snowflake Summit.
The shift isn’t cosmetic. It reflects a genuine change in what “is my data healthy” means once an autonomous agent, not a human analyst, is the one acting on it.
“If you’re deploying agents without production-grade observability, you’re flying blind.”
Barr Moses, CEO and Co-founder, Monte Carlo · Business Wire, March 12, 2026
Worth noting: Moses runs the company that created this category, so her framing of urgency comes with an obvious commercial interest. That doesn’t make the underlying data wrong. Monte Carlo’s own survey of 260 respondents at companies with 1,000-plus employees, fielded in April 2026, found that 64% of organizations deployed AI agents before feeling fully prepared. Among software developers and engineers specifically, that number climbs to 75%.
The scarier number sits underneath that one. Nearly a third of organizations say they couldn’t disable or roll back a harmful AI agent within minutes, and 14% say they couldn’t do it at all. That’s not a data quality problem. That’s an incident response problem, and it’s the reason security and compliance teams are increasingly showing up in what used to be a purely data-engineering conversation, particularly with the EU AI Act’s audit trail requirements for high-risk systems now in play.
Gartner’s own AI observability research backs the direction of travel. Senior Principal Analyst Pankaj Prasad, writing about explainable AI and LLM observability investment:
“As enterprises scale GenAI, the trust requirement grows faster than the technology itself.”
Pankaj Prasad, Senior Principal Analyst, Gartner · Gartner Newsroom, March 30, 2026
The Tool Sprawl Problem Nobody’s Solved
Adoption is up. Confidence isn’t following at the same pace, and the reason is tool sprawl.
A Cloud Native Computing Foundation survey found 72% of respondents run up to nine different observability tools, with over a fifth running 10 to 15. Half named tool sprawl as their single biggest observability challenge, full stop, not a secondary complaint. Separately, Omdia research cited by groundcover CEO Shahar Azulay puts the figure at 69% of organizations running six or more observability tools.
New Relic’s 2025 Observability Forecast adds the most uncomfortable data point in this entire brief: even after two years of consolidation effort that cut tool count by 27%, organizations still average 4.4 observability tools, and 41% of leaders still learn about service interruptions from customer complaints or manual checks rather than their own monitoring stack. That’s the real-world version of the empty 9am dashboard, and it’s happening at nearly half of surveyed enterprises despite the tooling being in place.
Market size: pick your number carefully
Ask five research firms how big the data observability market is and you’ll get five different answers, spanning nearly 3x for the same year. That’s not sloppiness, it’s scope. Some include general APM tooling, some are data-specific, some cover enterprise deployments only.
Source
2026 Estimate
Scope Note
Gartner (2024 actual)
$346.4M (+20.8% YoY)
Data observability specifically; most defensible single figure
Research and Markets
$3.4B
Broader market definition
market.us
~$2.6B (trend est.)
Global, projecting to $7.01B by 2033
Future Market Insights
$1.63B
Enterprise software only, narrower scope
businessresearchinsights.com
$4.35B
Broader “observability tool market,” not data-specific
If you only take one number away, take Gartner’s $346.4 million. It’s the only one built from Gartner’s own market-share analysis rather than a syndicated forecast model.
The Case Against Buying Your Way Out
Not everyone in this space thinks more spending is the answer. groundcover CEO Shahar Azulay, whose company competes in this exact market, argues the economics of observability itself are broken, not just under-adopted.
“Tool sprawl is one of the clearest signals that observability economics are broken.”
Shahar Azulay, Co-founder and CEO, groundcover · Techzine, February 18, 2026
His sharper point is technical: traditional sampling, the trick most platforms use to keep observability costs down by only recording a fraction of traces, breaks down for AI agent workloads. Agent behavior is non-deterministic. A small input change can cascade into a completely different execution path, and if you’re only sampling a slice of traces, you may simply never see the path that mattered. Reduced sampling doesn’t just reduce visibility here, it changes what teams are structurally capable of knowing.
Put Azulay’s incentive next to Moses’s and you get a genuine industry disagreement rather than manufactured balance: one CEO says buy production-grade observability now, the other says the current economics of doing so don’t actually work for agentic workloads. Both are worth hearing. Neither is neutral.
Our read: the procurement numbers (53% adoption, most of the rest planning within 18 months) and the operational-maturity numbers (41% still learning about outages from customers, tool sprawl cited by half of teams as their top challenge) are measuring two different things. Buying the tool and solving the reliability problem are running on very different timelines, and most coverage of this space conflates them.
What This Means For Your Team
If you’re a data engineering lead or a CDO evaluating this right now, the decision has quietly changed shape. It used to be “should we buy observability.” Gartner’s numbers suggest that question is largely answered. The real decision is consolidation strategy: buying another disconnected dashboard makes tool sprawl worse, not better.
Two numbers should anchor your planning conversation this quarter: 64% of organizations shipped AI agents before feeling prepared, and nearly a third couldn’t roll back a harmful agent within minutes. If your organization is running or piloting agentic workflows, this is no longer a data-team-only decision. Loop in security and compliance before the pilot, not after the incident.
For teams further along on data platform maturity, the related question of self-healing infrastructure and unified telemetry is worth a deeper look in our AIOps self-healing infrastructure guide. And if you want the sharper cautionary version of what happens when this goes wrong in production, we broke down the pattern in why AI agent deployments fail and again in our 2026 production fix guide. Teams still in the planning phase should start with the data readiness audit in our enterprise AI implementation roadmap, since data observability is only useful if the underlying data governance is already sound.
Frequently Asked Questions
What is data observability?
Data observability is the practice of monitoring the health, reliability, and behavior of data as it moves through pipelines, covering freshness, volume, schema, distribution, and lineage. Unlike simple monitoring, it explains why something broke, not just that it broke.
What is the difference between data observability and data monitoring?
Monitoring tells you something is broken, similar to a fire alarm going off. Observability tells you why it broke and helps prevent it from happening again, closer to a full root-cause investigation after the alarm sounds.
What is data observability vs. data quality?
Data quality asks whether the data itself is accurate, complete, and consistent. Data observability asks whether the system delivering that data is healthy and behaving as expected, and if not, why. Gartner treats these as complementary disciplines, not interchangeable ones.
Do I need data observability for AI agents?
Increasingly, yes. Monte Carlo’s 2026 survey found 73% of enterprises won’t deploy an AI agent without monitoring and alerting in place, yet 63% still cite lack of observability as a top barrier to broader AI deployment.
What are the five pillars of data observability?
Freshness, volume, schema, distribution, and lineage. These five dimensions form the baseline framework most data observability platforms use to detect and explain pipeline failures.
How much does data downtime cost a company?
Reliable, data-observability-specific figures are hard to pin down and vary heavily by industry and incident scale. Be skeptical of any single dollar figure circulating online. Several widely repeated numbers are actually sourced from unrelated data-center downtime studies, not data pipeline incidents specifically.
Where This Goes Next
The procurement wave is real and well documented. What isn’t settled yet is whether the tooling actually closes the gap between “we bought observability” and “we found out before the customer did.” Watch three things over the next 6 to 18 months: whether Monte Carlo’s agent-observability bet gets matched by Acceldata, Bigeye, and Datadog with comparable depth, whether Gartner’s predicted 50% LLM observability investment threshold (targeted for 2028) starts showing up in earlier budget cycles, and whether the tool-sprawl number actually drops instead of just shifting vendors.
If you’re making a buying decision this year, the honest starting point isn’t “which platform.” It’s whether you’re solving for pipeline health, agent trustworthiness, or both, because right now most vendors are still figuring out which one they’re actually built for.
Want the next update on this before it hits the mainstream feeds? Subscribe to The Neural Loop at neuralwired.com/newsletter.
DORA Report: AI Code Review Time Jumps 441% | NeuralWired
DevOps & Engineering
DORA Report: AI Code Review Time Jumps 441%
By the NeuralWired Engineering Desk · Updated July 2026 · 11 min read
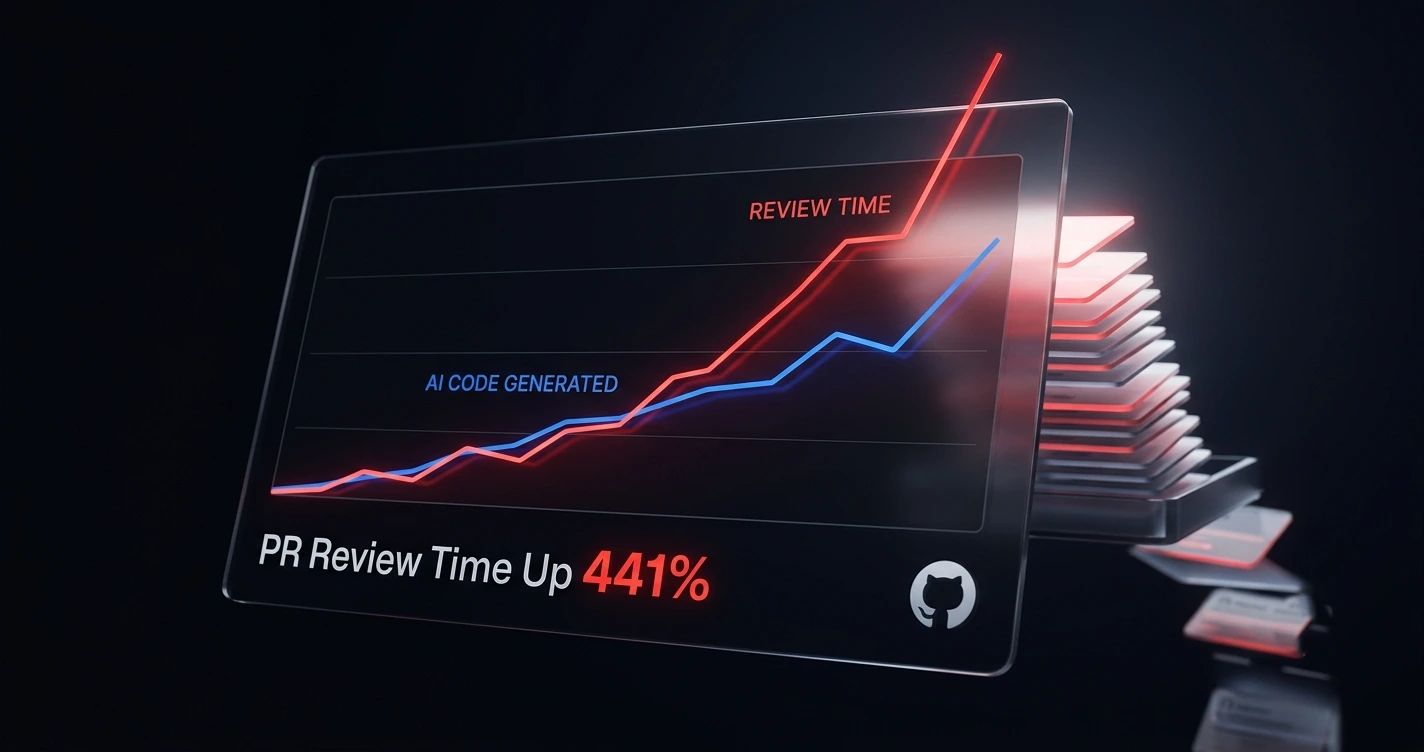
Your team ships AI generated code faster than ever. Your review queue is where that speed goes to die. New data from Google’s DORA team and a 22,000 developer telemetry study from Faros AI both point to the same uncomfortable number: median time spent in code review is up 441.5% as AI adoption climbed, not down. If you’re an engineering leader who assumed AI code review would fix the bottleneck AI code generation created, the 2026 numbers say otherwise, and you need to see them before your next tooling decision.
Every AI coding tool vendor is currently selling some version of the same promise: write code faster, review it faster, ship it faster. The generation half of that promise is real. The review half is where the story falls apart.
Faros AI’s “AI Engineering Report 2026: The Acceleration Whiplash” is the most current dataset available on this question. It draws on two years of telemetry from 22,000 developers across more than 4,000 teams, comparing each organization’s lowest AI adoption periods to its highest. The headline findings:
Median time to first PR review is up 156.6%
Average time spent in code review is up 199.6%
Median time in review overall is up 441.5%
AI code acceptance rate rose from 20% to 60%
Faros AI sells engineering analytics software built on DORA metrics, so treat this as vendor research with a stake in the outcome, not a neutral academic study. Still, the direction of the finding lines up with Google’s own 2025 DORA State of AI Assisted Software Development report, produced with GitHub and IT Revolution. DORA’s framing is that AI acts as an amplifier: it strengthens teams that already have solid engineering practices, and it exposes the weaknesses of teams that don’t. Roughly 90% of developers now use AI daily, according to the report, but nearly a third, 30%, say they have little to no trust in AI generated code.
That distrust has a name in the DORA report: the “verification tax.” Time saved writing code gets spent auditing it instead, and that tax lands squarely on reviewers.
A note on the “4.2 hours vs 90 seconds” claim you might have seen elsewhere. That comparison doesn’t hold up against any primary source we checked. Real human review times range from roughly 4 hours at Google internally to 3 to 5 days at typical enterprise teams, and AI review tools themselves range from about 30 seconds (GitHub Copilot) to several minutes for deep-index tools like Greptile. We’re using the sourced numbers above instead.
Why Review Time Is Exploding, Not Shrinking
Kent Beck, the creator of Extreme Programming and a co-author of the Agile Manifesto, put it about as bluntly as anyone in the industry has:
“We’re accumulating code faster than we are accumulating trust.”
Kent Beck, “Trust Factory” newsletter, newsletter.kentbeck.com
That’s the whole problem in one sentence. AI generated code is, by multiple accounts, superficially convincing. It’s idiomatic. It’s well named. It reads like something a competent engineer wrote. Which is exactly why surface level review, the thing AI review tools are best at, becomes less useful over time: the bugs living in that code tend to be structural, not stylistic. Faros AI’s analysis makes the point directly, arguing that the engineers with the deepest system knowledge are the ones spending their most valuable hours unraveling plausible looking code that should never have reached them in that state.
An independent academic study published on arXiv in December 2024, still the most cited empirical study of its kind as of mid-2026, tested an LLM based automated review tool in real production repositories. Average PR closure time rose from 5 hours 52 minutes before the bot to 8 hours 20 minutes after, a statistically significant increase. Results varied by project. One project’s closure time dropped from 6 hours 6 minutes to 3 hours 7 minutes. Another rose from 20 hours 22 minutes to 30 hours 51 minutes. Roughly 73.8% of the tool’s comments were acted on, and developers reported a modest quality improvement, but the bot also introduced faulty reviews and irrelevant comments that added friction of its own.
Stack Overflow’s 2025 Developer Survey backs this up from the sentiment side: 84% of developers use or plan to use AI tools, yet 66% say their biggest pain point is AI output that’s “almost right,” and 45% say debugging AI generated code takes longer than debugging their own. Sonar’s State of Code 2026 survey of 1,149 developers found 96% don’t trust that AI generated code is functionally correct, but only 48% say they always review before committing. That gap between distrust and actual review discipline is worth sitting with.
The Benchmark Problem: Nobody Agrees What “Accurate” Means
Here’s the part that should worry anyone about to sign a contract with an AI code review vendor: the bug catch rate numbers those vendors publish don’t agree with each other, and they don’t agree with independent testing either.
Tool
Vendor-reported catch rate
Independent benchmark result
Greptile
82% (own 50-PR benchmark)
24% (Martian benchmark)
GitHub Copilot
54% (Greptile’s benchmark)
Not independently ranked in same test
CodeRabbit
44 to 51% (varies by benchmark)
46% (Macroscope’s ranking)
Cursor BugBot
Not separately vendor-reported
42% (Macroscope’s ranking)
Macroscope
Self-reported top performer
48% (its own ranking)
Source: Augment Code’s tool comparison, which flags the discrepancy directly, and buildmvpfast.com’s 2026 tool roundup. There is currently no independent, consensus benchmark for AI code review accuracy. Every number circulating in vendor decks was either run by the vendor or selected by the vendor. Treat any single “catch rate” claim as a marketing input, not a procurement fact, and run a short pilot against known bugs in your own codebase before you buy anything.
CodeRabbit’s own analysis of 470 pull requests, worth noting as vendor data about a competitor’s output rather than its own, found reviewers spend 91% more time reviewing AI generated code than human written code, with three times more readability problems and 75% more logic errors.
What This Means If You Run an Engineering Org
If you’re a VP of Engineering, a Director, or a staff engineer sitting on a tooling decision right now, here’s the shift that matters. Review is the bottleneck now, not code generation. If you’ve been measuring success by PRs merged or deployment frequency alone, you’re getting a misleading picture, because DORA’s and Faros’s data both show throughput metrics improving at the exact same time that stability metrics, change failure rate and rework rate especially, get worse.
DORA’s response to this was structural: the framework expanded from four metrics to five in 2024, adding “rework rate” specifically because AI driven throughput gains were making the old four-metric picture insufficient. That’s the metric to start tracking alongside deployment frequency, not instead of it.
GitHub’s own product team has landed on a position that’s becoming the de facto industry norm: a human always owns the merge button. From GitHub’s official blog:
The team’s interviews with developers found something specific worth stealing for your own workflow: running a Copilot self-review before opening a PR eliminated roughly a third of trivial back-and-forth comments. That’s the actual win available right now, catching the small stuff before a human ever sees the diff, not replacing the human’s judgment call on whether the change should exist at all.
Jon Wiggins, a machine learning engineer at Respondology, put the accountability question in plain terms:
“If an AI agent writes code, it’s on me to clean it up before my name shows up in git blame.”
Jon Wiggins, ML Engineer, Respondology · via github.blog
Any team that’s dropped the human merge gate entirely should be treated as an outlier taking on real production risk, not a leading indicator of where the industry is headed.
The Contrarian Case: 19% Slower, Not 20% Faster
The single strongest piece of contrarian evidence in this entire dataset comes from METR, the nonprofit Model Evaluation and Threat Research group. Its randomized controlled trial, reported in MIT Technology Review, found experienced developers believed AI made them 20% faster. Objective measurement of the same developers found they were actually 19% slower.
That’s not a survey. It’s a controlled study, which makes it much harder to wave away than the productivity claims coming out of vendor marketing. Mike Judge, a principal developer at the software consultancy Substantial, described the gap between perception and reality from the inside:
“I was complaining to people because I was like, ‘It’s helping me but I can’t figure out how to make it really help me a lot.’”
Mike Judge, Principal Developer, Substantial · via MIT Technology Review
Is the “AI review saves time” story realistic on a 2026 timeline? Not straightforwardly. The one controlled academic production study we found (the arXiv paper above) showed AI review increasing PR closure time. Any claim that AI review is a simple time saver needs that caveat attached, because in the best documented empirical test available, it wasn’t one.
GitHub Code Quality’s July Launch: A Real Test Case
There’s a genuinely useful stress test coming. GitHub Code Quality, the governance and quality gate product bundling CodeQL analysis with Copilot code review, moves from public preview to a paid, generally available product on July 20, 2026. More than 10,000 enterprises used the preview. Pricing lands at $10 per active committer per month on enabled repositories, plus usage based consumption for AI powered features like Copilot code review and Copilot Autofix.
Watch what happens to review time metrics at organizations adopting this over the next two quarters. If GitHub’s human-gated model actually closes the gap the data above describes, that’s the strongest real-world signal we’re likely to get all year.
What to Actually Do About It
Track rework rate and time-in-review, not just deployment frequency. A team that ships faster while rework climbs isn’t actually faster.
Keep a mandatory human merge gate. This is GitHub’s own stated product philosophy, not just an internal best practice.
Run AI self-review before human review, not instead of it. GitHub’s data shows this cuts trivial back-and-forth by roughly a third.
Pilot any review tool against your own codebase’s known bugs before trusting a vendor’s published catch rate.
Cap PR size. Multiple sources point to growing PR size, not tooling choice, as the actual driver of review slowdown.
FAQ
Does AI code review replace human code review?
No. Every credible source, including GitHub’s own product team, treats AI review as a first-pass filter for mechanical issues like typos and unused imports, while reserving architecture decisions and merge accountability for human reviewers. GitHub’s official position is that developers will always own the merge button.
How much time does AI code review actually save?
Results are mixed and contested. Vendor claims report time savings, but the most rigorous data, DORA’s 2025 report and Faros AI’s 2026 telemetry from 22,000 developers, found overall review time increasing, with median time-in-review up 441.5% as AI-generated code volume outpaced human review capacity.
What is the most accurate AI code review tool?
There is no independent consensus benchmark. Vendor-run tests and independent benchmarks disagree sharply. Greptile scores 82% bug-catch-rate on its own benchmark but 24% on the independent Martian benchmark. Pilot tools against your own codebase rather than trusting a published leaderboard.
Do AI code reviews catch more bugs than human reviewers?
AI reviewers are strong at mechanical pattern matching, things like missing awaits or unused variables, but consistently weaker at architectural and cross-file reasoning unless built around full-codebase indexing. No tool currently matches an experienced human reviewer’s judgment on whether a feature should exist at all.
Is AI-generated code more likely to have bugs than human-written code?
Yes, per multiple 2026 sources. CodeRabbit’s analysis of 470 pull requests found AI-generated code produced 75% more logic errors and three times more readability problems than human-written code, alongside rising bug rates as AI-code acceptance climbed from 20% to 60%.
Where This Goes Next
Here’s what the 2026 data actually tells you, stripped of the vendor gloss: AI hasn’t made code review faster. It’s made code review the bottleneck the rest of the pipeline is now waiting on, and the tools built to fix that problem haven’t closed the gap yet. Median time-in-review is up 441.5% at the same moment AI review tooling has proliferated across the industry. Those two facts sitting next to each other are the story.
Over the next 6 to 18 months, watch three things. First, whether GitHub Code Quality’s July 20 general availability launch actually moves review-time metrics at scale, since it’s the first major product to bundle static analysis and AI review under one governance umbrella with real enterprise adoption behind it. Second, whether an independent, non-vendor benchmark for AI review accuracy finally emerges, because right now buyers are flying blind. Third, whether DORA’s rework rate metric becomes standard practice at more organizations, since it’s currently the best early warning signal available for exactly the kind of quality debt this article describes.
Our read: this signals a market correction is coming for AI code review vendors who’ve been selling speed as the headline benefit. The winners over the next year will be the tools that reduce rework, not the ones with the flashiest catch-rate slide.
Want data-backed engineering and AI coverage like this in your inbox every week? Subscribe to The Neural Loop at neuralwired.com/newsletter.
DORA Report: AI Code Review Time Jumps 441% | NeuralWired
DevOps & Engineering
DORA Report: AI Code Review Time Jumps 441%
By the NeuralWired Engineering Desk · Updated July 2026 · 11 min read
Your team ships AI generated code faster than ever. Your review queue is where that speed goes to die. New data from Google’s DORA team and a 22,000 developer telemetry study from Faros AI both point to the same uncomfortable number: median time spent in code review is up 441.5% as AI adoption climbed, not down. If you’re an engineering leader who assumed AI code review would fix the bottleneck AI code generation created, the 2026 numbers say otherwise, and you need to see them before your next tooling decision.
Every AI coding tool vendor is currently selling some version of the same promise: write code faster, review it faster, ship it faster. The generation half of that promise is real. The review half is where the story falls apart.
Faros AI’s “AI Engineering Report 2026: The Acceleration Whiplash” is the most current dataset available on this question. It draws on two years of telemetry from 22,000 developers across more than 4,000 teams, comparing each organization’s lowest AI adoption periods to its highest. The headline findings:
Median time to first PR review is up 156.6%
Average time spent in code review is up 199.6%
Median time in review overall is up 441.5%
AI code acceptance rate rose from 20% to 60%
Faros AI sells engineering analytics software built on DORA metrics, so treat this as vendor research with a stake in the outcome, not a neutral academic study. Still, the direction of the finding lines up with Google’s own 2025 DORA State of AI Assisted Software Development report, produced with GitHub and IT Revolution. DORA’s framing is that AI acts as an amplifier: it strengthens teams that already have solid engineering practices, and it exposes the weaknesses of teams that don’t. Roughly 90% of developers now use AI daily, according to the report, but nearly a third, 30%, say they have little to no trust in AI generated code.
That distrust has a name in the DORA report: the “verification tax.” Time saved writing code gets spent auditing it instead, and that tax lands squarely on reviewers.
A note on the “4.2 hours vs 90 seconds” claim you might have seen elsewhere. That comparison doesn’t hold up against any primary source we checked. Real human review times range from roughly 4 hours at Google internally to 3 to 5 days at typical enterprise teams, and AI review tools themselves range from about 30 seconds (GitHub Copilot) to several minutes for deep-index tools like Greptile. We’re using the sourced numbers above instead.
Why Review Time Is Exploding, Not Shrinking
Kent Beck, the creator of Extreme Programming and a co-author of the Agile Manifesto, put it about as bluntly as anyone in the industry has:
“We’re accumulating code faster than we are accumulating trust.”
Kent Beck, “Trust Factory” newsletter, newsletter.kentbeck.com
That’s the whole problem in one sentence. AI generated code is, by multiple accounts, superficially convincing. It’s idiomatic. It’s well named. It reads like something a competent engineer wrote. Which is exactly why surface level review, the thing AI review tools are best at, becomes less useful over time: the bugs living in that code tend to be structural, not stylistic. Faros AI’s analysis makes the point directly, arguing that the engineers with the deepest system knowledge are the ones spending their most valuable hours unraveling plausible looking code that should never have reached them in that state.
An independent academic study published on arXiv in December 2024, still the most cited empirical study of its kind as of mid-2026, tested an LLM based automated review tool in real production repositories. Average PR closure time rose from 5 hours 52 minutes before the bot to 8 hours 20 minutes after, a statistically significant increase. Results varied by project. One project’s closure time dropped from 6 hours 6 minutes to 3 hours 7 minutes. Another rose from 20 hours 22 minutes to 30 hours 51 minutes. Roughly 73.8% of the tool’s comments were acted on, and developers reported a modest quality improvement, but the bot also introduced faulty reviews and irrelevant comments that added friction of its own.
Stack Overflow’s 2025 Developer Survey backs this up from the sentiment side: 84% of developers use or plan to use AI tools, yet 66% say their biggest pain point is AI output that’s “almost right,” and 45% say debugging AI generated code takes longer than debugging their own. Sonar’s State of Code 2026 survey of 1,149 developers found 96% don’t trust that AI generated code is functionally correct, but only 48% say they always review before committing. That gap between distrust and actual review discipline is worth sitting with.
The Benchmark Problem: Nobody Agrees What “Accurate” Means
Here’s the part that should worry anyone about to sign a contract with an AI code review vendor: the bug catch rate numbers those vendors publish don’t agree with each other, and they don’t agree with independent testing either.
Tool
Vendor-reported catch rate
Independent benchmark result
Greptile
82% (own 50-PR benchmark)
24% (Martian benchmark)
GitHub Copilot
54% (Greptile’s benchmark)
Not independently ranked in same test
CodeRabbit
44 to 51% (varies by benchmark)
46% (Macroscope’s ranking)
Cursor BugBot
Not separately vendor-reported
42% (Macroscope’s ranking)
Macroscope
Self-reported top performer
48% (its own ranking)
Source: Augment Code’s tool comparison, which flags the discrepancy directly, and buildmvpfast.com’s 2026 tool roundup. There is currently no independent, consensus benchmark for AI code review accuracy. Every number circulating in vendor decks was either run by the vendor or selected by the vendor. Treat any single “catch rate” claim as a marketing input, not a procurement fact, and run a short pilot against known bugs in your own codebase before you buy anything.
CodeRabbit’s own analysis of 470 pull requests, worth noting as vendor data about a competitor’s output rather than its own, found reviewers spend 91% more time reviewing AI generated code than human written code, with three times more readability problems and 75% more logic errors.
What This Means If You Run an Engineering Org
If you’re a VP of Engineering, a Director, or a staff engineer sitting on a tooling decision right now, here’s the shift that matters. Review is the bottleneck now, not code generation. If you’ve been measuring success by PRs merged or deployment frequency alone, you’re getting a misleading picture, because DORA’s and Faros’s data both show throughput metrics improving at the exact same time that stability metrics, change failure rate and rework rate especially, get worse.
DORA’s response to this was structural: the framework expanded from four metrics to five in 2024, adding “rework rate” specifically because AI driven throughput gains were making the old four-metric picture insufficient. That’s the metric to start tracking alongside deployment frequency, not instead of it.
GitHub’s own product team has landed on a position that’s becoming the de facto industry norm: a human always owns the merge button. From GitHub’s official blog:
The team’s interviews with developers found something specific worth stealing for your own workflow: running a Copilot self-review before opening a PR eliminated roughly a third of trivial back-and-forth comments. That’s the actual win available right now, catching the small stuff before a human ever sees the diff, not replacing the human’s judgment call on whether the change should exist at all.
Jon Wiggins, a machine learning engineer at Respondology, put the accountability question in plain terms:
“If an AI agent writes code, it’s on me to clean it up before my name shows up in git blame.”
Jon Wiggins, ML Engineer, Respondology · via github.blog
Any team that’s dropped the human merge gate entirely should be treated as an outlier taking on real production risk, not a leading indicator of where the industry is headed.
The Contrarian Case: 19% Slower, Not 20% Faster
The single strongest piece of contrarian evidence in this entire dataset comes from METR, the nonprofit Model Evaluation and Threat Research group. Its randomized controlled trial, reported in MIT Technology Review, found experienced developers believed AI made them 20% faster. Objective measurement of the same developers found they were actually 19% slower.
That’s not a survey. It’s a controlled study, which makes it much harder to wave away than the productivity claims coming out of vendor marketing. Mike Judge, a principal developer at the software consultancy Substantial, described the gap between perception and reality from the inside:
“I was complaining to people because I was like, ‘It’s helping me but I can’t figure out how to make it really help me a lot.’”
Mike Judge, Principal Developer, Substantial · via MIT Technology Review
Is the “AI review saves time” story realistic on a 2026 timeline? Not straightforwardly. The one controlled academic production study we found (the arXiv paper above) showed AI review increasing PR closure time. Any claim that AI review is a simple time saver needs that caveat attached, because in the best documented empirical test available, it wasn’t one.
GitHub Code Quality’s July Launch: A Real Test Case
There’s a genuinely useful stress test coming. GitHub Code Quality, the governance and quality gate product bundling CodeQL analysis with Copilot code review, moves from public preview to a paid, generally available product on July 20, 2026. More than 10,000 enterprises used the preview. Pricing lands at $10 per active committer per month on enabled repositories, plus usage based consumption for AI powered features like Copilot code review and Copilot Autofix.
Watch what happens to review time metrics at organizations adopting this over the next two quarters. If GitHub’s human-gated model actually closes the gap the data above describes, that’s the strongest real-world signal we’re likely to get all year.
What to Actually Do About It
Track rework rate and time-in-review, not just deployment frequency. A team that ships faster while rework climbs isn’t actually faster.
Keep a mandatory human merge gate. This is GitHub’s own stated product philosophy, not just an internal best practice.
Run AI self-review before human review, not instead of it. GitHub’s data shows this cuts trivial back-and-forth by roughly a third.
Pilot any review tool against your own codebase’s known bugs before trusting a vendor’s published catch rate.
Cap PR size. Multiple sources point to growing PR size, not tooling choice, as the actual driver of review slowdown.
FAQ
Does AI code review replace human code review?
No. Every credible source, including GitHub’s own product team, treats AI review as a first-pass filter for mechanical issues like typos and unused imports, while reserving architecture decisions and merge accountability for human reviewers. GitHub’s official position is that developers will always own the merge button.
How much time does AI code review actually save?
Results are mixed and contested. Vendor claims report time savings, but the most rigorous data, DORA’s 2025 report and Faros AI’s 2026 telemetry from 22,000 developers, found overall review time increasing, with median time-in-review up 441.5% as AI-generated code volume outpaced human review capacity.
What is the most accurate AI code review tool?
There is no independent consensus benchmark. Vendor-run tests and independent benchmarks disagree sharply. Greptile scores 82% bug-catch-rate on its own benchmark but 24% on the independent Martian benchmark. Pilot tools against your own codebase rather than trusting a published leaderboard.
Do AI code reviews catch more bugs than human reviewers?
AI reviewers are strong at mechanical pattern matching, things like missing awaits or unused variables, but consistently weaker at architectural and cross-file reasoning unless built around full-codebase indexing. No tool currently matches an experienced human reviewer’s judgment on whether a feature should exist at all.
Is AI-generated code more likely to have bugs than human-written code?
Yes, per multiple 2026 sources. CodeRabbit’s analysis of 470 pull requests found AI-generated code produced 75% more logic errors and three times more readability problems than human-written code, alongside rising bug rates as AI-code acceptance climbed from 20% to 60%.
Where This Goes Next
Here’s what the 2026 data actually tells you, stripped of the vendor gloss: AI hasn’t made code review faster. It’s made code review the bottleneck the rest of the pipeline is now waiting on, and the tools built to fix that problem haven’t closed the gap yet. Median time-in-review is up 441.5% at the same moment AI review tooling has proliferated across the industry. Those two facts sitting next to each other are the story.
Over the next 6 to 18 months, watch three things. First, whether GitHub Code Quality’s July 20 general availability launch actually moves review-time metrics at scale, since it’s the first major product to bundle static analysis and AI review under one governance umbrella with real enterprise adoption behind it. Second, whether an independent, non-vendor benchmark for AI review accuracy finally emerges, because right now buyers are flying blind. Third, whether DORA’s rework rate metric becomes standard practice at more organizations, since it’s currently the best early warning signal available for exactly the kind of quality debt this article describes.
Our read: this signals a market correction is coming for AI code review vendors who’ve been selling speed as the headline benefit. The winners over the next year will be the tools that reduce rework, not the ones with the flashiest catch-rate slide.
Want data-backed engineering and AI coverage like this in your inbox every week? Subscribe to The Neural Loop at neuralwired.com/newsletter.
Cloud Repatriation 2026: The Data Behind the CIO Shift
Cloud Infrastructure / 2026 Data
Cloud Repatriation 2026: The Data Behind the CIO Shift
By The Neural Loop Desk · NeuralWired.com
GEICO’s infrastructure team ran the numbers and found something uncomfortable: storage in the cloud was one of the most expensive things they were doing, with AI workloads close behind. So the third largest auto insurer in the country started moving pieces of its stack back home. That single decision is a small window into a much bigger story: cloud repatriation is real, it’s measurable, and in 2026 it’s reshaping how enterprises decide where a workload actually belongs.
This isn’t the “cloud is dead” narrative some headlines are chasing. It’s messier and more useful than that. Below is what the 2025 and 2026 survey data actually shows, who’s really moving workloads and why, and where the skeptics have a point worth taking seriously.
Hybrid cloud isn’t a transitional phase anymore. It’s the default. Flexera’s 2026 State of the Cloud Report, based on 753 cloud decision makers, found that 73% of organizations now operate a hybrid estate, up three percentage points year over year. Among organizations with more than 5,000 employees, that number climbs to 78%.
At the same time, public cloud spending keeps climbing. Gartner forecasts worldwide public cloud end user spending will hit $723.4 billion in 2025, a 21.5% increase. Those two facts sound contradictory until you understand what repatriation actually looks like on the ground: it’s workload by workload, not company by company.
Why this matters
Repatriation and cloud growth are rising at the same time because net new cloud adoption still outpaces the workloads moving out. This isn’t an exodus. It’s a correction, and it changes how every infrastructure team should evaluate a new deployment.
The Numbers: Planned vs. Actual Repatriation
The gap between intent and action is the most important, and most underreported, part of this story.
Metric
Figure
Source
CIOs planning some workload repatriation in 2025
86% (highest ever recorded)
Barclays CIO Survey
Cloud workloads actually repatriated so far
21%, up 2 points YoY
Flexera 2026 Report
Organizations planning a full cloud exit
8% to 9%
IDC Server and Storage Workloads Survey
Cloud infrastructure spend considered wasted
27%, down from 32% four years ago
Flexera 2026 Report
Read those four rows together and a clearer picture forms. Most CIOs are open to moving something. Very few are moving everything. And the underlying driver, wasted spend, is actually improving as FinOps practices mature. That’s not the framing most “cloud is dying” articles use, but it’s the one the data supports.
Years ago, people talked about repatriation, but “no one was doing it, it just wasn’t a thing.”
Brian Adler, Senior Director of Cloud Market Strategy, Flexera · CIO Dive
What changed since then is measurement. Adler’s colleague Jay Litkey, SVP of Cloud and FinOps at Flexera and a governing board member at the FinOps Foundation, put it plainly: teams have gotten good enough at cost allocation that “FinOps is providing the data to make repatriation decisions.” Before, repatriation was a hunch. Now it’s a spreadsheet.
Why Enterprises Are Rethinking Cloud-First
Four drivers show up consistently across the survey data and the case studies:
Cost at scale. A third of surveyed organizations now budget $12 million or more a year for public cloud, according to CIO Dive’s reporting on Flexera’s survey. At that spending level, even small percentage savings translate into real capital.
AI and GPU workloads. Steady, high utilization AI workloads often price out better on owned infrastructure than on elastic cloud billing, which is one reason GEICO named AI spend as a specific pain point alongside storage.
Data sovereignty and compliance. Regulatory frameworks like the EU AI Act are pushing some workloads toward infrastructure with clearer jurisdictional control.
Vendor lock-in fatigue. After a decade of cloud-first defaults, some infrastructure teams are simply asking whether “cloud” was ever the right answer for a specific, predictable workload, rather than a blanket policy.
IDC’s Natalya Yezhkova, Research VP in the firm’s Enterprise Infrastructure Practice, frames the shift as a change in posture rather than a reversal. Cloud only is “becoming a less prevalent approach,” she told Data Center Dynamics, replaced by what she calls a “cloud also” mindset.
Real Case Studies: GEICO, 37signals, Dropbox
GEICO: The Insurer Rethinking a 600-App Migration
GEICO began migrating to the cloud in 2013 across more than 600 applications. Over a decade later, Rebecca Weekly, VP of Platform and Infrastructure Engineering, confirmed to The Stack that the company is repatriating workloads as part of a broader architectural overhaul. Her reasoning was direct: “storage in the cloud is one of the most expensive things you can do.”
37signals: The Most Cited Number in Every Repatriation Article
37signals, the company behind Basecamp and HEY, pulled its infrastructure off AWS and Google Cloud starting in 2022. It now reports roughly $1.3 million to $1.5 million in annual savings, or close to $7 million over five years, according to figures compiled by HyScaler. It’s the go-to proof point in nearly every article on this topic, and for good reason. But it comes with a catch, more on that below.
Dropbox: The Original Case Study
Dropbox’s build out of its own storage system, known as Magic Pocket, starting around 2013, is widely considered the founding example of large scale repatriation, predating the current wave by roughly a decade.
The Counterargument: Is This Overstated?
Not everyone buys the resurgence narrative, and the skeptics deserve equal airtime here.
Corey Quinn, Chief Cloud Economist at The Duckbill Group, has argued that “cloud repatriation isn’t a thing” in any broad sense, and points out that the loudest advocates for leaving the cloud often have a commercial stake in that outcome. It’s worth noting Quinn’s own firm sells cloud cost optimization services, meaning his incentive runs the opposite direction: keep clients on the cloud, just spend less. Both sides of this debate have a horse in the race.
Gartner has gone further, publishing research titled “Moving Beyond the Myth of Repatriation,” arguing that on-premises vendors are pushing a false narrative and that most repatriation projects that fail were poorly scoped from the start, not doomed by the cloud itself.
There’s also a semantic wrinkle worth flagging. Gartner analyst Rene Buest calls much of what gets reported as European repatriation “geopatriation” instead, meaning companies are moving to local or regional cloud providers, not back to private infrastructure. In a survey of 241 Western European IT leaders conducted between May and July 2025, 61% said geopolitical factors would increase their reliance on regional cloud providers. That’s a real trend, but it’s a different trend than the one most headlines describe.
The honest caveat on 37signals
37signals runs steady, predictable, well understood workloads, which is close to the textbook best case for repatriation. Most enterprises have a far messier workload mix: bursty traffic, legacy dependencies, uneven ownership across teams. The $7 million savings figure is real, but treating it as a universal template is where a lot of repatriation projects go wrong.
What CTOs and FinOps Leads Should Do Now
The practical shift for infrastructure leaders isn’t “leave the cloud.” It’s building a documented, ongoing framework for deciding where each workload belongs, evaluated on cost, compliance, latency, and data gravity, rather than defaulting to cloud-first for everything new. We broke down exactly that process, including a five-step workload placement model and ROI benchmarks, in our companion piece on a five-step AI workload placement framework for structuring that shift.
A few things worth doing before committing capital to any repatriation project:
Get real cost-per-workload data before deciding anything. Litkey’s point stands: FinOps maturity is what makes these decisions defensible instead of reactive.
Separate “predictable and steady” workloads from “bursty and uncertain” ones. The former are repatriation candidates. The latter usually still favor elastic cloud pricing.
Factor in the 27% cloud waste figure before assuming repatriation is the only lever. Flexera’s data suggests a meaningful chunk of the cost problem can be solved without moving anything.
Treat compliance-driven moves and cost-driven moves as separate decisions with separate criteria, since they often point to different infrastructure choices entirely.
Cloud repatriation is the process of moving applications, workloads, or data from public cloud providers like AWS, Azure, or Google Cloud back to on-premises infrastructure, private clouds, or colocation facilities. It’s rarely a full exit. Most organizations move only specific, cost-sensitive workloads.
Why are companies leaving the cloud?
The leading drivers are unpredictable costs at scale, data sovereignty and compliance requirements, performance needs for AI and latency-sensitive workloads, and vendor lock-in. Flexera reports 27% of cloud spend is considered wasted, while IDC finds cost and compliance are the top repatriation motivators.
How many companies are doing cloud repatriation?
Roughly 86% of CIOs planned some level of workload repatriation in 2025, the highest rate ever recorded, per Barclays’ CIO Survey. But only about 8% to 9% plan a full exit, per IDC, and actual repatriated workloads sit at 21%, per Flexera’s 2026 report.
Is cloud repatriation a real trend or hype?
Both views have credible backing. Gartner and cloud cost consultants like Corey Quinn argue repatriation is overstated and often vendor driven. Flexera’s survey data shows a real, measurable two point year over year increase in actual repatriated workloads, suggesting a modest but genuine shift, not a mass exodus.
What companies have done cloud repatriation?
The most cited examples are Dropbox, which built its own Magic Pocket storage system starting in 2013, 37signals (Basecamp, HEY), which left AWS and Google Cloud in 2022 and reports close to $7 million in five year savings, and GEICO, which is moving workloads back amid a major infrastructure overhaul after cloud storage and AI costs rose sharply.
Where This Goes Next
The two numbers to watch over the next 12 to 18 months are the 21% actual repatriation figure and the 27% cloud waste figure. If FinOps maturity keeps chipping away at waste, some of the pressure driving repatriation eases on its own. If it doesn’t, expect the 21% to keep climbing toward the 86% intent figure, and expect AI and GPU workload economics specifically to be the next flashpoint.
Three things worth tracking:
Whether Flexera’s next report shows the 21% figure accelerating or plateauing
How many enterprises follow GEICO’s lead on AI workload placement specifically, separate from general storage costs
Whether “geopatriation” becomes its own tracked category in 2027 surveys, separate from true on-premises repatriation
What’s clear now, and wasn’t as clear a year ago, is that this isn’t a binary choice between cloud and on-premises. It’s a workload-by-workload calculation, and the companies getting it right are the ones treating it as an ongoing discipline rather than a one-time migration decision.
The Cloud Native Readiness Audit CTOs Need in 2026
Cloud Infrastructure
The Cloud Native Readiness Audit CTOs Need in 2026
By the NeuralWired Editorial Team | July 1, 2026
Cloud native application architecture now runs 98% of enterprises, according to CNCF’s newest annual survey. So the question your team is actually facing in 2026 isn’t whether to adopt it. It’s whether you’re ready to run what you’ve already built. Most companies aren’t, and the data on why is more useful than any failure-rate headline could be.
A Note on the Number You Won’t See in This Article
You may have seen the claim that cloud native rebuilds fail at four times the rate of legacy rewrites in year one. We went looking for the source. CNCF, Gartner, Forrester, IDC, McKinsey, and the peer-reviewed literature don’t contain it. It traces back to statistics-aggregator sites whose raw data includes garbled figures like “841% of organizations,” which is a strong sign of scraped or fabricated content, not research. We’re not repeating it, and we’d suggest treating it as false anywhere else you see it cited.
The Adoption Number That Changes the Question
Here’s the number that matters. CNCF’s 2025 Annual Cloud Native Survey, covering 628 organizations and published through Linux Foundation Research on January 20, 2026, found that cloud native adoption has reached 98% of organizations. That’s not a growth statistic anymore. That’s saturation.
Kubernetes tells the same story from a different angle. Among companies using containers, 82% now run Kubernetes in production, up from 66% just two years earlier. A separate CNCF and SlashData census, released at KubeCon North America in November 2025, put a number on the workforce behind all of this: 15.6 million developers now work with cloud native technologies globally, with 77% of backend developers using at least one of these tools.
If you’re a CTO weighing whether to greenlight a cloud native migration this quarter, the honest answer is that your competitors already did. The question worth your time isn’t “should we.” It’s “are we set up to actually pull this off, or are we about to join the pile of teams who adopted the stack and never got the operating discipline to match it.”
What “Readiness” Actually Means
CNCF didn’t leave this vague. The organization maintains a public Cloud Native Maturity Model, scored across levels 0 through 4+, that grades an organization on three separate axes: technology, process, and culture. Most teams treat cloud native readiness as a purely technical checklist. Container orchestration, service mesh, observability stack, done. The maturity model says that’s maybe a third of the job.
Process and culture are where the audit in this piece spends most of its time, because that’s where the CNCF’s own leadership says the real gap has moved.
“This year’s data shows that the next phase of cloud native evolution will be as much about people and platforms as it is about the tech itself.”
Hilary Carter, Senior Vice President of Research, Linux Foundation Research, January 20, 2026
Read that quote again if you’re the person signing off on next quarter’s cloud budget. Carter runs the team that produces the industry’s most-cited adoption survey, and her framing isn’t “adopt more tech.” It’s “your org chart is now part of the architecture.”
The Case Against Building Cloud Native From Scratch
There’s a contrarian thread running through this whole conversation, and it comes from Martin Fowler, Chief Scientist at ThoughtWorks and one of the most cited voices in software architecture. Fowler’s long-standing position, laid out in his essay “MonolithFirst”, cuts against the instinct to build cloud native from day one.
“Almost all the successful microservice stories have started with a monolith that got too big and was broken up. Almost all the cases where I’ve heard of a system that was built as a microservice system from scratch, it has ended up in serious trouble.”
Martin Fowler, Chief Scientist, ThoughtWorks
Fowler’s related concept, the “microservice premium,” is the part CTOs tend to skip past. The idea is simple: distributed systems cost more to build, operate, and debug than monoliths do, and that cost only pays for itself once your organization has outgrown what a monolith can handle. Build cloud native before you hit that threshold, and you’re paying the tax without collecting the benefit.
This is worth sitting with, because it directly complicates the popular framing of “legacy equals risk, modern equals safety.” Fowler’s evidence points closer to the opposite. The successful systems he’s tracked over a decade mostly started as something simpler and grew into the complexity, rather than being born into it.
Why the Real Risk Isn’t Your Architecture
Put Carter’s and Fowler’s positions side by side and a pattern emerges. Neither one says the technology is the problem. Both point at organizational readiness, in different ways: Fowler at whether your team has actually earned the complexity, Carter at whether your platform and culture can support what you’ve already deployed.
That matters for how you frame an internal readiness review. A pure architecture comparison, native rebuild versus legacy rewrite, misses where the actual risk sits. If your 2026 audit only checks Kubernetes version compliance and service mesh configuration, you’re grading a third of the exam.
Cost Governance Is a Day-1 Decision Now
Here’s where the readiness argument gets financial teeth. Flexera’s 15th annual State of the Cloud Report, based on 753 global cloud decision-makers and published March 18, 2026, found that wasted cloud spend climbed to 29% of IaaS and PaaS budgets, the first increase in five years. Five years of steady improvement, reversed in one cycle, largely driven by AI workload complexity and pricing structures teams weren’t ready to model.
The same report found that 71% of organizations now run a formal Cloud Center of Excellence, and 63% have a dedicated FinOps team. That’s not a coincidence. It’s the shape of what readiness looks like in practice, and it’s also a signal about sequencing: the companies avoiding the waste spike built governance structures before they scaled, not after.
“Cloud is maturing and visibility across technology is increasing. We’ve moved beyond treating the cloud as a cost-cutting exercise and now see it as the essential foundation for growth. As AI is reshaping cloud economics and risk, having centralized oversight is more critical than ever.”
Brian Shannon, Chief Technology Officer, Flexera, March 18, 2026
There’s a hybrid reality check buried in the same dataset worth flagging: 73% of organizations run hybrid cloud, up three points year over year. The binary framing of “go all in or stay legacy” doesn’t match how real infrastructure actually looks in 2026. Readiness is about sequencing which workloads move and when, not an all-or-nothing bet.
AI Workloads Just Added a New Readiness Layer
If your last cloud native audit predates your AI initiatives, it’s already out of date. Flexera’s 2026 data shows 53% of cloud leaders now cite security and compliance as their top challenge specifically for AI workloads running on cloud infrastructure, with 40% citing data quality. Neither of these is a Kubernetes problem. Both are governance problems that sit squarely inside the “process and culture” axes of the CNCF maturity model, not the technology axis.
Our read: teams that treat AI workload governance as a bolt-on to an already-mature stack are underestimating the lift. It needs its own line item in the audit, not a footnote.
The 8-Stage Cloud Native Readiness Audit
This framework maps onto CNCF’s official maturity model axes: technology, process, and culture. Run through it before your next migration sign-off, not after.
Stage
What You’re Checking
Why It’s on the List
1. Kubernetes production posture
Version compliance, resource utilization, autoscaling configuration
82% of container users now run K8s in production; utilization gaps are the most common operational failure mode
Cloud waste hit 29% in 2026, the first rise in five years
6. Team topology fit
Does your org size and structure justify the microservice premium you’re paying
Fowler’s core argument: complexity should follow organizational scale, not precede it
7. Data quality for AI workloads
Pipeline governance, lineage tracking, model input validation
Cited by 40% of cloud leaders as a top AI-on-cloud blocker
8. Hybrid sequencing plan
Which workloads move first, which stay put, and why
73% of organizations run hybrid cloud; an all-or-nothing plan is already out of step with the market
Notice that only two of the eight stages are purely technical. That ratio isn’t accidental. It reflects where CNCF, Flexera, and Fowler all independently point: the technology has matured faster than most organizations’ ability to govern it.
Frequently Asked Questions
What is cloud native application architecture?
Cloud native application architecture builds and runs applications to fully exploit cloud computing, using containers, microservices, and declarative APIs like Kubernetes, rather than simply relocating existing software onto cloud infrastructure without redesigning it.
What is the CNCF Cloud Native Maturity Model?
It’s a staged framework, levels 0 through 4+, published by CNCF for assessing an organization’s technology, process, and cultural readiness for cloud native adoption. Teams use it to benchmark gaps before scaling further deployments.
Should I rewrite my legacy app as cloud native, or migrate it as-is?
Martin Fowler’s widely cited “Monolith First” guidance argues most successful cloud native systems began as a monolith before being broken up. Building cloud native from scratch carries a documented “microservice premium” in added cost and operational risk.
How much cloud spend gets wasted, and why does it matter for readiness?
Flexera’s 2026 State of the Cloud Report found 29% of IaaS and PaaS spend is wasted, the first increase in five years, driven largely by AI workload complexity. It’s evidence that cost governance needs to be assessed before scaling cloud native systems, not after.
Where This Goes Next
The number to remember from this piece isn’t a failure rate. It’s 98%. Cloud native adoption stopped being a strategic bet years ago and became table stakes, which means the competitive edge in 2026 has quietly moved from “did you adopt” to “did you build the governance to run it.” Watch three things over the next 6 to 18 months: whether the AI-driven cloud waste spike Flexera flagged continues into 2027, whether FinOps team headcount keeps climbing past this year’s 63%, and whether CNCF’s maturity model gets a dedicated AI-readiness axis in its next revision.
If you’re running your own audit this quarter, start with the 8-stage framework above, and weight the process and culture stages as heavily as the technical ones. That’s not a hedge. It’s what the primary research actually shows.
GitOps Kubernetes Deployment: Why 58% of Top Teams Use It Extensively (2026)Platform Engineering
GitOps on Kubernetes: Why 58% of Top Teams Now Run It Extensively
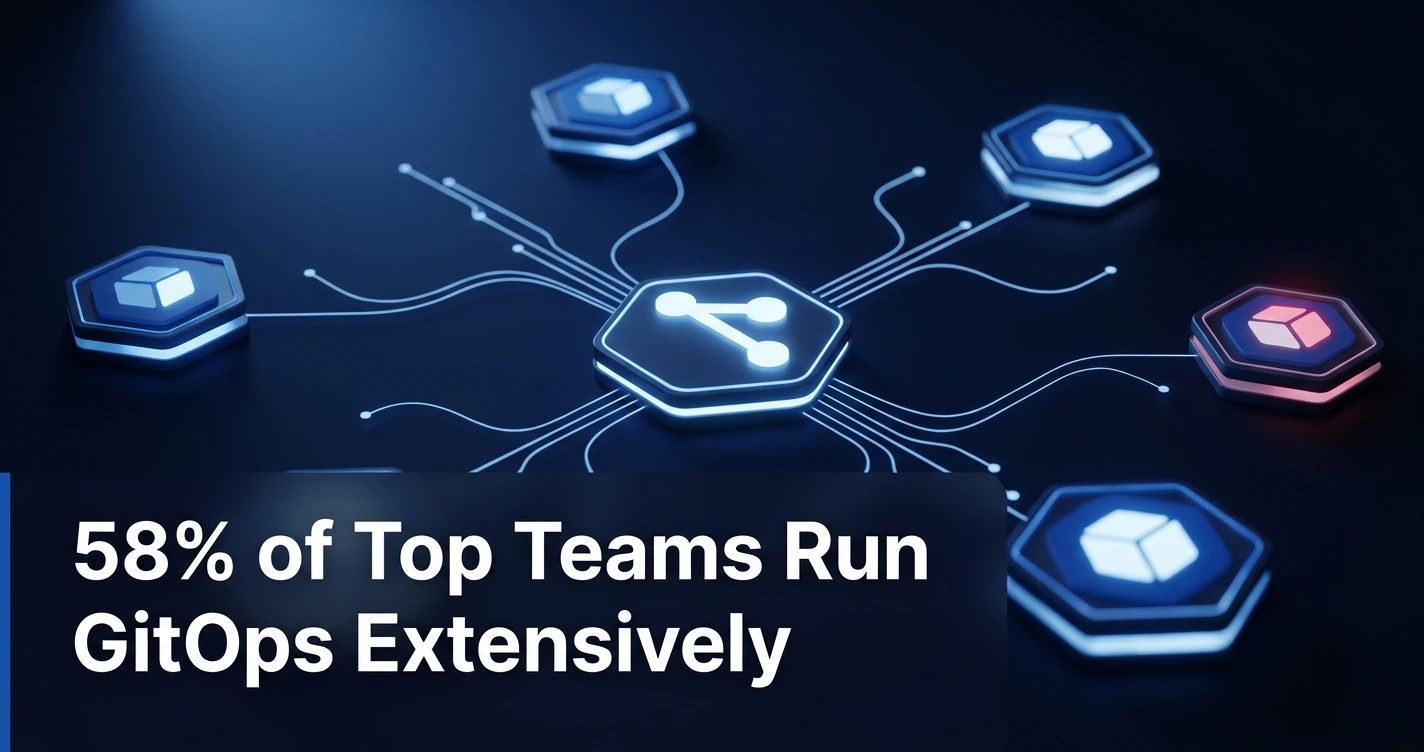
Your platform team just shipped a Friday afternoon change with a single kubectl apply, and nobody remembers exactly what the cluster looked like before. That’s the moment GitOps exists to prevent. According to CNCF’s 2025 Annual Cloud Native Survey, 58% of the most mature cloud native organizations now run GitOps extensively, compared to just 23% of mid-tier teams and effectively none of the newcomers. That gap is the story: GitOps has quietly become the line separating platform teams that scale Kubernetes confidently from teams that are still fighting their own infrastructure.
This piece breaks down what that 58% figure actually measures, what Argo CD’s dominance tells you about where the tooling market landed, and where the real operational risk still hides, because the marketing version of this story leaves out the part where your Git repository becomes a single point of failure.
Start with the number everyone’s going to misquote. CNCF’s 2025 Annual Cloud Native Survey, fielded in September 2025 and published in January 2026, segments organizations into three maturity tiers: explorers, adopters, and innovators. Among innovators, the most advanced tier, 58% report using GitOps extensively. Among adopters, that number drops to 23%. Among explorers, it’s effectively zero.
That’s an adoption maturity statistic, not an incident reduction statistic, and the distinction matters. GitOps isn’t a feature you switch on; it’s a marker of how far along a platform team’s practices already are. Hilary Carter, Senior Vice President of Research at Linux Foundation Research, framed the broader finding this way:
“This year’s data shows that the next phase of cloud native evolution will be as much about people and platforms as it is about the tech itself. Organizations that invest in both will have a clear advantage.”
Hilary Carter, SVP of Research, Linux Foundation Research, via CNCF, January 2026
That 82% production Kubernetes adoption figure (up from 66% in 2023) is the backdrop. GitOps is what mature teams are doing once Kubernetes itself stops being the hard part.
Worth knowing: An earlier 2025 CNCF wave (689 respondents, reported in April) found 77% of organizations had adopted GitOps “to some degree.” That’s a broader, unsegmented number measuring a different population than the 58% innovator figure above. Don’t treat them as the same statistic; they answer different questions.
Argo CD’s Quiet Takeover of Kubernetes Delivery
If GitOps is the practice, Argo CD is increasingly the default engine running it. The 2025 CNCF/Argo CD End User Survey, released July 24, 2025, found that Argo CD now runs on nearly 60% of Kubernetes clusters used for application delivery among respondents. Ninety-seven percent of those users run it in production, up from 93% in 2023. The tool posted a Net Promoter Score of 79, the kind of number SaaS companies build entire marketing campaigns around.
Metric
2023
2025
Production usage among Argo CD users
93%
97%
Share of GitOps-managed clusters running Argo CD
—
~60%
Net Promoter Score
—
79
Platform engineers as share of users
—
37%
Dan Garfield, VP of Open Source at Octopus Deploy and an Argo CD maintainer, put the results in plain terms:
“Argo CD is trusted, stable, and delivering real operational gains at scale. These trends reflect how central Argo CD has become to running reliable, efficient cloud native infrastructure.”
Dan Garfield, VP of Open Source, Octopus Deploy; Argo CD maintainer, CNCF press release, July 24, 2025
Garfield isn’t a neutral observer here. He’s also a co-creator of the OpenGitOps principles and joined Octopus Deploy through its acquisition of Codefresh, which gives him a foot in both the open source maintainer world and the commercial CD vendor world. That dual vantage point is exactly why his read on where teams still struggle (more on that below) carries weight.
Does GitOps Actually Improve Reliability?
Here’s the question every platform lead actually wants answered: does any of this make production more stable? The honest answer is “probably, but the data is correlational.”
Octopus Deploy’s State of GitOps Report, based on 660 survey responses and released June 17, 2025, found that teams with higher GitOps maturity scores show stronger DORA 4 performance (deployment frequency, lead time for changes, change failure rate, and recovery time) and better reported reliability, including less downtime and fewer slowdowns. Ninety-three percent of organizations surveyed plan to continue or expand GitOps adoption.
What the report doesn’t claim is a clean cause and effect line. Teams with mature GitOps practices also tend to have better observability, stronger staffing, and more disciplined engineering culture overall, any of which could be doing the heavy lifting on reliability. Our read: GitOps maturity is a reliable proxy for “this team has its act together,” more than it is a standalone fix you can bolt onto a struggling platform and expect DORA metrics to improve on their own.
What Actually Changes for Your Team
Production changes start happening through Git commits and pull requests instead of direct kubectl apply commands or ad hoc CI pushes. Your audit trail becomes commit history instead of a separate change ticket. A controller, usually Argo CD or Flux, continuously compares live cluster state against what’s declared in Git and corrects drift automatically, often before anyone notices a problem.
The Risk Nobody Puts on the Slide
Is it weird that the same property making GitOps powerful, a single source of truth in Git, also makes it dangerous? Not really, once you think about it: centralizing control always centralizes risk too.
The most cited operational risk across the security research is secrets sitting in Git repositories. Even encrypted secrets can be exposed if key management is sloppy, and a compromised cluster-specific key (with tools like Sealed Secrets) can cascade across every secret tied to that cluster. Per the 2025 Verizon Data Breach Investigations Report, as cited by Keeper Security, 39% of secrets exposed in public Git repositories were tied to web application infrastructure. Layer on AI tooling and the problem accelerates: GitGuardian’s internal research found AI-service credential leaks grew 81% year over year in 2025.
Then there’s the part marketing decks skip entirely: the platforms GitOps depends on are getting less reliable, not more. GitProtect.io’s DevOps Threats Unwrapped Mid-Year Report 2025 tracked 330 incidents across GitHub, GitLab, Bitbucket, Jira, and Azure DevOps in just the first half of 2025. GitHub incidents alone rose 58% year over year, climbing from 69 to 109. Azure DevOps suffered a single 159-hour global degradation in January 2025, the kind of outage that would stall any GitOps pipeline depending on it. Greg Bak, Head of Product Enablement at GitProtect, didn’t soften the warning:
“We are witnessing a clear upward trend in outages and disruptions across DevOps platforms, demonstrating that traditional perimeter security is no longer sufficient. Anticipating failures before they happen, paired with self-healing infrastructure, will redefine how organizations safeguard uptime and business continuity.”
Greg Bak, Head of Product Enablement, GitProtect, via Channel Insider, September 2025
This is the contrarian point platform leaders genuinely need to sit with: GitOps gives you a clean source of truth, but that source of truth now lives on infrastructure that fails more often than the previous year, not less. Teams that don’t budget for secrets architecture (External Secrets Operator, HashiCorp Vault, or SOPS) as a deliberate decision, not an afterthought, are building their reliability story on a foundation they haven’t actually secured.
The Real Barrier Isn’t the Tooling Anymore
The CNCF 2025 survey surfaced something that should reframe how engineering leaders budget for GitOps rollouts: for the first time, cultural and organizational challenges (47%) overtook technical complexity as the top barrier to cloud native adoption. CNCF Executive Director Jonathan Bryce summarized the broader shift this way:
“Kubernetes isn’t just scaling applications; it’s becoming the platform for intelligent systems.”
Jonathan Bryce, Executive Director, CNCF, via PR Newswire, January 2026
Translate that into a practical takeaway: if you’re stalled on GitOps adoption, the blocker probably isn’t Argo CD versus Flux. It’s getting application teams to trust a pull-request based deployment model, documenting the new workflow, and giving platform teams the internal credibility to enforce it. Budget for change management the same way you’d budget for a tooling migration, because at this point, that’s what the data says actually determines success.
Frequently Asked Questions
What is GitOps in Kubernetes?
GitOps is an operational model that uses a Git repository as the single source of truth for Kubernetes infrastructure and application configuration. A controller like Argo CD or Flux continuously compares live cluster state to what’s declared in Git and automatically reconciles drift, making every production change reviewable and auditable.
What’s the difference between GitOps and DevOps?
DevOps is a broad cultural framework uniting development and operations. GitOps is a specific practice within it, using Git as the control plane for declarative infrastructure and deployment state, typically implemented with Argo CD or Flux on Kubernetes.
Is Argo CD better than Flux?
Neither tool is universally better. Argo CD offers a web UI, broader enterprise adoption (around 60% of GitOps-managed clusters per CNCF’s 2025 survey, with a 79 NPS), and stronger multi-tenancy features. Flux is lighter-weight and more CLI and automation-first. The right choice depends on team size and UI needs.
How does GitOps improve Kubernetes reliability?
GitOps continuously reconciles live cluster state against Git, catching configuration drift automatically instead of during an incident. Octopus Deploy’s survey data links higher GitOps maturity to better DORA 4 metrics, though this reflects correlation across surveyed teams rather than an isolated causal study.
What are the security risks of GitOps?
The most cited risks are secrets stored directly in Git (even encrypted secrets can be exposed through weak key management), excessive RBAC permissions, and the fact that one compromised repository can push unauthorized changes across every cluster it manages. Teams typically mitigate this with external secrets stores rather than committing secrets to the repo.
What to Watch Next
Here’s what you now know that you probably didn’t ten minutes ago: that “58%” headline number is real, but it measures adoption maturity among the most advanced cloud native teams, not a magic incident reduction rate. Argo CD has effectively consolidated the GitOps tooling market. And the infrastructure underneath all of it, GitHub, GitLab, Azure DevOps, is having a rougher year than the GitOps success stories let on.
Over the next six to eighteen months, watch three things: whether secrets management tooling (External Secrets Operator, Vault integrations) becomes a default part of GitOps reference architectures instead of an add-on; whether Argo CD’s enterprise lead over Flux widens further given Octopus Deploy’s backing; and whether platform teams start publishing real DORA metric improvements tied to GitOps rollouts, rather than satisfaction surveys, to finally settle the causation question.
If your team is still running manual kubectl apply deploys in 2026, the gap between you and the 58% isn’t a tooling problem anymore. It’s a roadmap problem, and the roadmap starts with picking a reconciliation engine and a secrets strategy before you write a single manifest.
Want this kind of breakdown in your inbox before it hits the front page of Hacker News?Subscribe to The Neural Loop at neuralwired.com/newsletter.
Edge computing spending hit $265 billion in 2025. The hyperscalers everyone expects it to disrupt are the ones funding the buildout.
Your CTO just asked why the company needs a sovereign cloud strategy when you already pay AWS for three regions. Good question. The honest answer is that edge computing vs cloud computing was never a clean either-or decision, and 2026 is the year that stopped being theoretical. Gartner now expects 20% of enterprise cloud workloads to migrate from global to local infrastructure this year alone, and the number writing the checks isn’t a scrappy edge startup. It’s AWS.
That’s the part most coverage of this shift gets backward. The popular framing treats edge computing as decentralization happening to the cloud giants, eating their lunch one data center at a time. The numbers tell a different story: AWS, Microsoft, and Google are the largest investors in the very edge infrastructure that’s supposedly displacing them.
Pick an analyst firm, get a different number. IDC’s Worldwide Edge Spending Guide, the most frequently cited forecast in the industry, put global edge spending at $265 billion in 2025, on track to nearly double by 2029. Precedence Research pegs the 2025 figure at $554 billion, climbing to $710 billion in 2026. Mordor Intelligence lands closer to $658 billion for the same period.
That’s not a rounding error. That’s three credentialed research firms disagreeing by hundreds of billions of dollars on the size of a market that supposedly already exists. Alexandra Rotaru, Data and Analytics Manager and Worldwide Edge Spending Guide Product Lead at IDC, frames the underlying trend as enterprises and service providers moving toward distributed systems built for real-time decisioning and automation at scale.
“Enterprises and service providers are shifting toward intelligent, distributed systems capable of real-time decisioning and automation at scale.”
Alexandra Rotaru, Data & Analytics Manager, IDC Worldwide Edge Spending Guide
The variance matters for a reason beyond pedantry: it signals a category that’s still being defined while vendors are simultaneously trying to sell it. When three analyst firms can’t agree within 3x on the size of a market, treat any single headline number with caution, including the ones in this article.
Sovereign Cloud Is the Real Growth Story
The sharper, more verifiable signal sits one layer down from “edge computing” as a buzzword: sovereign cloud. Gartner’s February 2026 forecast projects worldwide sovereign cloud IaaS spending will hit $80 billion this year, up 35.6% from 2025. China leads at $47 billion, followed by North America at $16 billion.
Gartner’s Rene Buest, Senior Director Analyst, ties the spending directly to geopolitics rather than pure latency or technical advantage. That’s a meaningfully different driver than the “speed and proximity” story that usually anchors edge computing pitches.
“As geopolitical tensions rise, organizations outside the U.S. and China are investing more in sovereign cloud IaaS to gain digital and technological independence. The goal is to keep wealth generation within their own borders.”
Rene Buest, Senior Director Analyst, Gartner
Twenty percent of existing cloud workloads are forecast to shift from global to local providers in 2026, a phenomenon Gartner calls “geopatriation.” If your procurement team hasn’t run a hybrid sourcing review yet, this is the number that should put it on the calendar, not someday, this fiscal year.
Why this connects to compliance: Sovereign cloud demand is rising in lockstep with regulatory pressure, including the EU AI Act’s August 2026 enforcement deadline and ongoing GDPR enforcement against companies like TikTok and Clearview AI. Data residency isn’t an edge computing nice-to-have anymore. It’s a compliance requirement with a budget line attached.
Why AWS, Azure, and Google Are Absorbing the Edge
Here’s where the “cloud giants are losing ground” narrative falls apart under its own numbers. Gartner’s broader IT spending forecast, released a week before the sovereign cloud numbers, shows global data center spending surpassing $650 billion in 2026, up 31.7% year over year, driven largely by hyperscaler AI server demand.
John-David Lovelock, Distinguished VP Analyst at Gartner, doesn’t describe a retreat. He describes acceleration.
“AI infrastructure growth remains rapid despite concerns about an AI bubble. Demand from hyperscale cloud providers continues to drive investment in servers.”
John-David Lovelock, Distinguished VP Analyst, Gartner
AWS isn’t watching sovereign demand from the sidelines either. The company went live with the AWS European Sovereign Cloud in Germany in January 2026, backed by a committed €7.8 billion investment through 2040, with new sovereign Local Zones planned for Belgium, the Netherlands, and Portugal. Add a $5.3 billion Saudi Arabia region and a $4 billion-plus Chile region, and the pattern is unmistakable: AWS isn’t ceding the edge. It’s productizing it.
Every major hyperscaler now runs its own edge product line instead of leaving the category to independent challengers:
Provider
Edge Products
Footprint (2025)
AWS
Local Zones, Wavelength, Outposts, European Sovereign Cloud
38 regions, 100+ Availability Zones, 27 countries
Microsoft Azure
Edge Zones, Azure Arc
70+ regions, 400+ data centers
Google Cloud
Distributed Cloud Edge
42 regions, 127 Availability Zones
The more accurate framing, then, isn’t decentralization beating the cloud giants. It’s consolidation of edge infrastructure under hyperscaler control, with telcos and colocation specialists like Equinix, HPE, and Cisco playing a real but secondary role.
The Adoption Gap Nobody Talks About
Spending forecasts are easy to publish. Enterprise readiness is harder to fake, and it’s lagging badly. A 2025 ITPro Today survey found that 55% of IT professionals describe themselves as only “somewhat familiar” with edge computing. That’s not a market in the middle of a takeover. That’s a market still explaining itself to the people who’d need to deploy it.
Real-world failure modes back this up. Edge projects tend to stall on governance, not technology. A widely cited 2025 case involved a regional hospital’s telehealth edge deployment getting blocked outright by HIPAA non-compliance, not by latency, bandwidth, or hardware limits. If you’re building an edge business case for leadership, lead with compliance readiness, not throughput benchmarks.
The Case Against the Decentralization Narrative
Not everyone buys the growth story at face value, and the skepticism is worth taking seriously. Strategy consultancy Arthur D. Little published an analysis titled “Edge Computing: Hype or Ripe?” arguing that edge realistically caps out around 10% of the total cloud computing market. Their reasoning: there simply isn’t enough economic space to significantly overbuild a parallel infrastructure layer next to hyperscaler clouds that are themselves expanding at record pace.
Our read: both things can be true at once. Edge spending can grow rapidly in absolute dollars while remaining a minority share of total cloud-equivalent spend. $265 billion sounds enormous until you set it against $650 billion in 2026 data center spending alone. The headline growth rate and the actual market share tell two different stories, and most coverage only reports the first one.
What This Means for Your Infrastructure Roadmap
If you’re the one signing off on infrastructure spend this year, three things should actually change in how you plan:
Budget for hybrid sourcing reviews now. Gartner’s 20% workload migration forecast isn’t a someday number. Treat it as a 2026 line item, not a future-state aspiration.
Plan for multi-vendor sprawl as the default, not the exception. AWS Local Zones, Azure Edge Zones, regional sovereign clouds, and on-prem deployments running simultaneously raise real operational complexity and security surface area. Map this before you commit, not after an incident forces the conversation.
Get ahead of data sovereignty requirements, don’t react to them. With EU AI Act enforcement landing in August 2026 and GDPR fines already a recurring headline, sovereignty readiness is a procurement advantage, not just a legal checkbox.
FAQ
Is edge computing replacing cloud computing?
No. Most analyses, including Arthur D. Little’s strategy research, suggest edge computing complements rather than replaces cloud, likely capping near 10% of total cloud-equivalent spend even as it grows rapidly in absolute dollar terms.
How big is the edge computing market in 2026?
Estimates vary sharply by analyst firm, from roughly $258 billion to over $700 billion. IDC’s widely cited figure puts 2025 spending at $265 billion, nearly doubling by 2029.
What is driving edge computing growth in 2026?
AI inference at the edge, 5G rollout, IoT device proliferation, and data sovereignty pressure are the core drivers. Gartner projects 20% of cloud workloads shifting to local providers in 2026 alone.
Do AWS, Azure, and Google Cloud offer edge computing?
Yes. AWS runs Local Zones, Wavelength, and Outposts. Azure offers Edge Zones and Arc. Google Cloud operates Distributed Cloud Edge. All three are extending hyperscaler control to the edge rather than ceding ground to independent providers.
Where This Goes Next
The edge computing vs cloud computing debate isn’t a battle with a winner. It’s a consolidation story, and AWS, Azure, and Google are writing most of it themselves. Watch three things over the next 6 to 18 months: how fast Gartner’s 20% geopatriation forecast actually materializes, whether AWS’s European Sovereign Cloud expansion into Belgium, the Netherlands, and Portugal stays on schedule, and whether EU AI Act enforcement in August 2026 pushes sovereign cloud spending past Gartner’s $80 billion projection.
None of that happens quietly, and none of it happens without a budget conversation your infrastructure team is already overdue for.
Want infrastructure shifts like this flagged before they hit your roadmap?Subscribe to The Neural Loop for weekly enterprise tech analysis, straight from NeuralWired.