NeuralWired’s Technology section covers the developments reshaping how the world builds, deploys, and regulates digital innovation. We report daily on the stories driving global conversation in artificial intelligence, big technology companies, startups and venture funding, cybersecurity, consumer gadgets and devices, and blockchain and cryptocurrency.
Our technology coverage goes beyond product announcements. When a major AI model launches, we explain what it can actually do and where its claims are overstated. When a startup raises a large funding round, we look at whether the business behind it can sustain that valuation. When a cybersecurity breach hits the news, we explain who is affected and what comes next, not just what happened. Each article is built from original research into primary sources, including company statements, technical documentation, regulatory filings, and verified data, and is written by our editorial team rather than generated automatically.
Readers come to this section for daily updates on the technology stories that matter globally, from shifts inside major technology companies to emerging tools changing how people work, communicate, and build. Whether you are a founder, an investor, an engineer, or simply someone trying to understand where technology is heading next, NeuralWired’s Technology coverage is built to keep you informed without wasting your time on hype.
Data Mesh vs. Data Lakehouse: The 2026 Decision Framework
Enterprise Data Architecture
Data Mesh vs. Data Lakehouse: What Actually Wins in 2026
JPMorgan Chase built a data mesh. So did dozens of other Fortune 500 names chasing the same promise: kill the central data team bottleneck, let business domains own their own data. Two years later, the honest answer about whether that bet paid off is “it depends,” and the data behind that answer is more specific than most vendors want to admit.
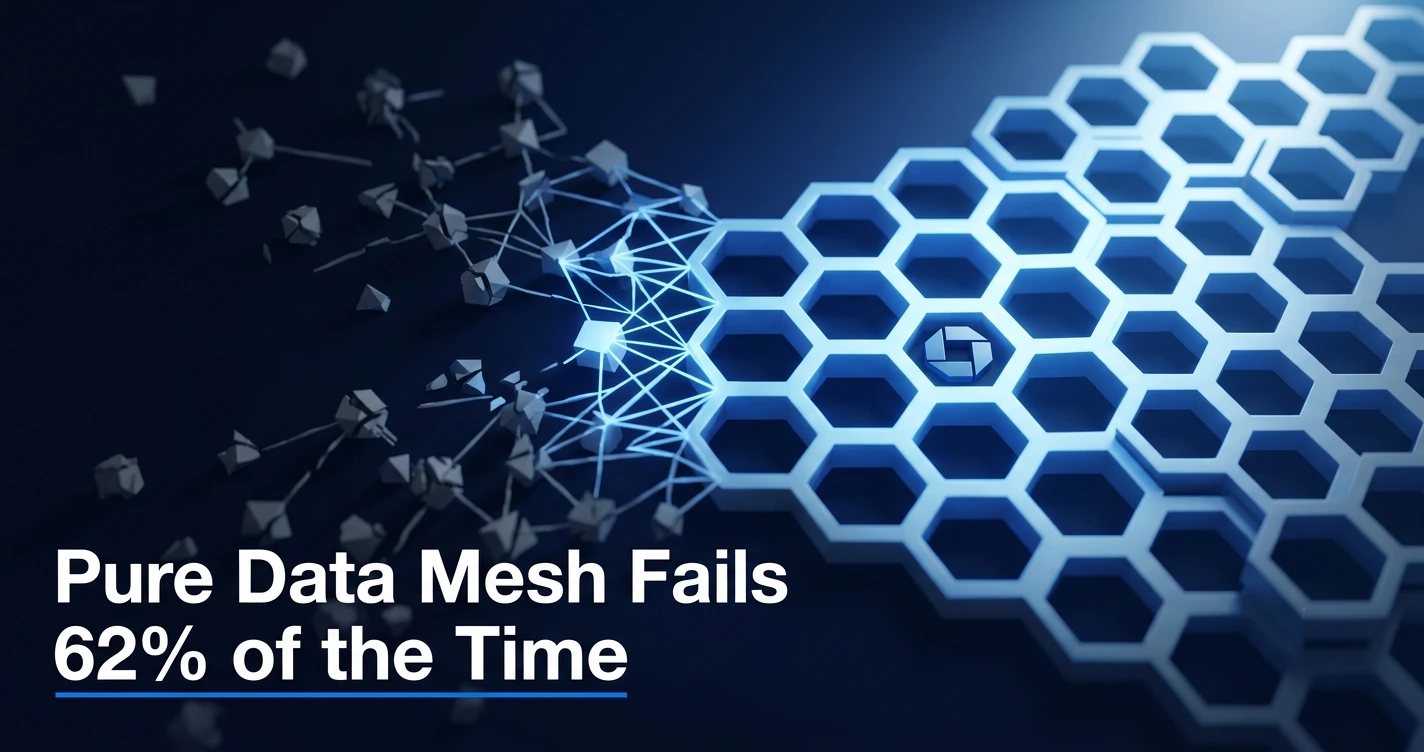
If you’re a CTO or Chief Data Officer staring down a 2026 or 2027 platform overhaul, the question isn’t really “data mesh vs. data lakehouse” anymore. McKinsey’s October 2025 survey found pure data mesh implementations succeed only 38% of the time within 24 months, the worst of three architectural approaches tracked. Pure lakehouse and fabric setups didn’t fare dramatically better. Hybrid models did, hitting a 52% success rate. This article breaks down why, with the numbers, the failures nobody puts in the keynote slides, and a framework for deciding what your organization actually needs.
These two terms get used interchangeably in vendor decks, which is exactly the problem. They’re not competing answers to the same question. They’re answers to two different questions entirely.
Data mesh was introduced in 2019 by Zhamak Dehghani, then director of emerging technologies at ThoughtWorks, as a direct response to a specific organizational failure: a single central data team becoming a bottleneck for an entire enterprise’s data pipelines. It’s built on four principles: domain-oriented ownership, treating data as a product, self-serve infrastructure, and federated computational governance. Notice none of those four principles describe a storage technology. Data mesh is an organizational model wearing architecture clothing.
The data lakehouse, popularized by Databricks, is the opposite kind of thing entirely; a storage and processing platform. IBM defines it as an architecture combining the flexibility and low cost of data lakes with the ACID transactions and schema management of data warehouses, using open table formats like Delta Lake, Apache Iceberg, and Apache Hudi to make that combination work.
The core distinction: a lakehouse answers “where does our data live and how do we query it reliably?” Data mesh answers “who owns this data and who’s accountable when it’s wrong?” You can run a lakehouse with zero domain ownership. You can also run a domain-ownership model on top of a traditional warehouse. They were never mutually exclusive, no matter how the conference circuit framed it.
The Numbers Nobody Puts on the Conference Slide
Here’s where the hype runs into the spreadsheet. The headline figure that should reframe how you think about this decision: only an estimated 18% of organizations have the governance maturity needed to successfully adopt data mesh, according to research cited by Atlan’s analysis of Gartner’s hype cycle placement. That’s not a technology gap. That’s a readiness gap, and it’s the single biggest predictor of whether a mesh initiative survives its second year.
The pattern holds across other research too. Organizations that planned a hybrid architecture from day one, rather than pivoting into one after 12 to 18 months of a failed pure-mesh attempt, achieved 25% faster time to value, 35% lower total cost of ownership, 40% better adoption rates, and 50% fewer governance conflicts, according to Gartner research from the 2025 Enterprise Data & Analytics Summit. Decide hybrid upfront. Don’t pivot into it after the first project stalls.
And the market is still chasing this category hard despite the failure rate: the data mesh market alone is projected to grow at roughly 18% CAGR through 2026, according to The Business Research Company’s 2026 market report. Money is flowing in even as the implementation track record stays rocky. That gap between capital and competence is worth sitting with for a second.
Why Data Mesh Implementations Fail (According to Its Own Creator’s Firm)
The most credible critique of data mesh doesn’t come from a rival vendor. It comes from ThoughtWorks itself, the firm where Dehghani coined the concept in 2019. Their January 2026 retrospective is unusually blunt for a company with a commercial stake in the methodology’s success.
“After numerous client projects and more than six years of on the ground observation, one thing is unequivocally clear: Data mesh is an organizational transformation, not merely a technical one. The greatest obstacles are changing organizational and individual behaviors, not technologies and architectures.”
ThoughtWorks Insights, “The State of Data Mesh in 2026: From Hype to Hard-Won Maturity,” January 16, 2026
ThoughtWorks goes further, naming the exact failure pattern they see repeatedly in client engagements: domain ownership that exists in name only.
“We often see the creation of ‘data domains’ that act as lip service to the principle… an IT department re-badges its old teams as ‘domains’ (e.g., the ‘SAP domain,’ the ‘Salesforce domain’) without any genuine business ownership. These constructs are lacking a clear mandate, business-aligned incentives or the authority to make decisions.”
ThoughtWorks Insights, January 2026 retrospective
Read that twice if you’re planning a mesh rollout. Renaming an IT team a “domain” changes nothing if that team still has no business mandate and no decision authority. It’s the data-architecture equivalent of putting a fresh coat of paint on a building with a cracked foundation. ThoughtWorks also acknowledges, candidly, that for every digital-native success story making the rounds at conferences, there’s “a quiet graveyard of stalled projects and failed implementations” that doesn’t get a stage slot.
There’s a survivorship bias problem baked into the entire public narrative around data mesh. Most published case studies come from organizations that were already platform-mature before they started. If your organization isn’t already running a sophisticated, well-staffed data engineering function, the mesh case studies you’re reading at 2am before a board presentation probably don’t describe a company that looks like yours.
The JPMorgan Case and What “Working” Looks Like
JPMorgan Chase launched a data mesh solution in October 2023, built specifically to support large-scale, distributed data ecosystems while keeping the governance, security, and regulatory controls a bank can’t compromise on. It’s one of the few named, large-scale enterprise deployments in financial services with public detail attached, and it didn’t try to go fully decentralized. Domain teams publish and manage data products, but through a unified platform with centralized guardrails baked in.
That’s the pattern playing out broadly across regulated industries. Financial services and healthcare, the two sectors with the heaviest compliance burden, are also the two leaning hardest into “hub and spoke” hybrid models: a central fabric core for governance, with mesh-style domain ownership layered on top for business velocity. Roughly 80% of financial services implementations and 70% of healthcare implementations now follow this pattern, because regulation demands central oversight at the same moment business units demand speed. You can’t have one without the other in those sectors, so the architecture had to evolve to fit both.
Our read: this signals something the conference circuit hasn’t fully caught up with yet. The interesting architecture decisions in 2026 aren’t “mesh or lakehouse.” They’re “how much central governance does our regulatory and risk profile actually require, and where can we safely hand decision authority to a domain team that’s earned it?”
The Decision Framework: Governance First, Architecture Second
If you’re building the RFP right now, here’s the order of operations the data actually supports.
1. Run a governance maturity audit before you pick a platform
With only an estimated 18% of organizations governance-ready for mesh, this is the step most teams skip and most regret skipping. Find out, honestly, whether your domains have the data engineering capability, the documentation discipline, and the business-side ownership to manage their own data products before you build infrastructure assuming they can.
2. Default to hybrid, not to either pure extreme
Between 60% and 70% of large enterprises were running hybrid models by 2025-2026 rather than committing to a pure approach in either direction. That’s not organizations hedging out of indecision. It’s the empirically dominant pattern because pure mesh has the lowest 24-month success rate of any model tracked, and pure lakehouse-only setups don’t solve the ownership and accountability problem that originally motivated mesh in the first place.
3. Decide hybrid upfront, don’t pivot into it after a failed pure attempt
This is where the 25-40% cost-efficiency premium comes from. Organizations that spent roughly 12 months assessing their situation before committing to a hybrid model outperformed teams that rushed into a pure architecture and pivoted later, on cost, adoption, and time-to-value. Rushing costs more than it saves.
4. Treat domain ownership as a real org-design project, not a renaming exercise
If your “domains” don’t have a budget, a mandate, and someone whose job depends on the data product’s quality, you’ve built ThoughtWorks’ anti-pattern, not a data mesh. Give the SMBs in your portfolio an honest exit ramp here too: if your central data team isn’t yet a proven bottleneck across multiple large business units, a well-implemented data warehouse will outperform a mesh on cost and complexity, full stop.
One additional pressure is now external rather than internal: the EU Data Act is pushing organizations toward sharing data with each other as governed products with clear contracts attached. Whether or not you adopt the data mesh label, the federated-governance thinking behind it is becoming a regulatory requirement in Europe regardless of your architecture preference.
Frequently Asked Questions
Is data mesh replacing the data lakehouse in 2026?
No. Data mesh is primarily an organizational and operating model, while a lakehouse is a storage and processing platform. Most enterprises in 2026 run a lakehouse as the core analytics platform with selective data mesh principles applied to high-maturity domains, rather than one replacing the other.
Why do most data mesh implementations fail?
The dominant failure mode is shallow domain ownership. IT departments re-badge existing teams as “domains” without granting genuine business mandate or decision authority, recreating the silos mesh was meant to eliminate, compounded by low governance maturity across most organizations attempting it.
Do most companies actually need data mesh?
No. Data mesh requires mature data engineering capability inside every domain plus significant organizational change. For most small and mid-sized businesses, a well-implemented data warehouse delivers more value with far less complexity. Mesh becomes worth the cost mainly once a centralized data team is a proven bottleneck.
What percentage of enterprises use a hybrid data architecture?
An estimated 60% to 70% of large enterprises were running hybrid models, combining lakehouse, fabric, and mesh elements, rather than a single pure architecture, by 2025-2026.
Where This Goes Next
The “mesh vs. lakehouse” framing that dominated 2022-2024 conference talks is already outdated. What replaced it: a hybrid-by-default consensus backed by real success-rate data, plus a hard recognition that governance maturity, not platform choice, is the variable actually deciding outcomes. Forrester’s 2025 analysis found 42% of enterprise architects now see mesh and fabric as a convergent, complementary evolution rather than a binary choice. That number will likely climb past 50% before 2027.
Three things worth watching over the next 6 to 18 months: whether the EU Data Act forces federated-governance adoption even at organizations that never wanted to touch data mesh; whether the governance-maturity gap (still 18% as of the most recent estimate) closes as vendors build more self-serve tooling; and whether more named enterprise case studies beyond JPMorgan publish honest failure data instead of polished success narratives.
If you’re choosing between data mesh and a data lakehouse architecture in 2026, you’re asking the wrong binary question. The right one is whether your organization has the governance maturity to support domain ownership at all, and if not, what a deliberately sequenced hybrid rollout looks like for your specific regulatory and organizational reality.
Kubernetes Enterprise Production 2026: 14 Problems Nobody Warned You AboutEnterprise Infrastructure · Deep Analysis
Kubernetes Won Enterprise Production. Now It’s Creating 14 New Problems.
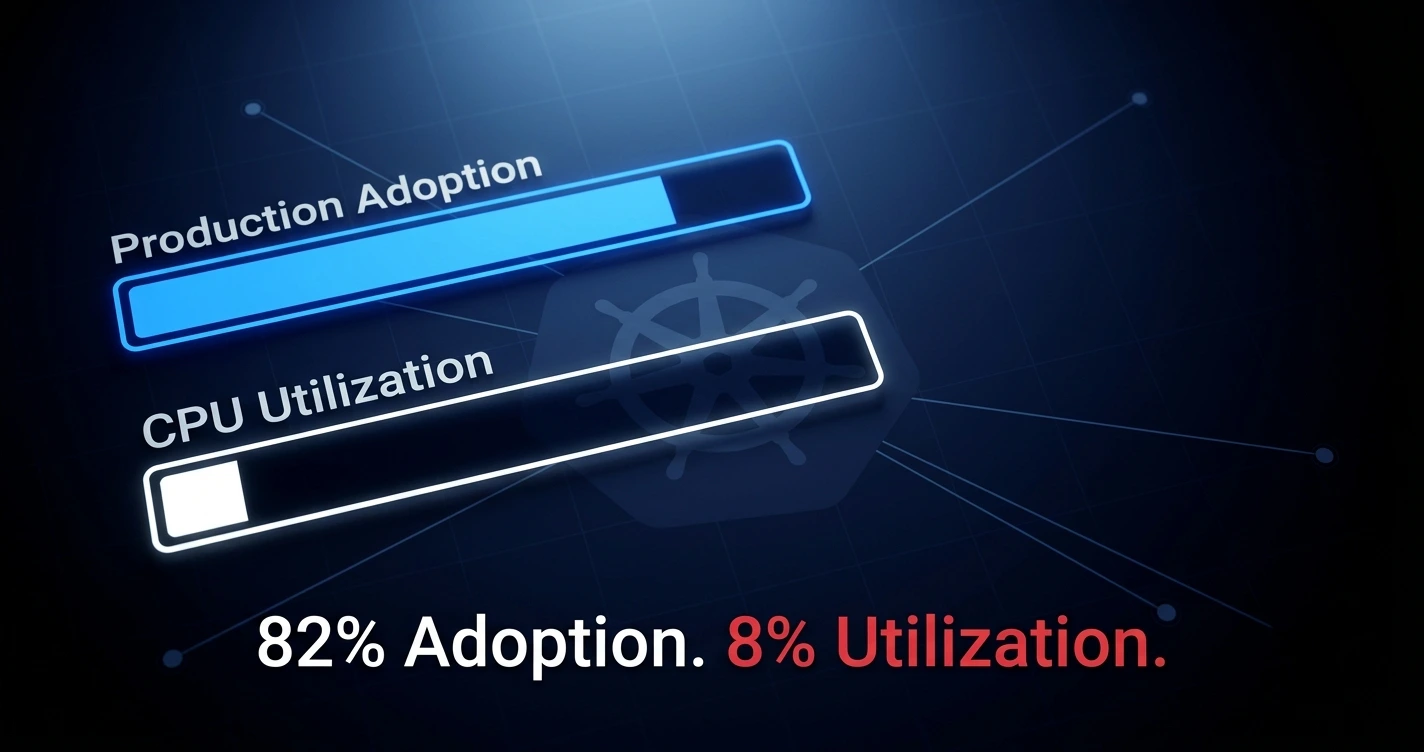
82% of container-running organizations now run Kubernetes in production. 88% of them report rising costs every year. Average CPU utilization sits at 8%. This is the honest state of Kubernetes enterprise production in 2026.
By NeuralWired StaffJune 29, 202615 min read
The Production Paradox
A cryptocurrency exchange gets breached in mid-2025. The attacker doesn’t use a zero-day. No exotic exploit chain. They deploy a malicious pod, steal a service account token, and pivot straight into cloud backend systems. The entire attack hinges on a Kubernetes misconfiguration that’s been documented as a critical risk since 2019. The exchange had been running Kubernetes for three years.
This is what Kubernetes enterprise production actually looks like in 2026. Not the CNCF keynote version. The version where the technology won and the operations didn’t.
According to the CNCF Annual Cloud Native Survey published January 20, 2026, 82% of organizations running containers now run Kubernetes in production. That’s up from 66% in 2023. By almost every measure, Kubernetes has won. It is the de facto operating system for modern enterprise infrastructure, the orchestration layer for 66% of all generative AI inference workloads, and the platform on which 77% of Fortune 100 companies run production systems.
And yet.
88% of enterprise Kubernetes teams report year-over-year TCO increases. Average CPU utilization across production clusters sits at 8%. More than half of enterprise clusters are still “snowflakes” with highly manual operations. Cost has overtaken skills and security as the single biggest Kubernetes challenge.
The container orchestration problem is solved. What replaced it is a cluster of operational, financial, and cultural problems that nobody included in the vendor pitch.
82%
of container users run Kubernetes in production (CNCF, Jan 2026)
average CPU utilization across production clusters (CAST AI, 2026)
5%
average GPU utilization despite premium cost (CAST AI, 2026)
All 14 Problems, Named and Quantified
These aren’t hypothetical edge cases. Every problem below is documented in primary research from Spectro Cloud’s 2025 State of Production Kubernetes (455 professionals across organizations with 250+ employees), the CNCF’s January 2026 survey, CAST AI’s 2026 optimization report, Palo Alto Networks Unit 42, and Sysdig. These are real production clusters, real enterprise teams, real money.
Problem 01
YAML Sprawl and Configuration Entropy
Teams managing hundreds of microservices accumulate thousands of YAML files with no enforced standardization between them. A new engineer joining a three-year-old cluster faces a configuration archaeology project before they can make a safe change. There’s no industry consensus on how to fix this at scale, and Helm charts layer additional complexity on top.
Problem 02
The Snowflake Cluster Problem
Over half of enterprise Kubernetes clusters are still what the industry calls “snowflakes”: clusters so customized through manual operations, one-off patches, and undocumented configuration decisions that no two are alike. Kubernetes promised repeatability. Most organizations haven’t delivered it. The institutional knowledge required to keep these clusters alive lives in the heads of two or three engineers.
Problem 03
Runaway Total Cost of Ownership
Cost has become the defining Kubernetes problem for 42% of organizations, overtaking skills shortage and security for the first time (Spectro Cloud / Adience, 2025). The promise was that containerization and efficient bin-packing would reduce infrastructure spend. What happened instead: platform engineering teams, observability tooling, security scanning, GitOps licenses, and training costs all landed on top of the compute bill, not instead of it.
Problem 04
CPU Overprovisioning at Industrial Scale
Average CPU utilization across production Kubernetes clusters is 8%. That number fell from 10% in 2024. CPU overprovisioning jumped from 40% to 69% in the same period. Organizations are not getting better at running Kubernetes efficiently as they gain experience. They are getting worse, largely because AI and GPU workloads entered clusters that weren’t built for them.
Problem 05
GPU Waste Is a Board-Level Problem Waiting to Happen
GPU nodes cost between 10 and 30 times more per compute unit than CPU. Average GPU utilization in Kubernetes clusters sits at 5%. For any organization running AI inference on Kubernetes, that is the kind of number that surfaces in a CFO conversation about AI ROI and triggers a forced architectural rethink. This is not a future problem. The spend is happening now.
Problem 06
Security Misconfiguration as the Primary Attack Vector
More than 60% of Kubernetes security incidents trace back to misconfigurations, not zero-days. RBAC settings, secrets stored in plaintext ConfigMaps, overprivileged service accounts, and absent network policies are the actual attack surface. The breach detailed in the opening of this article used none of the sophistication that “APT attack” implies. It used a service account token that had been granted more access than it needed.
Problem 07
Container-to-Cloud Attack Escalation
Palo Alto Networks Unit 42 published research in April 2026 documenting how threat actors pivot from a compromised container to full cloud backend access. The North Korean APT group Slow Pisces (also tracked as Lazarus) used exactly this playbook in a 2025 breach of a major cryptocurrency exchange. They didn’t need a kernel exploit. They needed a misconfigured service account.
Problem 08
Upgrade Lag and Version Drift
Kubernetes releases a new minor version every four months. Enterprise compliance cycles, business blackout windows, and the operational overhead of testing upgrades on snowflake clusters mean most organizations are persistently behind. Version drift creates documented security exposure and is on a collision course with emerging EU AI Act governance requirements and SOC 2 Type II controls that will treat undocumented patch lag as an audit finding.
Problem 09
Multi-Cluster Complexity Grows Non-Linearly
The average Kubernetes adopter runs clusters in more than five environments. The operational complexity of managing N clusters is not N times the complexity of one cluster. Every cluster multiplies the number of networking decisions, RBAC configurations, observability integrations, and upgrade cycles. At six-plus clusters, managing the cluster fleet becomes a full-time function that most organizations didn’t staff for when they started.
Problem 10
The Skills Shortage and Retention Crisis
36% of organizations cite lack of Kubernetes training as a significant barrier (CNCF 2025). Experienced Kubernetes engineers command premium compensation and are among the most actively recruited profiles in enterprise infrastructure. The institutional knowledge problem this creates is acute: a two-person team managing a six-cluster production environment represents a single resignation away from an operational crisis.
Problem 11
Cultural Resistance Now Outranks Technical Complexity
For the first time in the CNCF survey’s history, “cultural changes within the development team” (47%) overtook technical complexity as the top barrier to cloud native adoption in 2025. If you’re an engineering leader, this means the bottleneck for Kubernetes ROI in your organization is more likely an organizational change management problem than a technical one. Build the right internal platform and nobody uses it without this piece.
Problem 12
Observability Debt and MTTD Regression
Mean time to detect (MTTD) and mean time to resolve (MTTR) frequently increase after a Kubernetes migration, not decrease, especially in the first 18 months. Finance teams face an additional problem: Kubernetes cost allocation doesn’t map to traditional VM-style billing. Attributing cloud spend to business units or product lines in a shared cluster is a solved problem technically and an unsolved problem organizationally at most companies.
Problem 13
Stateful Workload Complexity
Kubernetes was built for stateless, ephemeral workloads. Databases, message queues, and persistent volumes require backup, disaster recovery, and data consistency guarantees that introduce significant operational complexity. Running stateful workloads in Kubernetes correctly requires Operators, CSI drivers, snapshot management, and replication strategies that most teams underestimate before committing.
Problem 14
AI Workload Infrastructure Drift
Most existing Kubernetes environments were not built for deterministic AI and GPU inference workloads. Mismatched kernels, manual patching cycles, and the accumulated customization of snowflake clusters create “snowflake debt” that compounds directly against the AI infrastructure roadmap. The New Stack and SideroLabs flagged this in February 2026 as the hidden cost of organizations that rush AI workloads into clusters that were never designed for them.
“I think some people hope that AI becomes this magic sauce you can rub on your YAML files and user experience pops out. It’s important that if you’re going to manage these systems, you need to know how they work.”
Kelsey Hightower, Former Distinguished Engineer, Google Cloud Platform, at KubeCon Europe 2026. Source: The New Stack, March 30, 2026
The 8% Utilization Scandal
Let’s sit with that number for a moment. Eight percent average CPU utilization. Across tens of thousands of real production Kubernetes clusters. Data collected by CAST AI from actual workloads running on EKS, GKE, and AKS in 2025.
That means 92% of the CPU capacity organizations are paying for is idle. Not reserved for burst capacity. Not in use. Idle.
And it’s getting worse. In 2024, average CPU utilization was 10%. Overprovisioning has jumped from 40% to 69% in two years. The direction is wrong. Organizations are becoming less efficient at running Kubernetes as the platform matures, not more. The proximate cause is AI workloads entering clusters that weren’t architected for GPU scheduling, combined with teams provisioning conservatively because the cost of getting it wrong (an outage) is higher than the cost of waste (a larger cloud bill).
For large deployments running 1,000 or more nodes, Sysdig estimates the wasted spend on CPU alone can exceed $10 million annually. That’s not a rounding error. That’s a CFO conversation.
Immediate action required: Run a utilization audit using CAST AI, Kubecost, or your cloud provider’s native cost tooling before your next budget cycle. With average CPU at 8%, the probability of finding immediate, material savings in your cluster is high. At $1M or more per year in likely waste for mid-size deployments, this is a conversation that belongs in the CFO’s calendar, not just the SRE team’s backlog.
The GPU problem is structurally worse. GPU nodes cost between 10 and 30 times more per compute unit than CPU. Average GPU utilization in Kubernetes clusters sits at 5%. Most organizations deployed GPU capacity to support AI inference workloads and then discovered that Kubernetes, without specialized scheduling and bin-packing tools, defaults to the same overprovisioning behavior that makes CPU utilization so bad. The result is the most expensive infrastructure in the enterprise sitting 95% idle.
The Security Reality Nobody Talks About
There’s a comfortable assumption in enterprise Kubernetes security: “We’re on EKS/GKE/AKS, so the managed service handles security for us.” This assumption is factually wrong, and it’s the precondition for exactly the kind of attack that cost a crypto exchange its cloud backend in 2025.
Managed Kubernetes services handle control plane security. They patch etcd, harden the API server, and manage the underlying node OS. They do nothing to secure your workloads. RBAC configuration, secrets management, network policies, pod security contexts, and service account permissions are entirely your responsibility. And according to Palo Alto Networks Unit 42’s April 2026 research, more than 60% of Kubernetes security incidents trace back to misconfiguration in exactly these areas.
The Slow Pisces/Lazarus breach is instructive not because it was sophisticated, but because it wasn’t. The threat actors deployed a malicious pod, harvested a service account token that had been granted excessive privileges (a Day 1 Kubernetes security anti-pattern), and used that token to authenticate to cloud backend APIs. The cloud provider’s security controls did exactly what they were supposed to do: they checked the token, found it valid, and granted access.
45% of production container images contained high-severity vulnerabilities in 2025. Most of those images were scanned at build time and passed. The vulnerabilities were introduced by base image updates, dependency drift, and the lag between vulnerability disclosure and image rebuild cycles that exists in most enterprise pipelines. Kubernetes didn’t create this problem, but its ephemeral container model makes it harder to maintain a consistent remediation cadence.
If you haven’t completed a Kubernetes security audit in the last 12 months, your RBAC configurations, service account permissions, and network policies are operating on assumptions that may no longer be valid. This is a real, unquantified breach exposure. The CVE-2025-55182 (React2Shell) vulnerability was being actively exploited in Kubernetes environments within 48 hours of disclosure in December 2025. Organizations that discovered it via their own monitoring had a very different outcome than those that read about it in a vendor email.
“Enterprises are aligning around Kubernetes because it has proven to be the most effective and reliable platform for deploying modern, production-grade systems at scale. This year’s data shows that the next phase of cloud native evolution will be as much about people and platforms as it is about the tech itself.”
Hilary Carter, SVP of Research, Linux Foundation Research. Source: PR Newswire, January 20, 2026
The PaaS-First Counter-Argument Has Economic Teeth
Not everyone is persuaded that Kubernetes is the right answer for most organizations in 2026. A growing practitioner movement is making a specific, economic argument that deserves serious engagement: the default to Kubernetes for new projects is a strategic error for teams that aren’t at Top-100-website scale.
The break-even analysis works like this. Managing a production Kubernetes environment safely requires (at minimum) a dedicated platform engineering function. Three senior SREs at approximately $250,000 loaded cost each equals $750,000 per year in labor. If you’re hosting $60,000 per year in compute on that cluster, you’re paying a 12x cost premium on your infrastructure bill to avoid using a managed platform service. At $20,000 per month in compute, the economics still don’t work. The self-management savings don’t offset the team cost until you’re north of $2.5 million in annual compute spend.
This argument is made explicitly by engineering practitioners at sanj.dev and byteiota.com (both published in 2026) who frame the current moment as an inflection point where the risk has flipped. Platforms like AWS App Runner, Railway, Render, and Fly.io, plus specialized AI inference platforms like Modal and BentoCloud, are capturing workloads that don’t require the full Kubernetes operational overhead. These aren’t toy platforms anymore.
This is not a fringe view. It’s tacitly acknowledged in Kelsey Hightower’s own warnings about scale, reinforced by the FinOps Foundation’s waste data, and supported by the CNCF’s own finding that 47% of organizations cite cultural resistance as the top barrier. If the main thing preventing Kubernetes from delivering ROI is organizational change management, not technical complexity, the PaaS argument becomes: why impose this organizational tax?
Our read: the PaaS-first argument is correct for a specific segment of organizations and will accelerate in the next 18 months as GPU cost pressure makes the utilization numbers impossible to ignore. It does not invalidate Kubernetes for large-scale enterprise environments. It does invalidate the default assumption that Kubernetes is the right starting point for any organization running containers.
What the Winning Teams Actually Do
There’s a meaningful performance gap in the CNCF data between organizations it classifies as “innovators” and “adopters.” The gap isn’t about which Kubernetes version they run or which managed service they use. It’s about two practices that separate operationally mature teams from everyone else.
GitOps as Non-Negotiable Infrastructure
58% of cloud native innovators use GitOps extensively. 23% of adopters do. GitOps isn’t just a deployment pattern. It’s the audit trail, the rollback mechanism, and the institutional knowledge system that makes it possible for any engineer on the team to understand the desired state of the cluster at any given time. Without it, as Hightower noted at KubeCon 2026, you’re automating alerts with no audit trail and no rollback. The self-healing infrastructure that AIOps platforms promise for 2026 depends on GitOps as its foundation. You cannot self-heal a cluster whose desired state lives in someone’s head.
Platform Engineering as a Function, Not a Project
The organizations whose DevOps metrics beat every benchmark are those that centralized application deployment in a dedicated platform engineering function with an internal developer platform (IDP). The Backstage project, now the fifth-most-active CNCF project by velocity, is the open-source IDP foundation that leading teams build on. The IDP abstracts Kubernetes complexity away from application developers. It gives them a self-service interface for deployments, environment management, and observability without requiring them to understand pod scheduling or CNI networking.
If you don’t have this function, you’re in the majority. Over half of enterprise clusters are still snowflakes. Being in the majority is not the same as being on the right side of the performance gap.
The Upgrade Cadence Discipline
Winning teams treat Kubernetes upgrades as a routine, automated operational function rather than a high-stakes manual project. This requires investment in cluster automation, canary upgrade testing, and GitOps-driven rollback capability. The organizations that do this aren’t upgrading because they love changelog reading. They’re upgrading because they recognize that every minor version behind the current release represents documented, quantifiable security exposure that will eventually show up on a compliance audit or an incident report.
“Five years in, Kubernetes is no longer an experiment. It’s mission-critical infrastructure. The companies that master scale and complexity fastest will create an unbeatable platform for innovation.”
Tenry Fu, Co-founder and CEO, Spectro Cloud. Source: BusinessWire, August 4, 2025
Metric
Kubernetes “Innovators”
Kubernetes “Adopters”
GitOps usage (extensive)
58%
23%
Internal Developer Platform
Majority deployed
Minority deployed
Snowflake clusters
Minority
Majority (>50%)
Security audit frequency
Continuous / quarterly
Ad hoc / annual
Upgrade cadence
Automated / regular
Manual / deferred
FAQ: Kubernetes Enterprise Production 2026
What are the biggest challenges of running Kubernetes in production in 2026?
The biggest challenges are rising TCO (88% of enterprises report year-over-year cost increases), security misconfigurations (responsible for over 60% of incidents), snowflake cluster proliferation, skills shortages, and GPU and CPU resource waste. Average CPU utilization sits at just 8% across production clusters. Source: Spectro Cloud 2025 State of Production Kubernetes, CNCF January 2026 survey.
Is Kubernetes worth it for enterprise in 2026?
Kubernetes delivers ROI for enterprises spending at least $2.5 million annually on raw compute, with dedicated platform engineering teams and GitOps workflows in place. For organizations below that compute threshold, the operational overhead of three senior SREs at $750,000 loaded cost per year frequently exceeds savings. 77% of Fortune 100 companies run it in production, but the economics differ materially at mid-market scale.
How much does Kubernetes waste in cloud resources?
Significantly. The average Kubernetes cluster operates at only 8% CPU utilization and 20% memory utilization. CPU overprovisioning stands at 69% in 2026. GPU utilization averages 5% despite a 10 to 30 times cost premium per compute unit. For large deployments with 1,000 or more nodes, wasted CPU spend alone can exceed $10 million annually. Source: CAST AI 2026 State of Kubernetes Optimization Report.
What percentage of companies use Kubernetes in production in 2026?
82% of organizations running containers use Kubernetes in production, per the CNCF Annual Cloud Native Survey published January 20, 2026. This is up from 66% in 2023. An additional 13% are in active pilot or evaluation phases. 79% of those production users run managed services (EKS, GKE, AKS) rather than self-managed clusters.
What are the most common Kubernetes security risks in production?
RBAC misconfigurations, overprivileged service accounts, secrets stored in plaintext ConfigMaps, exposed API servers, and missing network policies are the primary risks. Over 60% of Kubernetes security incidents trace to misconfigurations rather than zero-day vulnerabilities. In 2025, a North Korean APT group used an overprivileged service account token to breach a major cryptocurrency exchange. Source: Palo Alto Networks Unit 42, April 2026.
What is the Kubernetes TCO problem?
Kubernetes total cost of ownership extends well beyond compute to include platform engineering labor, observability tooling, security scanning, FinOps tooling licenses, upgrade cycles, and ongoing training. 88% of enterprise teams report year-over-year TCO increases, and cost has overtaken skills and security as the primary Kubernetes challenge for 42% of organizations. Source: Spectro Cloud State of Production Kubernetes 2025.
What is replacing Kubernetes in 2026?
Nothing replaces Kubernetes at large enterprise scale, but a PaaS-first movement is gaining traction for teams spending under approximately $2.5 million annually on compute. AWS App Runner, Railway, Render, Fly.io, Modal, and BentoCloud are capturing workloads that don’t require full Kubernetes operational overhead. Kubernetes remains the standard for large-scale, multi-service enterprise environments running complex or AI-heavy workloads.
Why do so many Kubernetes clusters have low utilization?
The core reason is conservative overprovisioning. Engineers provision excess CPU and memory because the cost of under-provisioning (an outage or performance degradation) is immediately visible, while the cost of overprovisioning (waste) lands on a cloud bill that finance teams often can’t attribute at the service level. AI and GPU workloads entering clusters not designed for them have accelerated this trend significantly since 2024.
Where This Goes in the Next 12 Months
Kubernetes enterprise production in 2026 sits at a specific kind of inflection point. The technology is mature. The adoption curve is approaching saturation. What hasn’t matured is the operational discipline required to extract value from it at scale.
Three forces will define the next 12 months.
GPU waste will trigger executive intervention. With AI infrastructure ROI now a board-level conversation and average GPU utilization at 5%, CFOs who find out how much compute their AI workloads are burning will force architectural decisions that many engineering teams are not yet prepared for. Organizations that have already implemented Kubernetes GPU scheduling optimization (using tools like the NVIDIA GPU Operator with proper bin-packing policies) will have a defensible answer. Those that haven’t will be having a different kind of conversation.
A high-profile Kubernetes breach will change the security conversation. The 2025 Lazarus attack hit a crypto exchange. The next high-profile RBAC misconfiguration breach will likely involve a publicly traded company. When it does, audit committees and boards will ask questions that most CISO teams aren’t currently prepared to answer about Kubernetes security posture. Organizations that have completed a comprehensive RBAC and container security audit will be in a substantially different position than those operating on inherited configurations.
Platform engineering will separate enterprise performance tiers. The data already shows this. Organizations with internal developer platforms and extensive GitOps adoption are definitively in a different performance category from those still managing snowflake clusters manually. This gap will widen as AI workloads require more deterministic, well-configured infrastructure to deliver consistent inference performance.
Three things to act on now. First, run a CPU and GPU utilization audit. With average utilization at 8% and 5% respectively, the probability of immediate, material savings is high. Second, conduct a Kubernetes RBAC review. If you can’t tell in 30 minutes which service accounts have cluster-admin privileges and why, you have an unquantified breach exposure. Third, evaluate whether your organization actually meets the compute threshold ($2.5M annually) where self-managed Kubernetes makes financial sense. If it doesn’t, the PaaS-first argument deserves serious consideration before your next infrastructure commitment.
Kubernetes won. What it created in winning is a set of operational, financial, and security problems that are now more consequential than the container orchestration problem it solved. The organizations that close that gap in the next 12 months will have a structural platform advantage that compounds. The ones that don’t will spend the next 18 months explaining cost overruns and missed AI deployment timelines to people who stopped caring about the technical reasons.
Stay ahead of enterprise infrastructure shifts
The Neural Loop is NeuralWired’s weekly briefing on the technology decisions that matter most to engineering leaders. No noise. No vendor PR. Just the analysis your team needs.
Subscribe to The Neural Loop
IBM’s Quantum Roadmap Gives Enterprises a 4-Year Window to Act on Post-Quantum Migration
By NeuralWired Editorial | June 29, 2026 | 12 min read
Your organization’s most sensitive encrypted data, customer records, financial transactions, intellectual property, could already be sitting in an adversary’s archive. It was captured yesterday. It will be decrypted in 2029, or 2031, or 2033. The exact date is uncertain. What is not uncertain is that the migration away from today’s encryption standards takes 42 to 54 months once an organization actually starts. And fewer than 5% of enterprises have started.
IBM’s quantum computing roadmap, Google’s dramatic security warning published March 25, 2026, and a new research paper that cut prior qubit estimates by a factor of 20 have together shifted this conversation from theoretical risk management to operational urgency. This article breaks down exactly what has changed, what the NIST post-quantum cryptography standards require, and what a CISO or CTO at an enterprise organization needs to do before the end of 2026.
The Real Threat Is Not the Qubit Count
When IBM announced Condor, its 1,121-superconducting-qubit processor, in December 2023, it made headlines. The 1,000-qubit barrier was crossed. But fixating on that number misses the actual story of 2026, which is about timelines, compliance clocks, and a harvest-now-decrypt-later threat that is already happening.
Qubit counts alone do not break encryption. What matters is logical qubits, fault-tolerant gates, and error correction at scale. IBM’s own engineers recognize this: after Condor, the company shifted its focus from raw qubit counts toward error resistance. State-of-the-art error correction currently requires roughly 1,000 physical qubits per logical qubit, which explains why the cryptographically relevant threshold is still years away from Condor’s 1,121 physical qubits.
Key Distinction
A 1,000-qubit quantum computer does not break RSA-2048 today. Breaking RSA-2048 likely requires around one million physical qubits running for approximately a week, based on Google’s latest research estimates. The urgency is about migration timelines, not imminent decryption.
The actual story of 2026 is that organizations which have not started post-quantum cryptography migration will mathematically fail to meet regulatory deadlines. That is the operational reality driving this article.
What IBM’s Quantum Roadmap Actually Says
IBM has published a detailed hardware roadmap that provides the clearest public signal of where quantum capability is heading and on what schedule.
Year
IBM Milestone
Key Capability
2023
Condor (1,121 qubits)
First processor crossing 1,000 physical qubits
2026
Kookaburra (1,386 qubits, multi-chip)
Three chips linked via IBM Quantum System Two, yielding a 4,158-qubit combined system
2028-2029
IBM Quantum Starling
Fault-tolerant system with roughly 200 logical qubits from approximately 10,000 physical qubits; 100 million gate operations
2029
Near-term quantum advantage tools
IBM targets delivery of tools for near-term quantum advantage by end of 2026, first large-scale fault-tolerant machine by 2029
The Kookaburra milestone in 2026 is significant not for its qubit count alone but for the multi-chip architecture. Linking processors is how IBM intends to scale toward the hundreds of logical qubits needed for cryptographically relevant computation. Every step on this roadmap narrows the gap between current machines and the systems that security teams are building their migration timelines around.
Our read IBM’s pivot from qubit maximalism to error-correction depth signals something important: the people closest to the hardware believe the engineering path to fault tolerance is now a matter of execution, not discovery. That is a different kind of confidence than the field had three years ago.
Google’s 2029 Alarm and What It Means for You
On March 25, 2026, Google’s security leadership published a formal announcement setting 2029 as the company’s internal deadline to secure its systems against quantum threats using post-quantum cryptography. The post was authored by Heather Adkins, VP of Security Engineering, and Sophie Schmieg, Senior Staff Cryptography Engineer. This is a full year ahead of NIST’s 2030 deprecation date and six years ahead of the 2035 final federal deadline under NSM-10.
Five days later, on March 30, 2026, Google Quantum AI released a 57-page paper with researchers from the Ethereum Foundation and Stanford University. The finding that drew immediate industry reaction: breaking 256-bit elliptic curve cryptography, the algorithm protecting Bitcoin and Ethereum, would require fewer than 500,000 physical qubits. That is nearly a 20-fold reduction from prior best estimates.
“It’s a real shock. We’ll need to speed up our efforts considerably.”
Bas Westerbaan, Applied Cryptography Lead, Cloudflare — TIME magazine, April 2026
Cloudflare accelerated its own post-quantum deadline to 2029 within days of the paper’s release. Westerbaan’s reaction is worth sitting with. Cloudflare processes a significant share of global internet traffic. When its cryptography lead describes a research paper as “a real shock,” that is not public relations language. That is a practitioner recalibrating a production timeline based on new data.
Google also announced that Android 17 is integrating post-quantum cryptography digital signature protection using ML-DSA, building on existing Chrome support. Our read this signals that PQC is no longer a future feature on Google’s roadmap. It is shipping code.
The Compliance Deadline Ladder: 2027 to 2035
The regulatory framework for post-quantum cryptography migration in the United States is built on NSM-10, the NSA’s CNSA 2.0 suite, and Executive Order 14144. Enterprises serving federal clients, contractors, and financial institutions with ties to regulated sectors need to treat this schedule as binding, not aspirational.
Deadline
Requirement
Who It Affects
Jan 1, 2027
All new National Security System acquisitions must support CNSA 2.0
Government contractors, defense suppliers, NSS vendors
Dec 31, 2030
Equipment unable to support CNSA 2.0 must be phased out; NIST deprecates RSA/ECC
All federal agencies, regulated critical infrastructure
Dec 31, 2031
CNSA 2.0 becomes mandatory across all National Security Systems (except exemptions)
NSS operators, contractors
2033
OS, cloud services, and custom applications must reach exclusive CNSA 2.0 use
Full quantum resistance required across all National Security Systems per NSM-10
Entire US national security supply chain
The January 2027 deadline for new NSS acquisitions is the one that commercial enterprises should pay attention to first, even if they are not themselves defense contractors. When government procurement requirements shift, vendor product roadmaps shift with them. Any software company, hardware manufacturer, or cloud provider that wants to remain in the government supply chain will need CNSA 2.0 support in new products by January 2027. That cascades into commercial product decisions within 12 to 18 months of announcement.
Procurement Action
CTOs should begin requiring CNSA 2.0 and post-quantum cryptography readiness clauses in vendor contracts now. The January 2027 government deadline will reshape commercial vendor roadmaps whether or not your organization is regulated. Get ahead of it in your next contract renewal cycle.
The Enterprise Readiness Gap Is Alarming
The data on enterprise preparedness is consistently grim across every survey and research source published in the past 12 months. The gap between awareness and action is wide enough to be a material risk that boards and audit committees should be asking about.
<5%
of enterprises have a formal quantum-transition plan (arXiv, September 2025)
69%
believe quantum will break current encryption within 5 years (DigiCert/Propeller Insights survey, 1,042 senior security managers)
41%
of organizations do not plan to address quantum computing at this time (ISACA 2025)
The DigiCert survey finding is particularly striking. Sixty-nine percent of senior cybersecurity managers believe quantum computers will break current encryption within five years. Only 19.2% describe themselves as “extremely prepared.” The gap between what people believe is coming and what they are doing about it is not a knowledge problem. It is an organizational inertia problem.
Scott Aaronson, Schlumberger Centennial Chair of Computer Science at the University of Texas at Austin and a newly elected member of the US National Academy of Sciences, offered the sharpest framing of this inertia in a PYMNTS interview in February 2026:
“The time to start thinking about migrating to quantum-resistant methods of encryption is now. Even optimistic estimates place practical quantum attacks five to ten years out, but the migration itself, not the threat, is the actual bottleneck for large institutions.”
Scott Aaronson, Schlumberger Centennial Chair of Computer Science, University of Texas at Austin — PYMNTS, February 20, 2026
Aaronson matters here for a specific reason. He has spent more than a decade as quantum computing’s most prominent skeptic, the researcher other researchers cite when they want to explain why hype outruns reality in this field. His May 1, 2026 blog post, titled “Will You Heed My Warnings?”, noted that some of the most reputable people in quantum hardware and error correction now believe a fault-tolerant, cryptographically relevant quantum computer “ought to be possible by around 2029.” His words, not a breathless press release.
Banking and telecom lead enterprise sectors in preparedness, with 45 to 47% of respondents in those sectors having budgeted and planned for near-term post-quantum cryptography transition. Every other sector is significantly behind.
The CTO Action Plan: What to Do in the Next 90 Days
The migration timeline math is straightforward and unforgiving. Enterprise PQC migrations realistically take 42 to 54 months from the moment an organization is properly resourced and underway. An organization that has not started a cryptographic inventory by the end of 2026 will struggle to hit NIST’s 2030 deprecation date. An organization that has not started by mid-2026 has already put Google’s 2029 internal deadline out of reach.
Step One: Cryptographic Asset Inventory
Every major guidance document from NIST, Capgemini, and Fortinet identifies this as the step that enterprises consistently skip or underestimate. You cannot migrate what you have not mapped. This means cataloguing every certificate, SSH key, code-signing key, embedded cryptographic algorithm in firmware and IoT devices, and any third-party library that handles encryption. For most large enterprises, this inventory alone takes three to six months.
This is the present-tense risk that gets underweighted because its consequences are future-tense. Nation-state adversaries are capturing encrypted traffic now and storing it for future decryption. Any data with a confidentiality shelf-life beyond approximately seven to eight years is already exposed if it is encrypted with RSA or ECC today. That includes healthcare records, defense contracts, M&A negotiations, and anything classified at the top end of most organizations’ data hierarchies. Prioritize migration of those data classes first.
Step Three: Pilot NIST-Standardized Algorithms Now
NIST finalized its first three post-quantum cryptography standards in August 2024: FIPS 203, FIPS 204, and FIPS 205. These are not draft standards. They are ready for implementation. IBM’s z16 mainframe already includes hardware acceleration for post-quantum algorithms. Microsoft has published a detailed migration roadmap targeting full PQC transition by 2033, with core infrastructure migration beginning in 2026. Use these as benchmarks and start pilot deployments in lower-risk environments this quarter.
Step Four: Update Procurement Requirements
Begin requiring CNSA 2.0 and PQC readiness clauses in vendor contracts on renewal. Build a vendor questionnaire that asks suppliers to disclose their own PQC migration plans, target dates, and which NIST-standardized algorithms their products will support and when. The January 2027 government procurement deadline will accelerate commercial vendor timelines regardless; getting this into your contracts now creates leverage and accountability.
Complete cryptographic asset inventory across all systems, firmware, and third-party libraries
Identify all data with confidentiality requirements beyond 7 years and prioritize for immediate migration planning
Pilot FIPS 203, 204, or 205 in at least one production-adjacent environment before Q4 2026
Add PQC readiness requirements to vendor contract renewals starting this quarter
Establish a crypto-agility architecture so algorithm replacement does not require full system rebuilds
Present quantum readiness status to the board or audit committee with a formal risk register entry
The Skeptic’s Case: Why 2029 Might Be Too Early
Any responsible analysis of this topic needs to include the genuine scientific minority view, and not as a dismissal of urgency but as a calibration of certainty.
Gil Kalai, a mathematician at Hebrew University of Jerusalem and one of quantum computing’s most technically rigorous skeptics, has published conjectures arguing that fundamental noise correlations in highly entangled quantum systems may make fault-tolerant quantum computing impossible, not merely difficult. His argument is not that the engineering is hard. It is that correlated errors in large quantum systems may violate assumptions that fault-tolerance proofs rely on. This is an unresolved scientific dispute, not a fringe view.
RAND Corporation’s institutional assessment places cryptanalytically relevant quantum computers in “at least the 2030s,” and RAND explicitly warns policymakers against messaging that suggests such computers could already secretly exist. A hostile actor running a cryptographically relevant quantum computer against unsuspecting victims undetected for years is, in RAND’s assessment, highly unlikely.
Even Craig Gidney, the Google researcher whose work contributed to the March 2026 ECC paper, has described the probability of a cryptographically relevant quantum computer by 2030 at roughly 10%, characterizing that level as “unacceptably high” rather than likely. Google’s 2029 internal deadline is a risk management decision at 10% probability, not a forecast that Q-Day happens in 2029.
Calibration Note
The correct framing is not “quantum computers will break encryption by 2029.” It is “the risk is high enough by 2029 that Google, Cloudflare, and Scott Aaronson now treat 2029 as the responsible deadline for completing migration, regardless of whether Q-Day arrives that early.” That is a different claim, and it supports the same action.
The practical upshot: whether Q-Day lands in 2029, 2032, or 2037, the migration timeline of 42 to 54 months means the decision about when to start is already overdue for most enterprises. The uncertainty about the threat date does not reduce urgency. It increases it, because organizations betting on the later end of the range are taking on risk they cannot adequately price.
FAQ: Post-Quantum Cryptography Migration
When will quantum computers break encryption?
Expert consensus places Q-Day, the point at which quantum computers can break RSA and ECC encryption, in the early-to-mid 2030s. However, Google and Scott Aaronson have identified 2029 as an accelerated risk window based on recent hardware progress and revised qubit estimates. This is not a prediction of Q-Day in 2029; it is a risk-management threshold that justifies completing migration before that year.
What is harvest now, decrypt later?
It is an adversarial strategy where encrypted data is intercepted and stored today with the intent to decrypt it once a sufficiently powerful quantum computer exists. Any organization whose data carries confidentiality requirements beyond seven to eight years should treat this as a current-tense risk, not a future one. Nation-state actors with long planning horizons are the primary concern.
What is CNSA 2.0 and when does it apply?
CNSA 2.0 is the NSA’s Commercial National Security Algorithm Suite, the successor to CNSA 1.0. It mandates quantum-resistant algorithms for federal national security systems. New NSS acquisitions must support CNSA 2.0 from January 1, 2027. CNSA 2.0 becomes mandatory across all National Security Systems by December 31, 2031, with full quantum resistance required by 2035 under NSM-10.
Which NIST post-quantum cryptography standards should enterprises implement?
NIST finalized three standards in August 2024: FIPS 203 (ML-KEM, for key encapsulation), FIPS 204 (ML-DSA, for digital signatures), and FIPS 205 (SLH-DSA, a stateless hash-based signature scheme). These are production-ready and should be piloted in enterprise environments now, with deployment priority given to systems handling long-shelf-life confidential data first.
How many enterprises have a quantum readiness plan?
Fewer than 5% of enterprises currently have a formal quantum-transition plan, according to a peer-reviewed arXiv survey published in September 2025. Separately, ISACA’s 2025 poll found that 41% of organizations do not plan to address quantum computing at this time, and 37% have not discussed it internally at all.
How long does post-quantum cryptography migration take for a large enterprise?
Realistically, 42 to 54 months from the moment an organization is properly resourced and underway. The cryptographic asset inventory phase alone typically takes three to six months. An organization that has not started by the end of 2026 faces serious risk of failing to meet the NIST 2030 deprecation deadline, even if it begins in January 2027.
What You Know Now That Most Organizations Don’t
IBM’s quantum hardware roadmap, Google’s accelerated 2029 internal deadline, and a research paper that cut the qubit threshold for breaking elliptic curve cryptography by a factor of 20 have together changed the calculus of this field in the first half of 2026. The story is not that a quantum computer has broken encryption. It is that the organizations responsible for the internet’s security infrastructure are treating 2029 as the prudent completion date for post-quantum migration, and fewer than 5% of enterprises have a plan.
In the next 6 to 18 months, expect three things. First, government contractor compliance pressure from the January 2027 CNSA 2.0 acquisition deadline will cascade into commercial vendor roadmaps, making PQC readiness a de facto procurement requirement across more of the market than current regulations technically require. Second, more industry practitioners will follow Cloudflare and Google in publicly accelerating their timelines, creating reputational and audit risk for organizations that have not started. Third, cyber insurance underwriters and financial regulators will begin asking formal questions about quantum readiness in the same way they now ask about multi-factor authentication.
Three specific things to watch: the release of IBM’s Quantum Starling technical specs when they arrive in late 2028, NIST’s progress on IR 8547 (which addresses transitioning from currently deployed algorithms), and whether the EU’s regulatory framework develops parallel quantum-resistance mandates timed to the 2025 to 2030 NIS2 implementation period.
The organizations that complete post-quantum cryptography migration before Q-Day is demonstrably close will not win prizes. They will simply avoid the ones that do not.
Stay Ahead of What’s Coming
Get NeuralWired’s weekly briefing on quantum computing, enterprise security, and the technology decisions that matter for CTOs and CISOs.
Subscribe to The Neural Loop
AI · June 29, 2026 · NeuralWired Research Desk · 9 min read
OpenAI’s Jalapeño Chip: Inside Sam Altman’s $34B Survival Bet
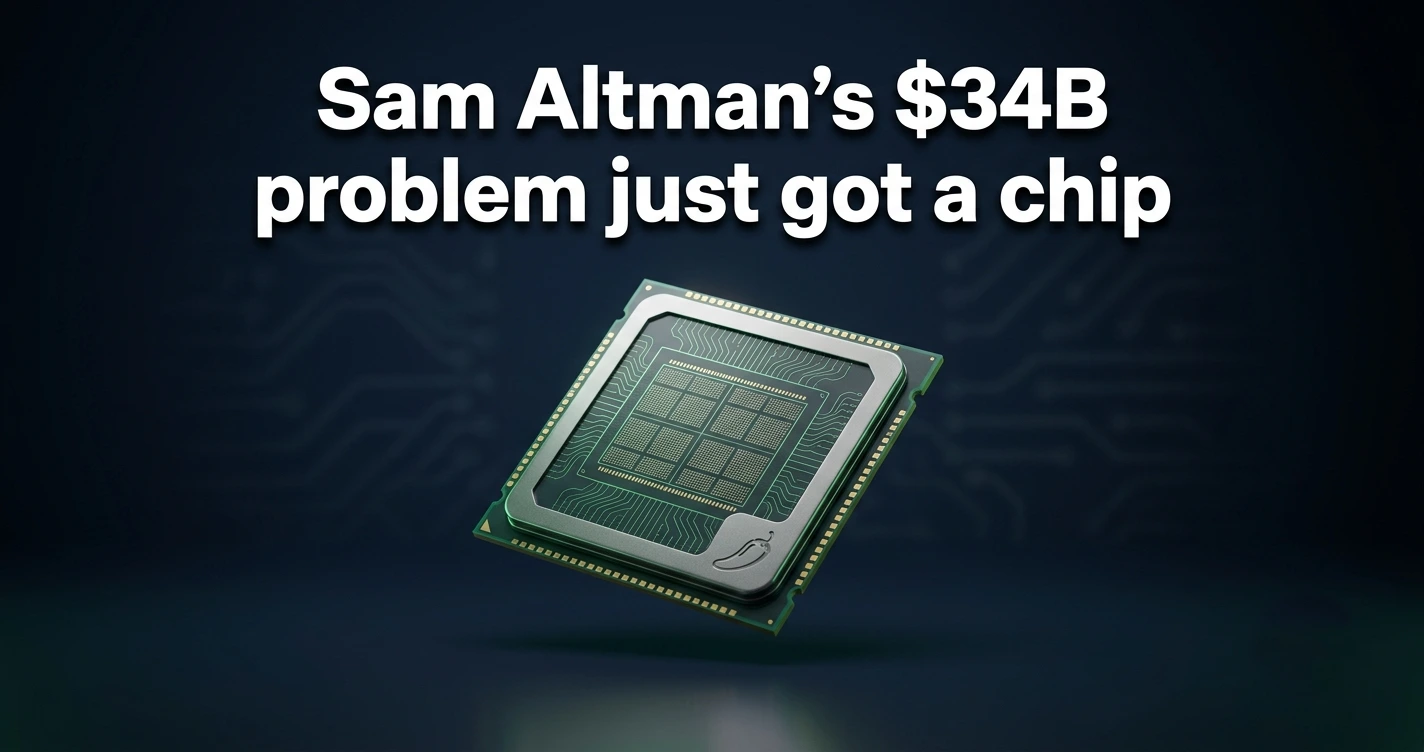
OpenAI just became a chipmaker, and the math explains why. On June 24, 2026, Sam Altman’s company unveiled Jalapeño, its first custom AI inference chip, built with Broadcom (NASDAQ: AVGO) and manufactured on TSMC’s 3 nanometer process. The timing is not a coincidence. OpenAI spent $34 billion in 2025 to generate just $13.07 billion in revenue, a $20.92 billion operating loss that landed in audited financials leaked and verified by the Financial Times just weeks before this launch. Jalapeño is the company’s answer to a question investors keep asking ahead of its IPO: can OpenAI ever stop bleeding money on every single ChatGPT reply?
This isn’t a side project. It’s a hardware bet that touches Sam Altman, Greg Brockman, Broadcom CEO Hock Tan, and a Nvidia relationship that suddenly looks a lot more complicated.
What is the OpenAI Jalapeño chip? Jalapeño is OpenAI’s first custom AI inference chip, unveiled June 24, 2026 and co-developed with Broadcom. It is purpose-built to run large language models like ChatGPT and Codex more cheaply than renting Nvidia GPUs, and is not designed for training AI models.
Why OpenAI Suddenly Needed Its Own Chip
Every time someone sends a ChatGPT message, a server somewhere runs an “inference” pass, a single pass of a massive model generating a response token by token. Training a model happens occasionally. Inference happens constantly, hundreds of millions of times a day, and at OpenAI’s scale that workload has become the company’s single largest operating expense.
The audited 2025 numbers, reported by MLQ News, show just how steep that cost has become. OpenAI’s revenue jumped 253% year over year to $13.07 billion, which sounds like a win until you see the other side of the ledger: $34 billion in total costs, $19.18 billion of that in R&D alone, and $17.2 billion paid to Microsoft for compute and research support in a single year.
“The hardware press covered it as a shot across Nvidia’s bow. That framing misses the actual story. The real story is about unit economics so broken they were threatening OpenAI’s survival.” — Noah Bean, Independent Technical Analyst, via Medium
Renting general-purpose Nvidia GPUs for a workload that is memory-bound, sequential, and repetitive is, in plain terms, an expensive way to do a narrow job. That gap between what GPUs were built for and what LLM inference actually needs is the entire reason Jalapeño exists.
What Jalapeño Actually Is
Jalapeño is what’s known as an ASIC, an Application-Specific Integrated Circuit. Unlike a Nvidia GPU, which is built to handle a wide range of parallel computing tasks, Jalapeño was designed from a blank slate to do one job: run inference for large language models like GPT-5.3 and Codex as efficiently as physically possible. OpenAI is calling it an “Intelligence Processor.”
It was manufactured on TSMC’s 3 nanometer process and measures roughly 840mm², which puts it near the absolute physical limit of what current chipmaking equipment can produce in a single die. Broadcom contributed silicon implementation and its Tomahawk networking technology, letting thousands of Jalapeño chips function as one unified system, while manufacturing partner Celestica handles the racks and board integration that get the chips into data centers.
Richard Ho, OpenAI’s head of hardware, described the design philosophy in the company’s own announcement:
“Jalapeño was designed from the ground up for LLM inference using detailed insights from our close collaboration with OpenAI researchers. We optimized the architecture around the kernels, memory movement, networking, and serving patterns that matter most for frontier AI models.” — Richard Ho, Head of Hardware Program, OpenAI, OpenAI Blog
A Nine-Month Tape-Out, Built Partly by AI
What makes this launch genuinely unusual is the speed. Most custom chips take 18 to 36 months from initial design to tape-out, the point where the design is finalized and sent to a fab for manufacturing. Jalapeño did it in nine months. OpenAI says part of that acceleration came from using its own AI models as virtual design assistants during the engineering process.
Here’s where the popular framing of this story starts to fall apart. Plenty of headlines this week are treating Jalapeño as OpenAI’s break from Nvidia. The actual relationship is far messier than that, and far more interesting.
In February 2026, Nvidia made a $30 billion direct investment in OpenAI and the two companies signed a deal to deploy 10 gigawatts of Nvidia’s next-generation Vera Rubin GPU systems. OpenAI is simultaneously a major Nvidia customer, a Nvidia investment target, and now a Nvidia competitor in the inference chip space. That’s not independence. That’s leverage.
But diversifying a footprint and replacing a dependency are two very different things, and the next section explains exactly where Jalapeño’s limits are.
The Risks Nobody’s Headline Is Mentioning
Most coverage this week leaned bullish. Here’s what that coverage tends to leave out.
The performance numbers are not verified
OpenAI says Jalapeño delivers performance-per-watt “substantially better than current state-of-the-art.” A figure suggesting roughly 50% lower inference cost versus mainstream GPUs has circulated from Hock Tan’s Bloomberg interview, but no TFLOPS number, memory capacity figure, or independently audited benchmark has been published. A full technical report is expected “in the coming months,” meaning the current narrative runs entirely on marketing language.
This is OpenAI’s first chip, ever
Google shipped its first TPU in 2016 and is now on its seventh generation. Amazon’s Trainium has multiple production cycles behind it. OpenAI has never shipped silicon before Jalapeño. Matt Bryson, Senior Analyst at Wedbush Securities, has publicly noted that successful chip programs typically need multiple design iterations before production maturity, and first-generation yield or integration problems rarely show up in launch-day demos.
ASICs can’t pivot
GPUs are flexible by design. A reticle-sized ASIC tuned for today’s transformer-based LLM inference is not. If the field moves toward state space models, new mixture-of-experts routing, or some other post-transformer architecture, a chip this specialized could become expensive scrap rather quickly. Betting a 10-gigawatt infrastructure program on today’s model architecture carries real exposure.
The deployment timeline is longer than the headlines suggest
Prototype deployment is targeted for late 2026, mostly inside Microsoft Azure data centers, with volume production ramping through 2027 into the first half of 2028. The Information previously reported the project slipped from an earlier Q2 2026 target amid demands for higher performance. Translation: most users won’t feel any actual benefit from Jalapeño for at least another year.
The bottom line: Jalapeño is a margin defense system, not a Nvidia killer. It buys OpenAI leverage and a path toward better unit economics, but the company is still years away from silicon independence, and still deeply tied to Nvidia for training.
Where the Rest of the Industry Already Is
OpenAI isn’t pioneering custom silicon. It’s catching up. Google’s TPU has been in production since 2016 and now powers most of Google’s AI products. Amazon’s Trainium runs AWS workloads at scale, and OpenAI itself committed to 2 gigawatts of Trainium capacity in early 2026. Microsoft’s Maia 200 launched in January 2026 and already powers parts of GPT-5.2 inside Azure. Meta has its own MTIA chip running recommendation and Llama workloads.
The logic driving all of them is the same: once a company is operating at hyperscale, the cost of renting general-purpose GPU compute eventually exceeds the cost of just building the chip yourself. OpenAI is finally crossing that line, several years after everyone else.
What This Means for OpenAI’s IPO
OpenAI is privately valued at $852 billion after a March 2026 funding round led by SoftBank and Microsoft, and confidentially filed for an IPO on June 8, 2026. That valuation is hard to square with a $20.92 billion annual operating loss unless investors believe the cost structure is about to change. Jalapeño is the centerpiece of that argument. OpenAI’s own cost-to-revenue ratio improved from $2.37 per dollar of revenue in 2024 to $1.60 per dollar in 2025, and the company has stated it expects to reach profitability by 2029. Inference chip ownership is the lever it’s pulling to get there faster.
Frequently Asked Questions
What is OpenAI’s Jalapeño chip?
Jalapeño is OpenAI’s first custom AI inference chip, co-developed with Broadcom and announced June 24, 2026. Built on TSMC’s 3nm process and completed in nine months, it’s a purpose-built accelerator for running large language models like ChatGPT and Codex, not a general-purpose GPU. Source: OpenAI BlogWill OpenAI’s Jalapeño chip replace Nvidia?
Not anytime soon. Jalapeño only handles inference, not training, which still runs on Nvidia GPUs. It’s a hedge to cut costs and reduce dependency, not a clean break. Nvidia made a $30 billion direct investment in OpenAI in February 2026, keeping the relationship deeply intertwined. Source: CNBCWhen will OpenAI’s Jalapeño chip be deployed?
Initial prototype deployment is planned for late 2026, mainly inside Microsoft Azure data centers, with volume production ramping through 2027 into the first half of 2028. The full 10-gigawatt rollout with Broadcom targets completion by end of 2029. Source: BroadcomHow much cheaper is Jalapeño than Nvidia GPUs?
OpenAI claims substantially better performance-per-watt, and a figure from Broadcom’s CEO suggested roughly 50% lower inference cost. These are self-reported, pre-production numbers with no independent verification yet. A full technical report is expected in the coming months. Source: MACGPUWhy did OpenAI build its own chip?
OpenAI’s 2025 financials show a $20.92 billion operating loss on $13.07 billion in revenue, driven largely by Nvidia GPU inference costs. Jalapeño is a structural fix aimed at cutting per-token compute costs and reducing single-vendor dependency ahead of its IPO. Source: MLQ NewsWhat role does Broadcom play in the Jalapeño chip?
Broadcom provided silicon implementation expertise and its Tomahawk networking technology, letting thousands of Jalapeño chips operate as one unified system. Partner Celestica handles board and rack integration. OpenAI designed the architecture; Broadcom industrialized it. Source: OpenAI Blog
The Takeaway
Jalapeño is less a declaration of war on Nvidia and more an admission of just how unsustainable OpenAI’s compute bill had become. It’s a serious engineering achievement, a nine-month tape-out is genuinely fast, but it’s also a first-generation chip from a company that has never shipped silicon, with real benchmarks still unpublished and full deployment still more than a year away. Whether Jalapeño becomes the thing that finally gets OpenAI to profitability, or just one more expensive bet inside an already expensive year, depends entirely on numbers nobody outside OpenAI and Broadcom has seen yet.
Broken CI/CD Pipelines Cost Enterprise Teams 6.3 Hours Per Developer Per Week. The 5-Layer Pipeline Audit That Kills the Hidden Tax on Engineering Velocity
NeuralWired Editorial|June 29, 2026|18 min read
TL;DR
Engineering teams lose up to 20% of weekly hours to pipeline inefficiencies, with CI/CD problems accounting for roughly 6.3 hours per developer per week (composite figure from multiple JetBrains, Atlassian, and GitNexa sources).
GitHub Actions leads enterprise adoption at 33%, but 18% of organizations still run no CI/CD tooling at all.
In 2025, 59% of machines with compromised credentials were CI/CD runners, not developer laptops. CI/CD is now the primary enterprise breach surface.
Elite teams deploy code 200 times more frequently than low performers. The pipeline is the difference.
The 5-layer audit in this article covers Build Speed, Test Integrity, Artifact Strategy, Security Posture, and Observability. Each layer includes specific targets, warning signs, and fixes.
Your engineering team shipped an AI coding assistant rollout six months ago. Developers are moving faster. Commits are up 40%. The board is happy. And yet your CI/CD pipeline, which was designed and sized in 2022, is now quietly eating $2 million a year in productivity that nobody can see on a dashboard.
This is the hidden tax on engineering velocity in 2026. CI/CD pipeline enterprise best practices have not kept pace with the volume of code that AI-assisted development teams now produce. The result is a compounding crisis: longer queues, flakier tests, overloaded runners, and a security exposure that GitGuardian now calls “the primary breach surface” in enterprise software infrastructure.
The numbers are not abstract. JetBrains’ 2026 developer experience research found that engineering teams lose 20% of weekly working hours to inefficiencies, tooling waste, and technical debt. That is eight hours per developer per week, gone. Pipeline problems are a leading component. Break out the specific contributors, and you arrive at a conservative pipeline-specific figure of roughly 6.3 hours weekly: build wait times, flaky test reruns, pipeline maintenance, context-switch recovery, and manual deployment coordination. (This is a composite figure from multiple sources, detailed in the methodology section below; it is not a single survey number.)
At a fully-loaded developer rate of $150 per hour, a 50-person engineering org hemorrhages $2.34 million every year. Not from bad architecture decisions. Not from tech debt. From a pipeline that hasn’t been audited since a pre-AI-era commit volume.
This is the guide that fixes that. What follows is a structured 5-layer CI/CD pipeline audit framework designed for CTOs, Platform Engineers, and DevOps leads who are done treating pipeline optimization as ad hoc firefighting and ready to treat it as product engineering.
20%
Weekly developer hours lost to pipeline and tooling inefficiency
200x
Deployment frequency gap: elite CI/CD teams vs. low performers
59%
Of compromised machines in 2025 were CI/CD runners, not laptops
$13.2B
Global CI/CD tools market in 2026, growing at 8.2% CAGR
The State of Enterprise CI/CD in 2026: Adoption Is Fractured, Pressure Is Universal
The simplest way to describe enterprise CI/CD in 2026 is this: wide adoption, uneven maturity, and a pressure curve that AI tools just made dramatically steeper.
According to the JetBrains State of CI/CD 2025 survey of 805 developers, 55% of developers regularly use CI/CD tooling. GitHub Actions leads organizational adoption at 33%, followed by Jenkins at 28% and GitLab CI at 19%. Thirty-two percent of organizations run two CI/CD tools simultaneously, and 9% run three or more.
That last statistic is worth sitting with. Running parallel pipelines is not a sign of sophistication. It is usually a sign of a migration that stalled halfway through, with teams maintaining legacy Jenkins configurations for critical systems while adopting GitHub Actions for new projects. JetBrains researchers found that migration timelines run 12 to 24 months for enterprises with more than 200 pipelines, and that many organizations halt migration entirely once they calculate the cost of moving deeply embedded plugin dependencies and compliance-critical configurations.
The adoption gap nobody talks about: 18% of organizations in the JetBrains 2025 CI/CD survey report using no CI/CD tooling at all. Despite a decade of DevOps evangelism, nearly one in five technology organizations still ships code without automated pipelines. Any claim that CI/CD is universally mature in enterprise software is overstated.
The AI acceleration factor has changed the calculus for every organization, regardless of where they sit on this spectrum. GitHub reported in 2024 that developers using Copilot completed tasks 55% faster. By 2025, public GitHub commits had climbed to approximately 1.94 billion, up 43% year over year. If your pipeline was sized for 2022 commit volumes, you are now running a 2022 highway with 2026 traffic. The congestion is not a fluke.
This is the context inside which the 5-layer audit lives. It is not a theoretical framework for organizations with the luxury of a dedicated platform engineering team. It is a triage protocol for engineering leaders who need to reclaim lost velocity right now.
The Real Cost of a Broken Pipeline (The Math Your Budget Meeting Is Missing)
Most engineering budget conversations treat pipeline performance as an infrastructure cost center, not a revenue variable. That framing is exactly wrong.
Start with the composite time loss figure. The 6.3 weekly hours per developer breaks down as follows:
Pipeline Inefficiency Component
Est. Hours/Week
Source
Build wait time (45-min avg, 2 daily merges)
~1.5 hrs
GitNexa CI/CD Guide 2026
Flaky test debugging and reruns
~1.0 hr
Atlassian Engineering, Dec 2025
Pipeline maintenance (config, plugins, YAML)
~1.5 hrs
JetBrains Survey 2025
Context-switch recovery from pipeline failures
~1.3 hrs
JetBrains DX Research 2026
Manual deployment coordination
~1.0 hr
JetBrains TeamCity Blog 2026
Total composite estimate
~6.3 hrs
Multiple verified sources
Note: The most defensible single-source benchmark is JetBrains’ 20% weekly time loss figure (8 hours at a 40-hour week). The 6.3-hour figure is a conservative, pipeline-specific subset of that total, derived by attributing CI/CD issues as the primary driver while excluding broader tooling and technical debt components. Both figures point to the same conclusion.
Run the math on a 50-person engineering org at a $150 per hour fully-loaded rate: 6.3 hours of weekly pipeline waste, 50 developers, 52 weeks. That is $2.45 million in recoverable productivity loss per year. That number funds two senior engineers, a complete toolchain migration, and a six-month security hardening sprint.
“Engineers are typically the most expensive people in a company, and making them wait for builds to finish or forcing them to manually fix flaky tests is a major productivity killer.”
Mary Moore-Simmons, VP of Engineering, Keebo — DevOps.com, April 2025
The JetBrains research goes further: surveys suggest developers can reclaim up to a full working day per week when toolchain inefficiencies are eliminated. Even a conservative three-hour weekly reclaim translates to more than $75,000 in annual productivity per engineer.
But the cost calculation changed in 2025. The DORA 2025 report, now titled “State of AI-Assisted Software Development,” reframed pipeline performance as a talent retention risk, not just a velocity metric. The new framework measures burnout and friction alongside deployment frequency. Teams where developers spend hours per week fighting their pipelines show measurably higher attrition intent. That is a hiring cost, too.
“Nearly all of them agree that a sluggish CI/CD pipeline does more than delay build times or slow deployment frequency. It erodes the very fabric of a team’s morale and productivity. Issues that could be quickly resolved instead take longer to debug, leading to delayed fixes and compounding stress across team members, especially when a breakdown happens just before a critical deployment.”
Mudit Singh, VP of Product, LambdaTest — DevOps.com, April 2025
What DORA 2025 Actually Tells You (And What It Stops Telling You)
Before walking through the 5-layer audit, it is worth establishing the benchmarking framework that most enterprise engineering teams now use to measure pipeline performance: DORA metrics.
DORA (DevOps Research and Assessment), Google Cloud’s research program tracking 39,000+ professionals since 2014, defines software delivery performance across five dimensions in its 2025 update:
DORA Metrics: 2025 Updated Framework
Deployment Frequency — How often you ship to production
Lead Time for Changes — Commit to production time
Change Failure Rate — Percentage of deployments causing incidents
Failed Deployment Recovery Time — Updated from MTTR; reclassified as throughput, not stability
Rework Rate — New in 2024; proportion of unplanned deployments to fix user-visible issues
The 2025 DORA report replaced the old elite/high/medium/low tier classification with seven team archetypes that blend delivery performance with human factors including burnout and perceived value. This matters. Organizations were “chasing elite status” in ways that produced superficial metric improvements without changing actual delivery outcomes.
The most important DORA finding for this audit: elite performers who excel across these metrics are twice as likely to meet organizational performance targets. And the deployment frequency gap between elite and low-performing teams is 200 times. Not 20%. Two hundred times the frequency.
That gap is pipeline-driven. Low performers go weeks between releases not because they write worse code, but because their pipeline cannot absorb change at speed.
The DORA 2025 AI finding is the contrarian note worth flagging. Teams that adopt AI coding tools without first establishing strong foundational delivery practices actually see performance harm. AI amplifies what already exists. It strengthens strong teams and exposes structural weaknesses in fragile ones. A broken CI/CD pipeline with AI-assisted code generation is not a faster broken pipeline. It is a pipeline that breaks more often.
The 5-Layer CI/CD Pipeline Audit: A Framework for Enterprise Teams
What follows is a systematic audit protocol. For each layer, there is a set of diagnostic questions, warning signs that indicate a problem, specific fix actions, and target thresholds. Treat this as a product engineering checklist, not a one-time exercise.
01Build Infrastructure and Speed
What to audit: Baseline build time per pipeline, cache effectiveness, runner sizing relative to job requirements, and parallelization opportunities across stages.
Warning signs: Builds regularly exceeding 45 minutes; no caching layer for npm, pip, or Maven; sequential build chains where parallel stages would work; queue wait times over five minutes before a runner picks up a job.
The GitNexa 2026 CI/CD Optimization Guide identifies 45-to-90-minute build cycles as the current enterprise norm. The industry target is under 10 to 15 minutes. Teams above 45 minutes are running at three to six times the acceptable threshold.
Fix: Run lint and unit tests first so failures are caught early. Implement dependency caching keyed to lock files, not branches. Enable autoscaling runners so queue wait does not compound build time. Use immutable artifacts so you are not rebuilding identical work. Assign runner size to actual job requirements, not defaults.
Target threshold
Under 15 minutes total
Critical failure signal
45+ minutes per build
02Test Infrastructure Integrity
What to audit: Flaky test rate, test suite execution time, parallelization strategy, and whether failed tests trigger automatic reruns that mask real failures.
Warning signs: Developers silently retrying failed pipeline runs without investigation; test suite longer than the build itself; no distinction between unit, integration, and end-to-end test stages; more than 15% of failures attributable to flaky tests.
The data on flaky tests is alarming at scale. Atlassian’s December 2025 internal study on the Jira backend repository found that 15% of CI failures were attributable to flaky tests, wasting more than 150,000 developer hours per year from reruns alone. Microsoft Research found a 13% flaky failure rate in their CI systems. Google Research found 16%. No mature pipeline is immune.
The deeper problem is signal corruption. When developers learn to ignore failed runs and retry, they lose the ability to distinguish a real regression from a flaky test. The pipeline stops functioning as a quality gate. Bad code ships.
Fix: Implement the Test Pyramid: a large base of fast unit tests, moderate integration tests, minimal slow end-to-end tests. Quarantine identified flaky tests into a separate non-blocking stage so they cannot block deployment while still tracking them. Use impact-based test execution so a CSS change does not trigger the full test suite. A full test run should complete in under 15 minutes using parallel execution and mocked services.
Target flaky rate
Below 2%
Critical failure signal
Above 5% flaky rate
03Artifact and Deployment Strategy
What to audit: Whether artifacts are built once and promoted versus rebuilt per environment, deployment strategy (rolling vs. canary vs. blue-green), rollback capability and mean time to rollback, artifact versioning, and traceability to commit SHAs.
Warning signs: Code rebuilt separately for staging and production, creating the conditions for environment drift; no automated rollback triggered by failure metrics; deployment history not tied to commit SHAs; artifacts overwritten rather than versioned.
Fix: Build once, deploy everywhere. The same artifact must traverse dev through staging through production. Canary or blue-green deployment eliminates the binary all-or-nothing risk of direct production pushes. Never overwrite a versioned artifact; always produce a new version. Scan all artifacts for known vulnerabilities before deployment, and use signed artifacts to guarantee integrity at each environment boundary.
Target strategy
Build once, promote everywhere
Critical failure signal
Per-environment rebuilds
04Security Posture
What to audit: Long-lived credentials in pipeline YAML or environment variables (target: zero); GitHub Actions pinning strategy (SHA vs. tag); runner ephemeralness; secrets scanning in pre-commit hooks and build artifacts; Software Bill of Materials (SBOM) generation.
Warning signs: Any API key, token, or password hardcoded in a .yml file, Jenkinsfile, or Dockerfile; Actions pinned to version tags rather than commit SHA hashes; non-ephemeral self-hosted runners; no automated secrets scanning before commits reach the repository.
The threat is documented and active. In March 2025, CVE-2025-30066 exposed the tj-actions/changed-files GitHub Action attack, where attackers retroactively modified version tags to point to a malicious commit, exposing CI/CD secrets in workflow logs across more than 23,000 repositories. This is the exact mechanism that SHA pinning prevents. Tags are mutable. SHA hashes are not.
In September 2025, the GhostAction supply chain attack hit 817 repositories, injecting malicious workflows that exfiltrated 3,325 secrets including PyPI, npm, and DockerHub tokens. Separately, the Shai-Hulud 2 npm worm used harvested GitHub Personal Access Tokens to inject malicious code across over 46,000 packages in a single wave.
GitGuardian’s State of Secrets Sprawl 2026 report found that 59% of machines with compromised credentials in 2025 were CI/CD runners, not developer workstations. There were 28.65 million new hardcoded secrets added to public GitHub commits in 2025 alone, a 34% year-over-year increase. In AI services specifically, secrets exposure rose 81%.
The remediation gap is the part no one talks about. Nearly 70% of credentials confirmed as valid in 2022 were still valid in January 2025. Retested in January 2026, the validity rate was still above 64%. Detection is not the problem. Rotation is.
Fix: Runtime secrets injection from HashiCorp Vault, AWS Secrets Manager, or Azure Key Vault. Zero secrets in pipeline configuration files. Pin all GitHub Actions to full commit SHA, not version tags. Implement ephemeral runners that are destroyed after each job, eliminating cross-job credential persistence. Run GitGuardian or equivalent both as a pre-commit hook and as a pipeline step. Wiz’s State of Code Security 2025 found that 35% of enterprises still use non-ephemeral self-hosted runners, meaning 35% have an open lateral movement path across repositories.
Target credential exposure
Zero hardcoded credentials
Critical failure signal
Tag-pinned Actions or static runner state
05Observability and Continuous Improvement
What to audit: Whether DORA metrics are actively tracked and reviewed; whether pipeline performance data surfaces in real-time dashboards; how build failures are categorized rather than simply retried; and whether pipeline ownership is explicitly assigned.
Warning signs: No visibility into pipeline cost per build; no alerting when build times regress past a threshold; DORA metrics not reviewed in sprint retrospectives; pipeline changes deployed without first testing in an isolated branch.
Teams that implemented real-time dashboards and immediate alerts reduced their mean time to resolution by up to 50%, with a 30% improvement in response times. The underlying principle is simple: you cannot improve what you do not measure, and you cannot measure what you do not instrument.
The new Rework Rate DORA metric, added in 2024, is particularly valuable here. It measures the proportion of unplanned deployments made to fix user-visible issues. A high Rework Rate is a leading indicator of pipeline instability before it shows up in Change Failure Rate, which means it gives you earlier warning.
This is also where AIOps self-healing infrastructure becomes relevant. Once pipeline observability is in place, AIOps systems can automate responses to detected anomalies rather than waiting for a human to notice a dashboard and file a ticket.
Fix: Implement Grafana or Datadog pipeline dashboards with real-time Failed Deployment Recovery Time alerts. Track Rework Rate as a leading indicator. Assign explicit pipeline ownership: the pipeline is a product, not shared infrastructure with no owner. Validate pipeline changes in isolated branches before deploying to main.
Target
All 5 DORA metrics tracked in real time
Critical failure signal
No pipeline cost visibility or ownership
5-Layer Audit: Quick Reference Benchmarks
Layer
Key Metric
Target Threshold
Primary Tool
1. Build Speed
End-to-end pipeline time
Under 15 minutes
GitHub Actions, GitLab CI, Jenkins + caching
2. Test Integrity
Flaky test rate
Below 2%
Pytest, Jest, Playwright with quarantine stages
3. Artifact Strategy
Artifact promotion model
Build once, promote everywhere
Artifactory, ECR, Docker Hub with signed images
4. Security Posture
Hardcoded credentials count
Zero
HashiCorp Vault, GitGuardian, SLSA controls
5. Observability
DORA metrics tracked
All 5 in real time
Grafana, Datadog, LinearB, Cortex
The FinOps Angle: Your CI/CD Pipeline Is Bleeding Cloud Budget
The Flexera 2025 State of the Cloud Report found that organizations overspend an estimated 28% on cloud resources. CI/CD workloads are among the primary contributors, specifically container builds and ephemeral environments that are provisioned and never torn down after a job completes.
For a team spending $100,000 per year on CI/CD compute, $28,000 is waste. That is not an estimate with wide uncertainty bands. It is a consistent finding across multiple FinOps audits. The most common sources: oversized runners assigned to lightweight jobs, parallel stages that provision maximum runners and then sit idle, and test environments that spin up at the start of a pipeline run and remain allocated after the run fails.
The fix is operational, not architectural. Right-size runner configurations to actual job requirements. Automate environment teardown as a guaranteed step in every pipeline, success or failure. Enable autoscaling with defined minimum and maximum runner pools. Instrument cost per build in your Layer 5 observability dashboard so you can see regressions before they compound.
The cloud cost angle also matters for the GitHub Actions vs. Jenkins decision. GitHub Actions’ cloud runners carry a per-minute cost that scales directly with build time. Every minute you cut from your pipeline runtime under Layer 1 has a direct, calculable cloud cost reduction.
Three Things This Article Won’t Oversell
Migration Is Genuinely Hard
The narrative that enterprises should simply modernize their Jenkins pipelines to GitHub Actions understates what that actually costs. Organizations with 200+ pipelines, deeply embedded plugin infrastructure, and compliance requirements that mandate on-premises execution face migration cycles of 12 to 24 months. Many companies find the migration timeline so prohibitive that they decide not to do it at all.
“When developers struggle to get changes quickly and reliably through the CI/CD pipeline, it doesn’t just slow feedback. A more damaging effect is the loss of trust. When changes are delayed or cause customer-impacting issues, the business loses confidence in their ability to deliver. This often leads to increased bureaucracy and slower processes, further exacerbating the problem.”
Steve Fenton, Director of Developer Relations, Octopus Deploy — DevOps.com, April 2025
The 5-layer audit works regardless of tooling. You can apply it to a Jenkins-only environment, a GitHub Actions-only environment, or a hybrid of both. The audit diagnoses the problem; the tool choice for the fix comes second.
The “Right Tool” Answer Is Wrong
Adding more tooling to a broken pipeline is a category error. Kai Tillman, Senior Engineering Manager at Ambassador API, puts it directly: the number one way to optimize CI/CD is to identify tools that reduce the work developers must invest in building and maintaining the pipeline itself, replacing manual steps for environment creation, deployment, and testing with simple commands. The goal is fewer steps. Not more tools.
DORA Scores Are Not the Goal
The reason DORA 2025 replaced the elite/high/medium/low tiers with seven team archetypes is that too many engineering orgs were optimizing their DORA scores rather than their delivery outcomes. Deployment frequency can be inflated by shipping trivially small changes. Change Failure Rate can be gamed by rolling back before failures are logged. The metrics are useful when they measure what they were designed to measure. Chasing the number rather than the outcome is a failure mode the DORA researchers now explicitly warn against.
Why AI Developer Tools Make This More Urgent, Not Less
If your team has adopted AI coding tools like GitHub Copilot, Cursor, or Claude Code, this section applies directly to your current planning cycle.
The 43% increase in public GitHub commits between 2024 and 2025 is not organic developer productivity growth. It is AI-assisted code generation compressing the time between idea and commit. More commits mean more pipeline executions. Pipelines that were handling 20 triggers per day are now handling 28 or more. The infrastructure has not scaled to match.
The DORA 2025 research makes this explicit: teams that adopt AI coding tools without first establishing strong foundational delivery practices see performance harm. AI amplifies the existing system. A slow, insecure, poorly observed pipeline under AI-assisted development does not get better faster. It gets worse at scale.
The practical implication: if your organization has rolled out AI coding tools in the past 12 months, a pipeline audit is not optional. You have already increased your commit volume. You need to know if your pipeline can absorb it without degrading security posture, build reliability, or developer experience.
Frequently Asked Questions: CI/CD Pipeline Enterprise Best Practices 2026
What are the best practices for CI/CD pipelines in 2026?
In 2026, CI/CD pipeline best practices center on five layers: build speed (under 15 minutes), test integrity (flaky test quarantine below 2%), artifact management (build once, promote everywhere), security hardening (no hardcoded credentials, SHA-pinned Actions, ephemeral runners), and observability (all five DORA metrics tracked in real time). Elite teams deploy 200 times more frequently than low performers using these principles. Source: DORA, JetBrains, GitNexa.