Tech policy analysis: AI regulation, data privacy laws, antitrust enforcement, digital governance, and legislative updates affecting technology companies and professionals globally.
On June 25, 2026, the European Commission did something it had never done before: it named Amazon Web Services and Microsoft Azure as candidate “gatekeepers” under the Digital Markets Act, the same law that already cost Apple and Meta hundreds of millions in fines. The reason is one word your procurement team already knows too well: cloud vendor lock-in.
If you run infrastructure, own a cloud contract, or sign off on FinOps budgets, this isn’t a policy footnote. It’s a negotiating lever you can use this quarter, and a deadline (January 12, 2027) that changes what your vendor is legally allowed to charge you for leaving.
The Digital Markets Act has spent its first few years going after consumer platforms. App stores. Messaging apps. Ad targeting. The June 25 preliminary finding against AWS and Azure is the first time Brussels has pointed the DMA at cloud infrastructure specifically, and the underlying logic will sound familiar to anyone who has tried to move a production workload off S3: enormous customer bases, deep integration into everything downstream, and switching costs steep enough to keep customers in place even when they’d rather leave.
Nothing is final yet. AWS and Microsoft can respond in writing and request an oral hearing, and the Commission is expected to issue a final designation before the end of 2026. But the stakes are not small. Non-compliance under the DMA can trigger fines of up to 10% of global annual turnover, a ceiling that would dwarf the €500 million fine Apple has already faced and the €200 million levied against Meta.
Why this matters to your contract, not just the headlines
This is the first regulatory body treating cloud switching costs as an antitrust issue rather than a pricing detail. Procurement teams at regulated industries, especially finance, already answer to exit-strategy rules under frameworks like DORA. This ruling gives every other industry the same kind of leverage in a renewal conversation.
What Cloud Vendor Lock-In Really Means
Vendor lock-in isn’t a single fee. It’s a structural dependency that builds up quietly across years: proprietary APIs your engineers have written against, managed database formats that don’t export cleanly, IAM and identity systems wired into everything, and staff expertise that only transfers within one platform’s ecosystem of tools. Individually, none of these look like a trap. Together, they make switching providers too costly, too slow, or too risky to be a real option, even when a competitor is cheaper.
The concern is close to universal now. According to Parallels’ 2026 State of Cloud Computing Survey, 94% of organizations report concern about vendor lock-in, a figure that’s climbed year over year across a panel of 540 IT professionals in the US, UK, and Germany.
The Real Cost of Leaving, in Dollars
Egress fees, the charge you pay to move your own data out of a cloud provider, are the most visible piece of the lock-in problem, and they scale fast.
Provider
Standard egress price
Cost to move 1 petabyte
AWS S3
$0.09/GB (first 10TB)
$90,000–$120,000 (industry estimate)
Microsoft Azure
$0.087/GB
Comparable range
Google Cloud
$0.12/GB
Comparable to slightly higher
Cloudflare R2
$0.00
$0
Pricing verified June 2026 via egresscost.com, cross-checked against provider documentation.
That math is not theoretical. When Basecamp’s parent company 37signals exited the cloud entirely in 2023 and 2024, AWS reportedly waived roughly $250,000 in egress fees as part of the departure, a number widely reported by DHH and the company itself. 37signals has since projected $7–10 million in savings over five years from running its own hardware instead.
The UK Cabinet Office has run the same math at government scale. Its analysis estimates that overreliance on a single cloud provider could cost UK public bodies £894 million, a figure cited across multiple 2026 explainers tied to the UK Competition and Markets Authority’s cloud market investigation.
The “free egress to leave” programs are narrower than they sound
All three hyperscalers now offer free egress for customers who fully exit their platform, a move that predates the EU’s enforcement push and rolled out back in 2024. Here’s the part most coverage skips: these waivers require discretionary approval from the vendor’s own support team, apply only to a complete exit, and explicitly do not cover data you move for ongoing multi-cloud use. If your strategy is “run workloads across two providers permanently,” the free-egress headline doesn’t apply to you at all.
Multi-Cloud and Repatriation: Two Different Bets
Enterprises are responding to lock-in risk in two very different ways, and it’s worth being precise about which one you’re actually running.
Multi-cloud is the dominant approach. Flexera’s State of the Cloud 2026 report found that 89% of enterprises now run a multi-cloud strategy, with 42% naming lock-in avoidance as the primary driver. It’s a hedge: spread workloads across providers so no single vendor holds all the leverage.
Repatriation is the opposite move: bringing workloads back from public cloud to on-premises or private infrastructure. Barclays’ Q4 2024 CIO survey found 86% of CIOs plan to repatriate at least some workloads, and IDC independently put the figure at 80% within 12 months. Broadcom’s own internal shift off public cloud database services and onto VMware Data Services Manager reportedly saved the company over $10 million, with Broadcom’s broader analysis suggesting modern private cloud can deliver 40 to 50% lower total cost of ownership for steady-state workloads.
Read those repatriation numbers carefully, though. They describe intent to move some workloads, not a wholesale exodus from public cloud. Synergy Research still put public cloud spend growth at 35% year over year in Q1 2026. Both trends are true at once: enterprises are repatriating specific, predictable workloads while continuing to grow their overall public cloud footprint for everything else.
“Despite the enormous scale of the cloud market, in Q1 the cloud market growth rate increased for the tenth successive quarter.”
John Dinsdale, Chief Analyst, Synergy Research Group · via Statista
That growth is concentrated. AWS, Azure, and Google Cloud together hold an estimated 63 to 68% of global cloud infrastructure revenue, with Synergy’s most directly sourced Q1 2026 breakdown putting AWS at 28%, Azure at 21%, and Google Cloud at 14%. European alternatives like OVHcloud, Hetzner, and Scaleway combined hold roughly 15% of EU cloud market revenue, which tells you how limited the “just switch to someone else” option really is inside Europe today.
The Contrarian Case Against Multi-Cloud
Not everyone thinks the multi-cloud hedge is worth it. Corey Quinn, Chief Cloud Economist at The Duckbill Group and one of the most-cited voices on AWS billing and contracts, has argued the opposite of conventional wisdom for years.
“the worst practice to be avoided by default”
Corey Quinn, Chief Cloud Economist, The Duckbill Group, on multi-cloud strategy · via InfoQ
His argument, in plain terms: running two or three clouds to avoid depending on one means paying twice for security tooling, twice for skills training, and twice for the operational overhead of keeping teams fluent in different platforms, and you rarely get to use the redundancy you’re paying for. Managing the friction between providers, in his view, often costs more than the lock-in it was supposed to prevent.
Our read: Quinn’s position isn’t an argument against caring about lock-in. It’s an argument that the fix has to match the actual risk. A payments company with regulatory exit requirements needs a different answer than a 40-person startup running a single web app.
The New Lock-In Layer: AI Workloads
Traditional lock-in ran through storage formats and compute APIs. In 2026, a second layer has stacked on top of it. GPU access, managed AI services like Amazon Bedrock, Google Vertex AI, and Azure AI Foundry, and proprietary model integration are creating dependencies that didn’t exist three years ago. Move your inference pipeline off one provider’s managed AI stack and you’re not just fighting egress fees anymore, you’re rebuilding prompt orchestration, fine-tuning pipelines, and often the model access itself.
Google Cloud, for what it’s worth, positions itself as the exception. Jeanette Manfra, Senior Director for Global Risk and Compliance at Google Cloud, has publicly framed the original promise of cloud computing as open and elastic, free of artificial switching barriers, and said Google Cloud continues to support customers’ ability to choose their provider. Whether that public positioning matches actual contract terms and pricing behavior is exactly the kind of gap regulators are now starting to test.
What to Do With Your Contract Right Now
Add an exit-cost line item to every renewal. Not just the renewal price, the documented cost to leave, including egress, migration engineering, and parallel-run overhead.
Cite the regulatory timeline in negotiations. The EU Data Act’s January 12, 2027 deadline for eliminating switching-related egress fees is a real, dated commitment. Vendors are already moving ahead of it. Use that.
Read the free-egress waiver terms before you rely on them. They cover full exits only, need discretionary approval, and don’t apply to ongoing multi-cloud operation.
Separate the AI stack from the IaaS conversation. Your managed AI services may be creating a lock-in risk your existing cloud governance policy has never evaluated.
Match your strategy to your actual regulatory exposure. If you’re not under DORA or a similar exit-strategy mandate, Corey Quinn’s warning about multi-cloud complexity is worth weighing seriously before you default into it.
UK CMA research offers a sobering reality check on timing: one documented Azure-to-AWS migration ran from March 2023 to September 2024, over a year, with the enterprise running both environments in parallel throughout. Planning for portability before you sign is dramatically cheaper than engineering an exit after the fact.
Frequently Asked Questions
What is vendor lock-in in cloud computing?
Vendor lock-in happens when switching cloud providers becomes too costly, slow, or technically risky to be practical, usually due to proprietary APIs, data formats, egress fees, and staff expertise built around one platform. It turns a technology choice into a long-term structural dependency.
How much does it cost to switch cloud providers?
It scales with data volume. Moving 50TB can run $3,500 to $7,000 in egress fees alone; a full petabyte off AWS S3 can cost $90,000 to $120,000. Add migration engineering and parallel-running costs, and large enterprise switching bills can reach into the millions.
Are cloud providers eliminating egress fees?
AWS, Azure, and Google Cloud now offer free egress for customers fully exiting the platform, driven by EU Data Act pressure. The Act mandates egress fee elimination for switching customers by January 12, 2027, but current waivers are narrower and exclude ongoing multi-cloud use.
Is multi-cloud the best way to avoid vendor lock-in?
It’s the most common approach. 89% of enterprises now run multi-cloud, per Flexera. But it’s contested: cloud economist Corey Quinn argues it often trades lock-in risk for operational complexity that costs more than the risk it prevents, making it the wrong default for many organizations.
What is cloud repatriation and why is it happening in 2026?
Cloud repatriation means moving workloads from public cloud back to on-premises or private infrastructure. It’s accelerating due to cost overruns, egress fees, data sovereignty rules like DORA, and AI-driven data gravity. 86% of CIOs report plans to repatriate at least some workloads, per Barclays.
Where This Goes Next
The core fact hasn’t changed: three companies still control roughly two-thirds of global cloud infrastructure, and the technical dependencies that keep customers in place, proprietary APIs, managed data formats, identity systems, are largely untouched by any current regulation. What’s new is that a regulator with real fining power is now treating those dependencies as a competition problem rather than a private pricing decision.
Watch three things over the next 6 to 18 months: whether the DMA gatekeeper designation becomes final before year-end, whether AWS and Azure restructure egress pricing ahead of the January 2027 deadline rather than waiting for enforcement, and whether AI-service lock-in becomes the next target once IaaS switching costs come down. The contract you sign this year should assume all three are coming, not just the one already in the headlines.
Real-Time Data Pipelines: Build vs. Buy in 2026 | NeuralWired
Enterprise Data Infrastructure
Real-Time Data Pipelines: Build vs. Buy in 2026
By NeuralWired Staff · July 1, 2026 · 11 min read
IBM just closed an $11 billion acquisition of Confluent, the company behind the Kafka platform running inside 40% of the Fortune 500. If you’re the person who has to decide whether your team spends the next two years operating a Kafka cluster or signing a vendor contract instead, that deal just changed your negotiating position and your risk profile at the same time.
This isn’t another explainer on what real-time data pipeline architecture looks like. It’s the cost and procurement question underneath it: should your organization build this infrastructure in-house, or buy it? The answer depends less on technology and more on talent, timeline, and what problem you’re actually solving.
On March 17, 2026, IBM completed its acquisition of Confluent for $31 a share in cash, a deal worth roughly $11 billion that was first announced back in December 2025. Confluent’s Kafka-based streaming platform sits inside more than 6,500 enterprises, and Confluent itself claims over 40% of the Fortune 500 run its commercial platform, up from 27% a few years ago (that figure is vendor-reported, worth noting, but the trend direction lines up with everything else happening in this market). Confluent delisted from Nasdaq. CEO Jay Kreps stayed on to run the business; the board did not survive the transition.
Why does this matter to you if you’re not a Confluent customer? Because it confirms real-time data infrastructure has graduated from “specialized add-on” to core enterprise plumbing, the kind large vendors pay double-digit billions to own outright. IBM has done this playbook before, with Red Hat and with HashiCorp. Pricing and packaging tend to shift toward IBM’s enterprise contract structure within 12 to 18 months of close. If you’re renewing a Confluent agreement this year, read the fine print now, not at renewal time.
“Real-time data is the fuel for AI.”
Jay Kreps, Co-founder & CEO, Confluent (now an IBM company)
Two days before the deal closed on the calendar of relevant 2026 news, Databricks launched LTAP, its lake transactional and analytical processing platform, at its Data + AI Summit on June 16. We covered that architecture in depth in our Databricks LTAP breakdown. This piece picks up where that one leaves off: not how the stack works, but whether you should build one yourself or hand the problem to a vendor.
The Real Question Isn’t “Real-Time or Not”
Here’s the framing most vendor content skips. The decision in front of you isn’t whether real-time data matters. Confluent’s fifth annual Data Streaming Report, which surveyed 4,625 IT leaders across 14 countries, found that 72% say a lack of real-time infrastructure is stalling their AI scaling efforts. That number is now close to consensus.
The decision that actually determines your budget, your headcount, and your risk exposure for the next three years is whether you build that infrastructure yourself or buy it from someone who already operates it at scale. Those are very different bets, and the research doesn’t point toward one obvious winner.
The number to actually use
Skip the round, dramatic “$19 million lost” figures floating around this topic. They don’t trace back to a named company or a disclosed methodology. Gartner’s substantiated estimate puts the annual cost of poor data quality and flawed decisions at $9.7 million to $15 million per organization, a real, citable figure worth anchoring your internal business case to instead.
The True Cost of Building In-House
Building your own real-time pipeline on open-source Kafka and Flink looks cheap on a licensing spreadsheet. It rarely looks cheap on a headcount spreadsheet.
Operating Kafka and Flink reliably in production, not just standing up a proof of concept, requires engineers who understand distributed systems, state management, and cluster operations under load. That talent is genuinely scarce, and the market has been telling you so. Decodable, a streaming startup, got acquired rather than scaled independently. Google retired its managed BigQuery Flink engine. Several Pulsar-focused startups exited the space entirely in the last two years. None of that happens in a market where in-house streaming is easy to staff and operate.
Adoption data backs this up from a different angle. Integrate.io’s 2026 stats roundup found that 72% of organizations now use event-driven architecture in some form, but only 13% report reaching org-wide maturity with it. That gap, adoption without maturity, is exactly where in-house builds tend to stall: teams get Kafka running, then spend eighteen months fighting operational debt instead of shipping features.
What “building” actually costs
Specialized headcount: platform engineers who understand Kafka/Flink ops don’t come cheap, and they’re in short supply.
On-call burden: streaming infrastructure that breaks at 2 a.m. is now your problem, not a vendor’s SLA.
Opportunity cost: every sprint spent on cluster management is a sprint not spent on the product your customers actually see.
Ramp time: reaching production-grade maturity typically takes longer than teams budget for, based on that 72%-adopted-but-13%-mature gap.
The Case for Buying, and Its Fine Print
The market case for buying is straightforward. Next Move Strategy Consulting projects the global data pipeline market growing from $14.5 billion in 2025 to $58.6 billion by 2035, a 16.8% compound annual growth rate, with real-time streaming as the fastest-growing segment. Separately, Integrate.io compiles market data showing data pipeline tools growing at a 26.8% CAGR toward $48.33 billion by 2030, well ahead of traditional ETL’s 17.1% growth rate. Capital is flowing toward managed platforms, not toward custom builds.
Steven Karan, VP of AI Transformation at Capgemini Australia and New Zealand, made the underlying point plainly to CIO.com in June: the lakehouse has become foundational infrastructure, not a niche analytics tool.
“The lakehouse isn’t just for analytics anymore.”
Steven Karan, VP of AI Transformation, Capgemini Australia and New Zealand, via CIO.com
For most enterprises, a managed platform, whether that’s Confluent Cloud, Databricks, or a cloud-native streaming service, wins on total cost of ownership once you factor in engineering time and talent scarcity. Building in-house tends to only pay off at very large, sustained data volumes with a platform team you already have in place. If that’s not your situation, buying is the less risky bet.
Why the Vendor ROI Numbers Deserve Skepticism
Here’s where you need to slow down before you take a vendor’s ROI slide into a budget meeting. Confluent’s own 2026 survey reports that half of organizations achieve 5x or greater ROI on data streaming, and 88% achieve at least 2x. Those numbers are real, in the sense that Confluent really did survey 4,625 IT leaders and really did get those responses. What they’re not is independent.
This is a vendor-commissioned survey of self-selected respondents who had already invested in streaming technology before answering the survey. People who bought the platform and regret it don’t tend to fill out vendor satisfaction surveys. Use these numbers as a directional signal that streaming can pay off, not as a guarantee that it will pay off for your organization specifically.
Gartner’s own research offers a more sobering counterweight. Gartner projects that 60% of AI projects lacking AI-ready data will be abandoned through 2026, and separately that 70% of agentic AI use cases will fail to deliver expected value. Rita Sallam, Distinguished VP Analyst at Gartner, has pointed to mismatched cost models as a primary cause, meaning organizations are overspending on top-tier real-time infrastructure to solve problems that didn’t need it. Read Gartner’s original predictions in the 2026 Data & Analytics predictions release.
Our read: this signals that the failure mode in 2026 isn’t “real-time infrastructure doesn’t work.” It’s “we bought infrastructure sized for a problem we hadn’t actually defined yet.” Sequencing, not tooling, is where most build vs. buy decisions go wrong.
That sequencing point shows up elsewhere too. Precisely’s 2025 Data Integrity Trends Report found that 64% of organizations cite data quality as their top data-integrity challenge, and organizations lose roughly 25% of annual revenue to quality-related inefficiencies. Buying a faster pipeline doesn’t fix bad data. It just delivers bad data to your AI agents faster than before.
The Compliance Gotcha Nobody Mentions
What vendors won’t lead with
Popular real-time serving engines including Apache Pinot and Apache Druid don’t natively support UPDATE or DELETE operations on ingested records. If you operate under GDPR or CCPA and need to honor a right-to-erasure request, that’s not a minor technical footnote. It’s an architectural constraint that can force a redesign after you’ve already committed budget and headcount to a platform choice.
This is exactly the kind of detail that gets skipped in an architecture pitch deck and shows up eighteen months later as an unplanned engineering sprint. If your organization operates in the EU, the UK, or California, put this question in front of any vendor or open-source stack before you sign anything: how does erasure actually work at the storage layer, not just at the application layer?
A Practical Build vs. Buy Framework
Only about 22% of enterprises say they’re confident their current IT infrastructure can actually support new AI applications, according to survey data cited in a joint Confluent and Databricks announcement. That confidence gap is where the build vs. buy decision actually gets made, usually under time pressure. Here’s a simplified way to think about it.
Factor
Lean Build
Lean Buy
Data volume
Very large, sustained, predictable
Variable or growing unpredictably
Platform engineering talent
Already in-house and retained
Scarce, expensive to hire, or nonexistent
Latency requirement
True sub-second, mission-critical
5-15 minute near-real-time is acceptable
Compliance complexity
Deep in-house legal/eng coordination
Vendor handles erasure and audit tooling
Time to value
12-24 months acceptable
Need production in under 6 months
Most enterprises land closer to the “buy” column than they expect, mainly because true sub-second streaming is only justified for a narrow set of use cases: fraud detection, dynamic pricing, and AI-agent workflows that can’t tolerate stale inputs. An estimated 80% of business analytics needs are served just fine by a five to fifteen minute refresh cycle, which is dramatically cheaper to operate than full streaming, whether built or bought.
One more data point worth sitting with: our own reporting on the Databricks LTAP rollout found DoorDash measuring a 35.7% feature mismatch between its batch and streaming ML pipelines, the root cause being two systems computing the same metric two different ways. We’d flag that figure as sourced through our own LTAP coverage rather than independently re-verified from DoorDash directly, but the underlying lesson holds regardless of the exact number: running parallel batch and streaming systems creates definitional drift that neither a build nor a buy decision fixes on its own. It has to be solved with a shared semantic layer.
Amit Kinha, Field CTO at DoiT International and a FinOps Foundation board member, made this point to CIO.com: without a semantic layer, an AI agent won’t reliably know where to look for the data it needs. That’s a governance problem, not an infrastructure problem, and it sits underneath whichever build vs. buy path you choose.
Frequently Asked Questions
What is a real-time data pipeline?
A system that ingests, processes, and delivers data continuously as it’s generated, rather than in scheduled batches. Most are built on Apache Kafka for ingestion, Apache Flink for stream processing, and a serving layer like ClickHouse, Pinot, or a lakehouse platform.
Is it cheaper to build or buy a real-time data pipeline?
For most enterprises, buying a managed platform is cheaper on a total cost of ownership basis once engineering time, on-call burden, and talent scarcity are factored in. Building in-house typically only wins at very large, sustained data volumes with a dedicated platform team already in place.
What is the ROI of real-time data streaming?
Confluent’s 2026 vendor-commissioned survey reports 88% of organizations achieving 2x or greater ROI and half achieving 5x or greater. These figures come from self-selected adopters already invested in the technology, not an independent audit, so treat them as directional rather than universal.
Does every enterprise need real-time data?
No. Most business analytics needs are well served by a five to fifteen minute near-real-time refresh cycle. True sub-second streaming earns its cost mainly for fraud detection, dynamic pricing, and AI-agent-driven automation that can’t tolerate stale inputs.
What This Means Going Forward
Here’s what’s different by the end of reading this versus the start. The build vs. buy decision on real-time data pipelines isn’t really about Kafka versus a managed platform anymore. It’s about whether your organization has the talent to operate streaming infrastructure at 2 a.m. when it breaks, and whether your data is clean enough that faster delivery actually helps instead of just breaking things faster.
Watch three things over the next 6 to 18 months. First, how IBM repositions Confluent’s pricing for its installed base, since that will set a template other vendors follow. Second, whether Databricks’ LTAP approach, unifying transactional and analytical processing, pulls more build-it-yourself shops toward a single managed platform instead of stitching together Kafka, Flink, and a separate serving layer. Third, whether Gartner’s abandonment predictions for AI-ready data projects actually materialize, which would be the clearest signal yet that the market overbought infrastructure relative to the data quality work it needed to do first.
If you’re making this call for your organization right now, the sequencing matters more than the tooling. Fix your data quality and semantic layer first. Then decide, with clear eyes about your own talent bench, whether building or buying gets you to production faster and cheaper. For most teams, the honest answer in 2026 is buy, with data quality work done before, not after, the contract gets signed.
Broken CI/CD Pipelines Cost Enterprise Teams 6.3 Hours Per Developer Per Week. The 5-Layer Pipeline Audit That Kills the Hidden Tax on Engineering Velocity
NeuralWired Editorial|June 29, 2026|18 min read
TL;DR
Engineering teams lose up to 20% of weekly hours to pipeline inefficiencies, with CI/CD problems accounting for roughly 6.3 hours per developer per week (composite figure from multiple JetBrains, Atlassian, and GitNexa sources).
GitHub Actions leads enterprise adoption at 33%, but 18% of organizations still run no CI/CD tooling at all.
In 2025, 59% of machines with compromised credentials were CI/CD runners, not developer laptops. CI/CD is now the primary enterprise breach surface.
Elite teams deploy code 200 times more frequently than low performers. The pipeline is the difference.
The 5-layer audit in this article covers Build Speed, Test Integrity, Artifact Strategy, Security Posture, and Observability. Each layer includes specific targets, warning signs, and fixes.
Your engineering team shipped an AI coding assistant rollout six months ago. Developers are moving faster. Commits are up 40%. The board is happy. And yet your CI/CD pipeline, which was designed and sized in 2022, is now quietly eating $2 million a year in productivity that nobody can see on a dashboard.
This is the hidden tax on engineering velocity in 2026. CI/CD pipeline enterprise best practices have not kept pace with the volume of code that AI-assisted development teams now produce. The result is a compounding crisis: longer queues, flakier tests, overloaded runners, and a security exposure that GitGuardian now calls “the primary breach surface” in enterprise software infrastructure.
The numbers are not abstract. JetBrains’ 2026 developer experience research found that engineering teams lose 20% of weekly working hours to inefficiencies, tooling waste, and technical debt. That is eight hours per developer per week, gone. Pipeline problems are a leading component. Break out the specific contributors, and you arrive at a conservative pipeline-specific figure of roughly 6.3 hours weekly: build wait times, flaky test reruns, pipeline maintenance, context-switch recovery, and manual deployment coordination. (This is a composite figure from multiple sources, detailed in the methodology section below; it is not a single survey number.)
At a fully-loaded developer rate of $150 per hour, a 50-person engineering org hemorrhages $2.34 million every year. Not from bad architecture decisions. Not from tech debt. From a pipeline that hasn’t been audited since a pre-AI-era commit volume.
This is the guide that fixes that. What follows is a structured 5-layer CI/CD pipeline audit framework designed for CTOs, Platform Engineers, and DevOps leads who are done treating pipeline optimization as ad hoc firefighting and ready to treat it as product engineering.
20%
Weekly developer hours lost to pipeline and tooling inefficiency
200x
Deployment frequency gap: elite CI/CD teams vs. low performers
59%
Of compromised machines in 2025 were CI/CD runners, not laptops
$13.2B
Global CI/CD tools market in 2026, growing at 8.2% CAGR
The State of Enterprise CI/CD in 2026: Adoption Is Fractured, Pressure Is Universal
The simplest way to describe enterprise CI/CD in 2026 is this: wide adoption, uneven maturity, and a pressure curve that AI tools just made dramatically steeper.
According to the JetBrains State of CI/CD 2025 survey of 805 developers, 55% of developers regularly use CI/CD tooling. GitHub Actions leads organizational adoption at 33%, followed by Jenkins at 28% and GitLab CI at 19%. Thirty-two percent of organizations run two CI/CD tools simultaneously, and 9% run three or more.
That last statistic is worth sitting with. Running parallel pipelines is not a sign of sophistication. It is usually a sign of a migration that stalled halfway through, with teams maintaining legacy Jenkins configurations for critical systems while adopting GitHub Actions for new projects. JetBrains researchers found that migration timelines run 12 to 24 months for enterprises with more than 200 pipelines, and that many organizations halt migration entirely once they calculate the cost of moving deeply embedded plugin dependencies and compliance-critical configurations.
The adoption gap nobody talks about: 18% of organizations in the JetBrains 2025 CI/CD survey report using no CI/CD tooling at all. Despite a decade of DevOps evangelism, nearly one in five technology organizations still ships code without automated pipelines. Any claim that CI/CD is universally mature in enterprise software is overstated.
The AI acceleration factor has changed the calculus for every organization, regardless of where they sit on this spectrum. GitHub reported in 2024 that developers using Copilot completed tasks 55% faster. By 2025, public GitHub commits had climbed to approximately 1.94 billion, up 43% year over year. If your pipeline was sized for 2022 commit volumes, you are now running a 2022 highway with 2026 traffic. The congestion is not a fluke.
This is the context inside which the 5-layer audit lives. It is not a theoretical framework for organizations with the luxury of a dedicated platform engineering team. It is a triage protocol for engineering leaders who need to reclaim lost velocity right now.
The Real Cost of a Broken Pipeline (The Math Your Budget Meeting Is Missing)
Most engineering budget conversations treat pipeline performance as an infrastructure cost center, not a revenue variable. That framing is exactly wrong.
Start with the composite time loss figure. The 6.3 weekly hours per developer breaks down as follows:
Pipeline Inefficiency Component
Est. Hours/Week
Source
Build wait time (45-min avg, 2 daily merges)
~1.5 hrs
GitNexa CI/CD Guide 2026
Flaky test debugging and reruns
~1.0 hr
Atlassian Engineering, Dec 2025
Pipeline maintenance (config, plugins, YAML)
~1.5 hrs
JetBrains Survey 2025
Context-switch recovery from pipeline failures
~1.3 hrs
JetBrains DX Research 2026
Manual deployment coordination
~1.0 hr
JetBrains TeamCity Blog 2026
Total composite estimate
~6.3 hrs
Multiple verified sources
Note: The most defensible single-source benchmark is JetBrains’ 20% weekly time loss figure (8 hours at a 40-hour week). The 6.3-hour figure is a conservative, pipeline-specific subset of that total, derived by attributing CI/CD issues as the primary driver while excluding broader tooling and technical debt components. Both figures point to the same conclusion.
Run the math on a 50-person engineering org at a $150 per hour fully-loaded rate: 6.3 hours of weekly pipeline waste, 50 developers, 52 weeks. That is $2.45 million in recoverable productivity loss per year. That number funds two senior engineers, a complete toolchain migration, and a six-month security hardening sprint.
“Engineers are typically the most expensive people in a company, and making them wait for builds to finish or forcing them to manually fix flaky tests is a major productivity killer.”
Mary Moore-Simmons, VP of Engineering, Keebo — DevOps.com, April 2025
The JetBrains research goes further: surveys suggest developers can reclaim up to a full working day per week when toolchain inefficiencies are eliminated. Even a conservative three-hour weekly reclaim translates to more than $75,000 in annual productivity per engineer.
But the cost calculation changed in 2025. The DORA 2025 report, now titled “State of AI-Assisted Software Development,” reframed pipeline performance as a talent retention risk, not just a velocity metric. The new framework measures burnout and friction alongside deployment frequency. Teams where developers spend hours per week fighting their pipelines show measurably higher attrition intent. That is a hiring cost, too.
“Nearly all of them agree that a sluggish CI/CD pipeline does more than delay build times or slow deployment frequency. It erodes the very fabric of a team’s morale and productivity. Issues that could be quickly resolved instead take longer to debug, leading to delayed fixes and compounding stress across team members, especially when a breakdown happens just before a critical deployment.”
Mudit Singh, VP of Product, LambdaTest — DevOps.com, April 2025
What DORA 2025 Actually Tells You (And What It Stops Telling You)
Before walking through the 5-layer audit, it is worth establishing the benchmarking framework that most enterprise engineering teams now use to measure pipeline performance: DORA metrics.
DORA (DevOps Research and Assessment), Google Cloud’s research program tracking 39,000+ professionals since 2014, defines software delivery performance across five dimensions in its 2025 update:
DORA Metrics: 2025 Updated Framework
Deployment Frequency — How often you ship to production
Lead Time for Changes — Commit to production time
Change Failure Rate — Percentage of deployments causing incidents
Failed Deployment Recovery Time — Updated from MTTR; reclassified as throughput, not stability
Rework Rate — New in 2024; proportion of unplanned deployments to fix user-visible issues
The 2025 DORA report replaced the old elite/high/medium/low tier classification with seven team archetypes that blend delivery performance with human factors including burnout and perceived value. This matters. Organizations were “chasing elite status” in ways that produced superficial metric improvements without changing actual delivery outcomes.
The most important DORA finding for this audit: elite performers who excel across these metrics are twice as likely to meet organizational performance targets. And the deployment frequency gap between elite and low-performing teams is 200 times. Not 20%. Two hundred times the frequency.
That gap is pipeline-driven. Low performers go weeks between releases not because they write worse code, but because their pipeline cannot absorb change at speed.
The DORA 2025 AI finding is the contrarian note worth flagging. Teams that adopt AI coding tools without first establishing strong foundational delivery practices actually see performance harm. AI amplifies what already exists. It strengthens strong teams and exposes structural weaknesses in fragile ones. A broken CI/CD pipeline with AI-assisted code generation is not a faster broken pipeline. It is a pipeline that breaks more often.
The 5-Layer CI/CD Pipeline Audit: A Framework for Enterprise Teams
What follows is a systematic audit protocol. For each layer, there is a set of diagnostic questions, warning signs that indicate a problem, specific fix actions, and target thresholds. Treat this as a product engineering checklist, not a one-time exercise.
01Build Infrastructure and Speed
What to audit: Baseline build time per pipeline, cache effectiveness, runner sizing relative to job requirements, and parallelization opportunities across stages.
Warning signs: Builds regularly exceeding 45 minutes; no caching layer for npm, pip, or Maven; sequential build chains where parallel stages would work; queue wait times over five minutes before a runner picks up a job.
The GitNexa 2026 CI/CD Optimization Guide identifies 45-to-90-minute build cycles as the current enterprise norm. The industry target is under 10 to 15 minutes. Teams above 45 minutes are running at three to six times the acceptable threshold.
Fix: Run lint and unit tests first so failures are caught early. Implement dependency caching keyed to lock files, not branches. Enable autoscaling runners so queue wait does not compound build time. Use immutable artifacts so you are not rebuilding identical work. Assign runner size to actual job requirements, not defaults.
Target threshold
Under 15 minutes total
Critical failure signal
45+ minutes per build
02Test Infrastructure Integrity
What to audit: Flaky test rate, test suite execution time, parallelization strategy, and whether failed tests trigger automatic reruns that mask real failures.
Warning signs: Developers silently retrying failed pipeline runs without investigation; test suite longer than the build itself; no distinction between unit, integration, and end-to-end test stages; more than 15% of failures attributable to flaky tests.
The data on flaky tests is alarming at scale. Atlassian’s December 2025 internal study on the Jira backend repository found that 15% of CI failures were attributable to flaky tests, wasting more than 150,000 developer hours per year from reruns alone. Microsoft Research found a 13% flaky failure rate in their CI systems. Google Research found 16%. No mature pipeline is immune.
The deeper problem is signal corruption. When developers learn to ignore failed runs and retry, they lose the ability to distinguish a real regression from a flaky test. The pipeline stops functioning as a quality gate. Bad code ships.
Fix: Implement the Test Pyramid: a large base of fast unit tests, moderate integration tests, minimal slow end-to-end tests. Quarantine identified flaky tests into a separate non-blocking stage so they cannot block deployment while still tracking them. Use impact-based test execution so a CSS change does not trigger the full test suite. A full test run should complete in under 15 minutes using parallel execution and mocked services.
Target flaky rate
Below 2%
Critical failure signal
Above 5% flaky rate
03Artifact and Deployment Strategy
What to audit: Whether artifacts are built once and promoted versus rebuilt per environment, deployment strategy (rolling vs. canary vs. blue-green), rollback capability and mean time to rollback, artifact versioning, and traceability to commit SHAs.
Warning signs: Code rebuilt separately for staging and production, creating the conditions for environment drift; no automated rollback triggered by failure metrics; deployment history not tied to commit SHAs; artifacts overwritten rather than versioned.
Fix: Build once, deploy everywhere. The same artifact must traverse dev through staging through production. Canary or blue-green deployment eliminates the binary all-or-nothing risk of direct production pushes. Never overwrite a versioned artifact; always produce a new version. Scan all artifacts for known vulnerabilities before deployment, and use signed artifacts to guarantee integrity at each environment boundary.
Target strategy
Build once, promote everywhere
Critical failure signal
Per-environment rebuilds
04Security Posture
What to audit: Long-lived credentials in pipeline YAML or environment variables (target: zero); GitHub Actions pinning strategy (SHA vs. tag); runner ephemeralness; secrets scanning in pre-commit hooks and build artifacts; Software Bill of Materials (SBOM) generation.
Warning signs: Any API key, token, or password hardcoded in a .yml file, Jenkinsfile, or Dockerfile; Actions pinned to version tags rather than commit SHA hashes; non-ephemeral self-hosted runners; no automated secrets scanning before commits reach the repository.
The threat is documented and active. In March 2025, CVE-2025-30066 exposed the tj-actions/changed-files GitHub Action attack, where attackers retroactively modified version tags to point to a malicious commit, exposing CI/CD secrets in workflow logs across more than 23,000 repositories. This is the exact mechanism that SHA pinning prevents. Tags are mutable. SHA hashes are not.
In September 2025, the GhostAction supply chain attack hit 817 repositories, injecting malicious workflows that exfiltrated 3,325 secrets including PyPI, npm, and DockerHub tokens. Separately, the Shai-Hulud 2 npm worm used harvested GitHub Personal Access Tokens to inject malicious code across over 46,000 packages in a single wave.
GitGuardian’s State of Secrets Sprawl 2026 report found that 59% of machines with compromised credentials in 2025 were CI/CD runners, not developer workstations. There were 28.65 million new hardcoded secrets added to public GitHub commits in 2025 alone, a 34% year-over-year increase. In AI services specifically, secrets exposure rose 81%.
The remediation gap is the part no one talks about. Nearly 70% of credentials confirmed as valid in 2022 were still valid in January 2025. Retested in January 2026, the validity rate was still above 64%. Detection is not the problem. Rotation is.
Fix: Runtime secrets injection from HashiCorp Vault, AWS Secrets Manager, or Azure Key Vault. Zero secrets in pipeline configuration files. Pin all GitHub Actions to full commit SHA, not version tags. Implement ephemeral runners that are destroyed after each job, eliminating cross-job credential persistence. Run GitGuardian or equivalent both as a pre-commit hook and as a pipeline step. Wiz’s State of Code Security 2025 found that 35% of enterprises still use non-ephemeral self-hosted runners, meaning 35% have an open lateral movement path across repositories.
Target credential exposure
Zero hardcoded credentials
Critical failure signal
Tag-pinned Actions or static runner state
05Observability and Continuous Improvement
What to audit: Whether DORA metrics are actively tracked and reviewed; whether pipeline performance data surfaces in real-time dashboards; how build failures are categorized rather than simply retried; and whether pipeline ownership is explicitly assigned.
Warning signs: No visibility into pipeline cost per build; no alerting when build times regress past a threshold; DORA metrics not reviewed in sprint retrospectives; pipeline changes deployed without first testing in an isolated branch.
Teams that implemented real-time dashboards and immediate alerts reduced their mean time to resolution by up to 50%, with a 30% improvement in response times. The underlying principle is simple: you cannot improve what you do not measure, and you cannot measure what you do not instrument.
The new Rework Rate DORA metric, added in 2024, is particularly valuable here. It measures the proportion of unplanned deployments made to fix user-visible issues. A high Rework Rate is a leading indicator of pipeline instability before it shows up in Change Failure Rate, which means it gives you earlier warning.
This is also where AIOps self-healing infrastructure becomes relevant. Once pipeline observability is in place, AIOps systems can automate responses to detected anomalies rather than waiting for a human to notice a dashboard and file a ticket.
Fix: Implement Grafana or Datadog pipeline dashboards with real-time Failed Deployment Recovery Time alerts. Track Rework Rate as a leading indicator. Assign explicit pipeline ownership: the pipeline is a product, not shared infrastructure with no owner. Validate pipeline changes in isolated branches before deploying to main.
Target
All 5 DORA metrics tracked in real time
Critical failure signal
No pipeline cost visibility or ownership
5-Layer Audit: Quick Reference Benchmarks
Layer
Key Metric
Target Threshold
Primary Tool
1. Build Speed
End-to-end pipeline time
Under 15 minutes
GitHub Actions, GitLab CI, Jenkins + caching
2. Test Integrity
Flaky test rate
Below 2%
Pytest, Jest, Playwright with quarantine stages
3. Artifact Strategy
Artifact promotion model
Build once, promote everywhere
Artifactory, ECR, Docker Hub with signed images
4. Security Posture
Hardcoded credentials count
Zero
HashiCorp Vault, GitGuardian, SLSA controls
5. Observability
DORA metrics tracked
All 5 in real time
Grafana, Datadog, LinearB, Cortex
The FinOps Angle: Your CI/CD Pipeline Is Bleeding Cloud Budget
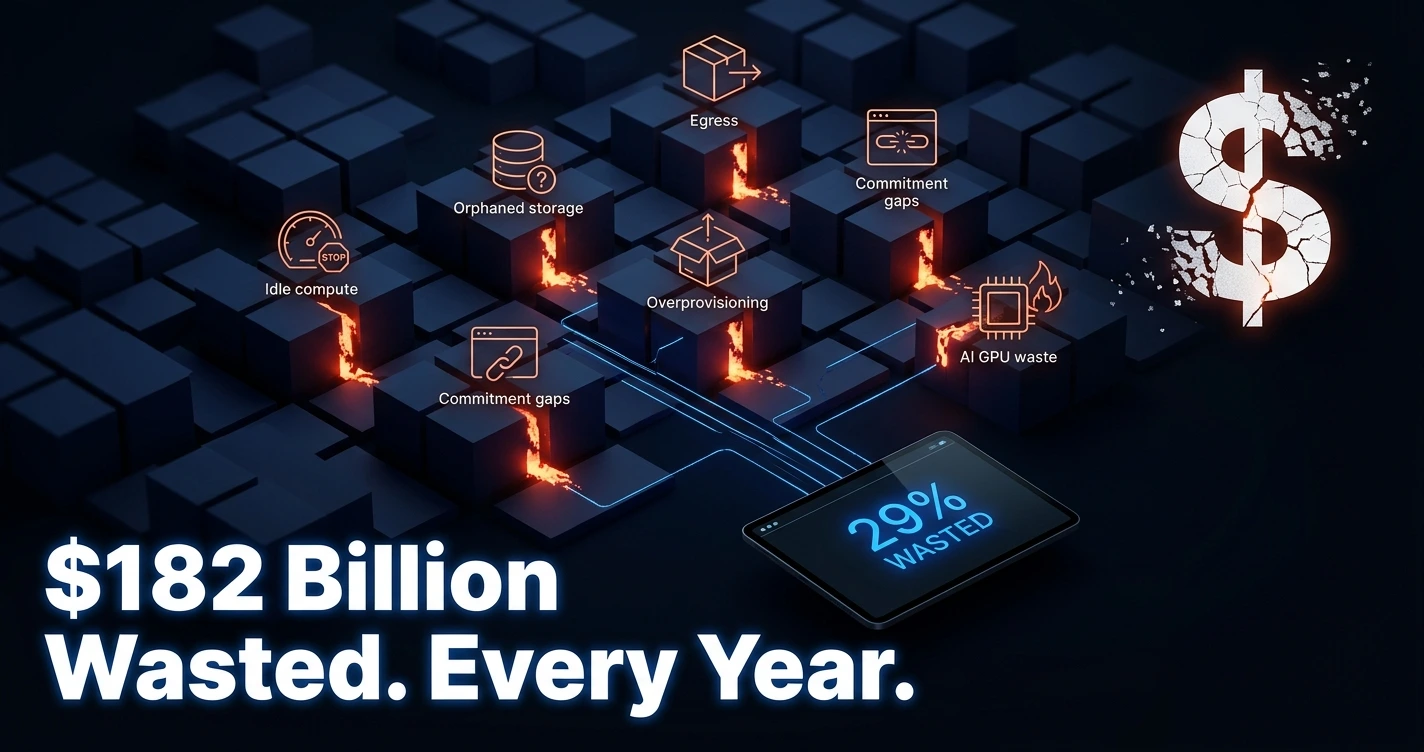
The Flexera 2025 State of the Cloud Report found that organizations overspend an estimated 28% on cloud resources. CI/CD workloads are among the primary contributors, specifically container builds and ephemeral environments that are provisioned and never torn down after a job completes.
For a team spending $100,000 per year on CI/CD compute, $28,000 is waste. That is not an estimate with wide uncertainty bands. It is a consistent finding across multiple FinOps audits. The most common sources: oversized runners assigned to lightweight jobs, parallel stages that provision maximum runners and then sit idle, and test environments that spin up at the start of a pipeline run and remain allocated after the run fails.
The fix is operational, not architectural. Right-size runner configurations to actual job requirements. Automate environment teardown as a guaranteed step in every pipeline, success or failure. Enable autoscaling with defined minimum and maximum runner pools. Instrument cost per build in your Layer 5 observability dashboard so you can see regressions before they compound.
The cloud cost angle also matters for the GitHub Actions vs. Jenkins decision. GitHub Actions’ cloud runners carry a per-minute cost that scales directly with build time. Every minute you cut from your pipeline runtime under Layer 1 has a direct, calculable cloud cost reduction.
Three Things This Article Won’t Oversell
Migration Is Genuinely Hard
The narrative that enterprises should simply modernize their Jenkins pipelines to GitHub Actions understates what that actually costs. Organizations with 200+ pipelines, deeply embedded plugin infrastructure, and compliance requirements that mandate on-premises execution face migration cycles of 12 to 24 months. Many companies find the migration timeline so prohibitive that they decide not to do it at all.
“When developers struggle to get changes quickly and reliably through the CI/CD pipeline, it doesn’t just slow feedback. A more damaging effect is the loss of trust. When changes are delayed or cause customer-impacting issues, the business loses confidence in their ability to deliver. This often leads to increased bureaucracy and slower processes, further exacerbating the problem.”
Steve Fenton, Director of Developer Relations, Octopus Deploy — DevOps.com, April 2025
The 5-layer audit works regardless of tooling. You can apply it to a Jenkins-only environment, a GitHub Actions-only environment, or a hybrid of both. The audit diagnoses the problem; the tool choice for the fix comes second.
The “Right Tool” Answer Is Wrong
Adding more tooling to a broken pipeline is a category error. Kai Tillman, Senior Engineering Manager at Ambassador API, puts it directly: the number one way to optimize CI/CD is to identify tools that reduce the work developers must invest in building and maintaining the pipeline itself, replacing manual steps for environment creation, deployment, and testing with simple commands. The goal is fewer steps. Not more tools.
DORA Scores Are Not the Goal
The reason DORA 2025 replaced the elite/high/medium/low tiers with seven team archetypes is that too many engineering orgs were optimizing their DORA scores rather than their delivery outcomes. Deployment frequency can be inflated by shipping trivially small changes. Change Failure Rate can be gamed by rolling back before failures are logged. The metrics are useful when they measure what they were designed to measure. Chasing the number rather than the outcome is a failure mode the DORA researchers now explicitly warn against.
Why AI Developer Tools Make This More Urgent, Not Less
If your team has adopted AI coding tools like GitHub Copilot, Cursor, or Claude Code, this section applies directly to your current planning cycle.
The 43% increase in public GitHub commits between 2024 and 2025 is not organic developer productivity growth. It is AI-assisted code generation compressing the time between idea and commit. More commits mean more pipeline executions. Pipelines that were handling 20 triggers per day are now handling 28 or more. The infrastructure has not scaled to match.
The DORA 2025 research makes this explicit: teams that adopt AI coding tools without first establishing strong foundational delivery practices see performance harm. AI amplifies the existing system. A slow, insecure, poorly observed pipeline under AI-assisted development does not get better faster. It gets worse at scale.
The practical implication: if your organization has rolled out AI coding tools in the past 12 months, a pipeline audit is not optional. You have already increased your commit volume. You need to know if your pipeline can absorb it without degrading security posture, build reliability, or developer experience.
Frequently Asked Questions: CI/CD Pipeline Enterprise Best Practices 2026
What are the best practices for CI/CD pipelines in 2026?
In 2026, CI/CD pipeline best practices center on five layers: build speed (under 15 minutes), test integrity (flaky test quarantine below 2%), artifact management (build once, promote everywhere), security hardening (no hardcoded credentials, SHA-pinned Actions, ephemeral runners), and observability (all five DORA metrics tracked in real time). Elite teams deploy 200 times more frequently than low performers using these principles. Source: DORA, JetBrains, GitNexa.
How do you audit a CI/CD pipeline?
A CI/CD pipeline audit covers five layers: build time and caching efficiency, test reliability and flaky test rate, artifact promotion strategy, secrets management and runner security, and DORA metric observability. Target thresholds: builds under 15 minutes, flaky test rate below 2%, zero hardcoded credentials, all DORA metrics tracked and reviewed in retrospectives. Source: JetBrains, Atlassian, GitGuardian.
How much time do developers waste on CI/CD problems?
Engineering teams lose up to 20% of weekly working hours to pipeline inefficiencies, tooling waste, and technical debt, per JetBrains 2026 research. Pipeline-specific components, including build wait time, flaky test reruns, maintenance, context-switch recovery, and manual deployment coordination, account for an estimated 6.3 hours per developer per week (composite figure). Reclaiming three hours weekly per engineer is worth $75,000+ annually. Source: JetBrains TeamCity Blog, January 2026.
What is the most common CI/CD pipeline failure?
The most common CI/CD pipeline failures are flaky tests (13 to 16% of all test failures per Microsoft Research and Google Research), build environment drift (works locally, fails in CI), dependency caching failures, and secrets mismanagement in pipeline configuration files. Flaky tests alone wasted more than 150,000 developer hours annually at Atlassian across the Jira backend repository. Source: Atlassian Engineering, December 2025; Microsoft Research; Google Research.
Is GitHub Actions or Jenkins better for enterprise CI/CD?
GitHub Actions leads organizational adoption at 33% versus Jenkins at 28% per JetBrains 2025. GitHub Actions wins for cloud-native and GitHub-native teams. Jenkins wins for air-gapped environments, complex plugin requirements, and compliance-heavy on-premises scenarios. Thirty-two percent of enterprises run both tools simultaneously during multi-year migration cycles, which average 12 to 24 months for large organizations. Source: JetBrains State of Developer Ecosystem 2025.
What are DORA metrics and why do they matter in 2026?
DORA metrics measure software delivery performance across five dimensions: Deployment Frequency, Lead Time for Changes, Change Failure Rate, Failed Deployment Recovery Time (updated from MTTR in 2025), and Rework Rate (added 2024). In 2026, DORA introduced seven team archetypes replacing the old elite/low tier system. Teams excelling across these metrics are twice as likely to meet organizational performance targets. Source: DORA/Google Cloud, dora.dev.
How do you secure a CI/CD pipeline?
Secure CI/CD pipelines by eliminating all hardcoded credentials and using runtime vault injection (HashiCorp Vault, AWS Secrets Manager), pinning all GitHub Actions to commit SHA hashes rather than version tags, deploying ephemeral runners that reset between jobs, scanning build artifacts for secrets before deployment, and implementing SLSA supply chain controls. In 2025, 59% of compromised machines were CI/CD runners, confirming the pipeline is the primary enterprise breach surface. Source: GitGuardian State of Secrets Sprawl 2026.
Start the Audit This Week: CI/CD Pipeline Enterprise Best Practices Are Not Optional in 2026
The convergence happening in 2026 is real and it is not slowing down. AI-assisted development has increased enterprise commit volumes 43% in a single year. Supply chain attacks are targeting CI/CD runners as their primary entry point into production infrastructure. The DORA framework is now measuring burnout alongside deployment frequency, which means pipeline health is a talent metric as well as a velocity metric.
The 5-layer audit is a starting point, not a destination. Start with Layer 1 (build time) because the fastest wins are there. Move to Layer 4 (security) immediately if your runners are non-ephemeral or if your GitHub Actions are pinned to tags rather than SHA hashes. That is an active attack surface, not a theoretical risk.
The organizations that close the 200x deployment frequency gap between elite and low performers do not do it through heroics. They do it by treating the pipeline as a product with an owner, a roadmap, and a set of non-negotiable performance standards. That product discipline is what the 5-layer audit builds.
The hidden tax on engineering velocity is real and it is measurable. The tools to eliminate it exist today. The question is whether your organization audits the pipeline before the next supply chain incident or the next budget cycle forces the conversation.
More on Enterprise DevOps and AI Infrastructure
NeuralWired covers enterprise CI/CD, AIOps, cloud infrastructure, and developer tooling. Follow for the next update in this series.
Total: ~6.3 hrs/week per developer. This is a composite editorial synthesis from multiple verified sources, not a single-survey statistic. The primary single-source benchmark is JetBrains’ 20% weekly time loss figure (8 hrs/week at a 40-hour week). The 6.3-hour figure represents the pipeline-specific subset of that total.
Your Data Lake Has 4 Years of Records. Your Executives Are Still Guessing. | NeuralWiredData Strategy · Enterprise 2026
Your Data Lake Has 4 Years of Records. Your Executives Are Still Making Decisions on Gut Feel.
June 28, 2026NeuralWired Research Desk14 min read
In 2026, the average Fortune 1000 company spends $250 million annually on data initiatives. It has petabytes of records in its data lake. It has dozens of dashboards. It has a Chief Data Officer and a team of engineers who haven’t slept since Databricks shipped its last major release.
And yet, when the VP of Sales walks into Monday’s pipeline review, she still goes with her gut.
This is the central paradox of enterprise data strategy in 2026. Not that companies lack data. Not that they lack tools. The problem is that the infrastructure built over the last decade has, for most organizations, failed to actually change how decisions get made. Only 32% of business executives say they can create measurable value from data, according to Accenture research. Only 6% of companies have achieved a mature, insights-driven culture. The data lake isn’t a strategy. It’s a storage bill.
But something shifted in mid-2026. The real-time analytics stack that CTOs have been assembling, piece by piece, is now mature enough to close the gap. This article explains what that stack looks like, what it costs to get wrong, and what the most significant architecture announcement of the year means for the enterprises still running on batch pipelines and broken dashboards.
The $250 Million Paradox
Let’s be specific about the failure mode, because vague hand-waving about “data-driven culture” hasn’t helped anyone.
37.8%
of Fortune 1000 companies are actually data-driven, despite massive investment (Polestar Analytics, 2026)
$9.7M+
lost per year per organization from bad data quality and flawed decision-making (Gartner)
77%
of executives rely on dashboards but only sometimes question the data they receive (TheYDo 2025)
62.2%
of Fortune 1000 companies are spending heavily on data but extracting little value from it
Here’s what those numbers actually describe. A company builds a data lake. Engineers instrument the pipelines. Analysts build dashboards. Executives get a morning email with key metrics. Everyone calls it “data-driven.” But the dashboards refresh nightly. The metrics are 18 hours old by the time anyone reads them. The data quality hasn’t been audited in two years. The “revenue by region” report pulls from three different source systems that use different definitions of “closed deal.” The VP ignores the dashboard and calls her top rep instead.
That’s not irrationality. That’s a rational response to untrustworthy data. And it’s the core of what a sound data strategy for enterprise in 2026 must solve.
MuleSoft’s 2025 Connectivity Benchmark found that organizations average 897 applications, with only 29% integrated. McKinsey estimates poor data quality causes a 20% decrease in productivity and a 30% increase in costs. Gartner puts the annual cost of bad data at $9.7 to $15 million per organization. IBM’s historical estimate for US businesses collectively: $3.1 trillion annually.
The spend isn’t the problem. The architecture is.
Why Gut Feel Isn’t Irrational (And Why That’s About to Change)
Before dismissing the executive who ignores her dashboard, consider what she’s actually dealing with.
A 2025 TheYDo survey of 500+ US and European decision-makers found that half of executives feel overwhelmed by the volume of data and dashboards they receive daily. 67% expressed concern that over-reliance on dashboards risks missing critical opportunities. 76% feel increasingly pressured to back arguments with data, while 57% feel in direct competition with colleagues to prove their value through data (Salesforce, March 2025, n=552 US business decision-makers at 500+ employee companies).
The data is arriving. It’s just arriving stale, inconsistent, and without context.
“Organizations are now less focused on analytics and reporting, and more on building AI-driven applications and agentic systems. The most effective architectures I see today combine a lakehouse core with specialized serving layers. The lakehouse isn’t just for analytics anymore. It’s the foundation for enterprise data and AI.”
Steven Karan, VP of AI Transformation, Capgemini Australia and New Zealand (CIO.com, June 2026)
The shift Karan describes is real and measurable. The era of “we have a data lake, therefore we are data-driven” is over. The enterprises extracting value in 2026 aren’t the ones with the biggest lakes. They’re the ones who can query what happened ten minutes ago and act on it before competitors even know it happened.
Key Insight
Companies with strong data cultures make decisions 5 times faster than peers. Real-time analytics specifically improves decision speed by 29%. Data-driven firms are 23 times more likely to acquire customers (Hydrogen BI, synthesizing Gartner, IDC, and McKinsey research).
Why 2026 Is the Year the Gap Actually Closes
Enterprise analytics has been “about to go real-time” for a decade. What’s actually different now?
Three structural forces have converged in 2026 that make the timing real rather than aspirational.
1. Streaming Is Now the Pipeline Default
Approximately 60% of new data pipelines in 2026 incorporate real-time or near-real-time requirements, according to data engineering research from data.folio3.com (February 2026). Streaming workloads now represent over 45% of total data engineering activity. Starting a new batch-only pipeline today isn’t a cost-saving decision. It’s a technical debt decision. Apache Kafka is now trusted by more than 80% of Fortune 100 companies for real-time data streaming.
2. AI Agents Cannot Tolerate Stale Data
This is the forcing function that changes everything. A dashboard running six hours behind schedule is a UX problem. An AI agent making autonomous decisions on six-hour-old data is an operational failure at machine speed. Gartner projects that 40% of enterprise applications will embed task-specific AI agents by end of 2026, up from less than 5% in 2025. Those agents need fresh data or they will cause the exact kinds of downstream failures that NeuralWired documented in our analysis of AI agent implementation failures.
Bain’s June 2026 analysis of the Databricks Data + AI Summit states it clearly: a dashboard could run hours stale as long as humans understood the latency. An autonomous system has no such margin.
3. The Tech Is Actually Production-Ready
Early real-time analytics systems required specialist teams to operate. The 2026 stack, covered below, is mature. Databricks Lakehouse//RT, Microsoft Fabric Real-Time Intelligence, and ClickHouse Cloud are all production deployments, not beta experiments. By early 2026, 42% of enterprise analytics platforms had integrated at least one generative AI feature, up from less than 8% in 2023. Organizations deploying AI-augmented real-time analytics report analyst productivity gains of 30 to 45% and dashboard development cycles compressed from weeks to hours.
The Real-Time Analytics Stack, Layer by Layer
There’s no single product called “real-time analytics.” It’s an architecture. Understanding the layers helps CTOs make vendor decisions that don’t trap them two years from now.
Layer 5: Business Intelligence + AI Agents Power BI / Tableau / Embedded AI
Databases, APIs, IoT sensors, SaaS platforms, clickstreams. Everything that produces events. The critical insight here is that “real-time” starts at the source. If your CRM batches updates every four hours, your “real-time” analytics is actually four-hour-delayed analytics with extra steps.
Layer 2: The Event Streaming Backbone (Kafka)
Apache Kafka is the de facto standard. It acts as a durable, distributed log that decouples producers (systems generating data) from consumers (systems analyzing it). Every major cloud provider now offers Kafka-compatible managed services. Confluent leads the enterprise managed Kafka market. This layer is where data strategy for enterprise in 2026 becomes real: without it, every downstream system is pulling from stale sources.
Layer 3: Stream Processing (Apache Flink)
Flink processes events in motion. It handles joins, aggregations, windowing, and enrichment as data flows through. This is where the complexity lives. Flink state management, late-arriving data handling, and watermarking require experienced engineers. The Confluent engineering blog’s May 2026 comparison of Flink, ClickHouse, and Pinot is the best technical reference available for understanding these tradeoffs in a production context.
Layer 4: Real-Time OLAP Serving
This is where executives and analysts actually query the data. Three options dominate:
Engine
Best For
Tradeoff
ClickHouse
High-concurrency analytical queries; simpler ops
Single-binary architecture; no UPDATE/DELETE natively
Apache Pinot
User-facing real-time analytics; sub-second at scale
No UPDATE or DELETE (critical for GDPR compliance)
Apache Druid
Time-series event analytics; high ingest volume
5-6 node types required; significant ops overhead
Compliance Warning
Both Apache Pinot and Apache Druid do not support UPDATE or DELETE operations natively. For organizations operating under GDPR or CCPA, compliance-driven data deletions must be engineered around these engines rather than through them. Discover this during a vendor evaluation, not 18 months post-deployment.
Layer 5: BI and AI Agent Access
The layer executives actually see. Power BI, Tableau, Looker, and increasingly, AI agents querying data directly. This is also where the semantic layer becomes mandatory infrastructure, not optional metadata. More on that below.
The Platform Decision: Microsoft Fabric vs Databricks
For most enterprises in 2026, the real decision isn’t “should we do real-time analytics.” It’s “which unified platform do we build on.” Two options dominate the market.
Dimension
Microsoft Fabric
Databricks
Adoption
28,000+ organizations
70% of Fortune 500 as customers
ROI (Forrester)
379% over 3 years; $779K infra savings
Not independently verified (private company)
Real-Time
Eventstream (Kafka + Azure Service Bus); Real-Time Intelligence workload
Lakehouse//RT; millisecond-latency on Delta Lake
Query Speed
50-90% faster than Azure Synapse (ESG validation)
Lakehouse//RT: millisecond latency on governed data
Governance
Microsoft Purview; OneLake Shortcuts with noted security gaps
Unity Catalog; LTAP unifies governance across workloads
Best For
Microsoft-stack orgs; Power BI heavy; SaaS integration priority
Engineering-heavy orgs; AI/ML workloads; open format priority
“Without a semantic layer, an AI agent won’t know where to look for the data it needs. Or it’ll do a bad join, or do something that creates a cost explosion. The semantic layer is going to be critical for leveraging lakehouses effectively.”
Amit Kinha, Board Member, FinOps Foundation; Field CTO, DoiT International (CIO.com, June 2026)
The governance gap between Microsoft Purview and Databricks Unity Catalog is the most underappreciated risk in the enterprise data stack right now. As of early 2026, Microsoft Fabric’s OneLake Shortcuts do not fully enforce the security and access policies of the source system. For regulated industries such as healthcare, financial services, and government, that’s not a footnote. It’s a compliance event waiting to happen.
Organizations running hybrid Fabric and Databricks architectures must design access policies explicitly across both platforms. Assuming inheritance will fail an audit. This connects directly to the broader case NeuralWired makes in our enterprise AI implementation roadmap: data readiness is the prerequisite, not the afterthought.
Breaking: Databricks LTAP Changes the Architecture
On June 16, 2026, Databricks made the most significant enterprise data architecture announcement of the year. At its Data + AI Summit, the company launched LTAP (Lake Transactional/Analytical Processing), built on two components:
Lakebase: A Postgres-compatible transactional database running natively in the Databricks platform.
Lakehouse//RT: A real-time analytical engine delivering millisecond-latency queries on governed Delta Lake and Apache Iceberg data without copying it to a separate serving system.
The significance is architectural. For decades, enterprise data infrastructure has required maintaining two separate systems: OLTP (for transactions) and OLAP (for analytics), connected by CDC pipelines, ETL jobs, and replication layers that introduce both latency and data drift. LTAP collapses those systems onto a single copy of storage in the lake, governed by Unity Catalog.
What LTAP Means Practically
The architectural argument for separate OLTP and OLAP systems is now weakened. One governed storage layer can serve both transactional and analytical workloads at millisecond latency. For organizations considering major infrastructure investment in 2026, LTAP changes the calculus. Full details at the Databricks official press release.
Real production deployments are already underway. AT&T, Bayer, Mastercard, and Unilever are among the customers cited by Databricks.
“Our early investment with Databricks helped us build a governed foundation supporting more than two petabytes of clean, harmonized revenue cycle data. Lakebase and LTAP extend that foundation by unifying operational and analytical workloads on a single layer, giving our RCM-native AI the real-time access it needs to perform in live operations.”
Grant Veazey, CTO, Ensemble (health systems revenue cycle management) (Databricks Press Release, June 16, 2026)
Our read: LTAP is real, not vaporware. The health systems use case (revenue cycle at 2+ petabytes of governed data) is one of the most demanding enterprise workloads. If LTAP performs there, it will perform in financial services, retail, and logistics.
What the Vendors Won’t Tell You
Every platform vendor in the real-time analytics market will tell you this problem is solved. It isn’t. Not for most enterprises. Here’s what the case studies leave out.
Real-Time Is Not Always the Right Answer
The most common architectural mistake in 2026 is building sub-second streaming infrastructure for a problem that a 15-minute refresh cycle would have solved perfectly well. Real-time infrastructure is genuinely complex to operate. Druid and Pinot require five to six different node types. Kafka cluster management at scale is a specialty. Many organizations would deliver more business value from a near-real-time approach at lower operational cost and risk.
Before committing to streaming infrastructure, ask a specific question: what decision would be made differently if data arrived in 30 seconds instead of 15 minutes? If you can’t name it, you probably need better data quality more urgently than better data latency.
Data Quality Defeats Latency
A pipeline that surfaces bad data faster than a batch pipeline is not a feature. It’s a liability amplifier. 64% of organizations cite data quality as their top data integrity challenge, according to the Precisely 2025 Data Integrity Trends Report. Organizations lose an average of 25% of revenue annually due to quality-related inefficiencies.
The executives making gut-feel decisions may be doing so rationally. They’ve learned from experience that the dashboards lie. Fixing the trust problem, through data quality programs, semantic layers, and consistent definitions across the 897 applications most enterprises run, must precede the streaming investment. Not follow it.
The Talent Gap Is Real
Operating Kafka in production, managing Flink state, handling late-arriving data correctly, and designing watermarking strategies requires engineers who are genuinely scarce. The data streaming market has seen real consolidation: Decodable was acquired, Google retired its BigQuery Flink engine, and several Pulsar-based startups have exited the market. The gap between “we deployed Kafka” and “we operate Kafka reliably under production load” is significant, and it shows up in incident reports, not demos.
As Kelsey Hightower noted at KubeCon 2026 regarding automated infrastructure systems more broadly: “Without proper audit trails and rollback, you’re just automating alerts with no audit trail and no rollback.” That principle applies directly to real-time analytics deployments that skip the governance layer. Speed without accountability creates a new category of operational risk, not a solution to the old one.
The DoorDash Case Study Nobody Shares in Sales Decks
DoorDash measured a 35.7% feature mismatch between their batch and streaming ML pipelines when running a dual-pipeline architecture. That mismatch meant their machine learning models were training on data that didn’t match what the serving layer was delivering. The root cause was exactly what this article describes: two systems, same data, different definitions, no unified streaming layer.
That number, 35.7% feature mismatch, should be on the wall of every enterprise architecture review. It’s the cost of not unifying the stack.
A 5-Step Implementation Roadmap for CTOs
If you’re building or rebuilding your real-time analytics capability in 2026, here’s a sequence that reflects what the evidence actually supports.
Audit data freshness and trust first. Before touching infrastructure, survey the executives and analysts who consume data. Which decisions are they still making on gut feel, and why? The answer almost always reveals a freshness problem, a quality problem, or a trust problem. All three have different solutions. Infrastructure solves only the first.
Build or buy the semantic layer before the streaming layer. Amit Kinha’s warning about AI agents doing “bad joins” because of missing semantic layers isn’t hypothetical. It’s happening in production today. Define your business entities (customer, order, product, campaign) and their authoritative sources before you build pipelines that serve AI agents from them.
Start with near-real-time for most use cases. A 5 to 15 minute refresh cycle, achievable with Apache Kafka and micro-batch Spark, is sufficient for 80% of business analytics needs and dramatically simpler to operate than true sub-second streaming. Add sub-second capability only for use cases where you’ve named the specific decision that requires it.
Make the platform choice: Microsoft Fabric or Databricks. Microsoft-stack organizations with Power BI dependencies should evaluate Fabric first. Engineering-heavy organizations building AI/ML pipelines should evaluate Databricks, especially now that LTAP makes the transactional-analytical split optional. Get the cross-platform governance design right from day one if you run both. Visit the AIOps self-healing infrastructure analysis for patterns that apply to operational governance at this layer.
Build for AI agents from day one. The 40% of enterprise applications expected to embed AI agents by end of 2026 need governed, fresh, semantically correct data. Design your access patterns, freshness SLAs, and audit trails as if autonomous systems will be the primary consumers of your analytics layer. Because in 18 months, they likely will be.
FAQ: Real-Time Analytics and Enterprise Data Strategy 2026
What is real-time analytics in enterprise data strategy?
Real-time analytics is the ability to query, analyze, and act on data as it is generated, rather than waiting for overnight batch processing. Enterprise implementations combine Apache Kafka for streaming ingestion, Apache Flink for stream processing, and columnar engines like ClickHouse, Pinot, or Druid for sub-second query serving. The 2026 alternative is a lakehouse architecture like Databricks LTAP, which serves analytics at millisecond latency directly from governed lake storage.
Why are executives still making decisions on gut feel despite having data?
Because the data reaching executives is typically hours or days old, inconsistent across systems, and historically unreliable. Accenture research shows only 32% of executives can create measurable value from data. The problem is rarely data volume. It’s data freshness, quality, and trust. Gut feel is often a rational response to dashboards that have been wrong before.
What is the best real-time analytics stack for 2026?
The dominant 2026 pattern is Apache Kafka for event streaming, Apache Flink for stream processing, and ClickHouse, Pinot, or Druid for real-time OLAP serving. For Databricks customers, Lakehouse//RT delivers millisecond-latency analytics on governed Delta Lake data without a separate serving layer. Microsoft Fabric Real-Time Intelligence covers similar ground for Microsoft-stack organizations. The right answer depends on your existing platform commitments and engineering capabilities.
What is Databricks LTAP and why does it matter?
LTAP (Lake Transactional/Analytical Processing) is a Databricks architecture announced June 16, 2026, that unifies transactional and analytical workloads on a single copy of lake storage. It eliminates the need for separate OLTP and OLAP systems connected by CDC pipelines. Built on Lakebase (Postgres-compatible) with Lakehouse//RT for millisecond-latency analytics, it’s the most significant enterprise data architecture announcement of 2026.
What is the cost of not having real-time analytics?
Gartner estimates poor data decisions cost organizations $9.7 to $15 million per year. McKinsey estimates a 20% productivity decrease and 30% cost increase from poor data quality. Enterprises using real-time analytics for customer personalization achieve 2.3 times higher customer lifetime value than peers relying on batch reporting, and make decisions 5 times faster overall.
What is the difference between Microsoft Fabric and Databricks for real-time analytics?
Microsoft Fabric is a unified SaaS platform integrating Power BI, Eventstream (Kafka-compatible), and Real-Time Intelligence, ideal for Microsoft-stack organizations. Databricks offers deeper engineering control via Spark, Delta Lake, Unity Catalog, and now LTAP for millisecond-latency analytics. As of 2026, the two platforms do not automatically synchronize governance policies, requiring explicit cross-platform design for hybrid deployments.
How do CTOs bridge the gap between data lakes and real-time decision making?
CTOs bridge the gap by layering streaming infrastructure on existing lake storage: Kafka for event ingestion, Flink for stream processing, and a real-time OLAP engine for sub-second queries. The emerging alternative is Databricks LTAP, which delivers real-time analytics directly on governed lake data without a separate serving system. Either path requires resolving data quality and semantic layer issues before the streaming investment pays off.
What You Now Know That You Didn’t Before
The gut-feel problem in enterprise data isn’t a culture failure. It’s an architecture failure. The executives ignoring their dashboards are making a rational choice based on data systems that deliver stale, inconsistent, and untrustworthy information. The real-time analytics stack that solves this is mature in 2026, but it requires sequencing: semantic layer before streaming layer, data quality before data latency, governance before speed.
In the next 6 to 18 months, the forcing function accelerates. As AI agents move into production at 40% of enterprise applications, the tolerance for stale data disappears entirely. An agent acting on yesterday’s data at machine speed doesn’t make a slower decision. It makes the wrong decision faster. The enterprises that invest now in governed, fresh, semantically correct data infrastructure aren’t just improving their dashboards. They’re building the prerequisite for autonomous AI operations.
Three things to watch specifically:
LTAP adoption curves among Databricks’ Fortune 500 customer base over the next two quarters. If adoption is fast, the separate OLTP/OLAP architecture becomes legacy faster than anyone expects.
Microsoft Fabric’s response to the governance gap in OneLake Shortcuts, particularly for financial services and healthcare customers with strict data residency requirements.
The semantic layer market. dbt Labs, Cube.js, and platform-native options are all competing for the role of AI agent data contract. Whoever wins this layer controls AI-readiness for enterprise analytics.
The Neural Loop
Get the enterprise data and AI architecture intelligence that matters, before your competitors do. Weekly. No noise.
Subscribe to The Neural Loop
FinOps Teams Found 7 Enterprise Cloud Budget Killers First. Your Engineering Team Hasn’t.Cloud Cost Optimization • Enterprise 2026
FinOps Teams Found 7 Enterprise Cloud Budget Killers First. Is Your Engineering Team Still Ignoring Them?
By NeuralWired Research DeskJune 27, 202614 min read
Your company spent a fortune moving to the cloud. And right now, somewhere between 27 and 29 cents of every dollar you’re spending is being quietly vaporized. Not by your competitors. Not by the market. By your own infrastructure.
Flexera’s 2026 State of the Cloud Report surveyed 753 IT professionals and found that cloud waste has actually ticked back up to 29% this year, reversing a five-year downward trend. At $675 billion in global cloud infrastructure spending in 2025, that’s roughly $182 billion burned annually. And that number isn’t moving. Seven years. Same waste percentage. Thousands of FinOps tools later.
Deloitte projects that companies implementing FinOps practices could collectively save $21 billion in 2025 alone. The math is there. The playbook exists. The problem is that most engineering teams aren’t running it. They’re building features. Someone else will handle the bill. Except the bill doesn’t care.
This article breaks down exactly what FinOps teams found first, the seven budget killers that account for the vast majority of preventable cloud waste, and what you need to do about them before your next board review.
Cloud cost optimization is not a new idea. Companies have been talking about it since AWS launched EC2 in 2006. The FinOps Foundation has existed since 2019. 93 of the Fortune 100 have implemented formal FinOps practices. There are over 12,000 certified FinOps practitioners across 3,500 organizations.
And still: 29% of cloud spend is wasted. Every year. Like clockwork.
29%of cloud spend wasted in 2026, UP from 2025 for first time in 5 years
$44.5Bin unused or underused cloud infrastructure in 2025 alone (Harness)
84%say managing cloud spend is their #1 cloud challenge, above security
The numbers above come from real surveys, real respondents, and real enterprise environments. What makes them striking isn’t their size. It’s their stubbornness. Harness found enterprises will waste approximately $44.5 billion in unused or underused cloud infrastructure in 2025, representing 21% of infrastructure budgets. The global FinOps market is on track to reach $26.91 billion by 2030. More tools. More practitioners. Same waste floor.
There’s a floor here, and it’s architectural. But there’s also a ceiling, and it’s organizational. The gap between those two is where this article lives.
The SaaS Layer Most Companies Are Missing
Wasted cloud compute is only part of the story. According to Zylo’s 2026 SaaS Management Index, the average enterprise wastes $80.6 million annually on unused SaaS licenses alone, against an average total SaaS spend of $246 million. Cloud waste and SaaS waste are now the same governance problem with two different dashboards.
Why Engineering Teams Are Both the Problem and the Solution
Here’s the uncomfortable truth that Harness surfaced in its 2025 FinOps in Focus report: 52% of engineering leaders say the disconnect between FinOps teams and developers is the primary driver of wasted cloud infrastructure spend. Not bad tools. Not insufficient budgets. The gap between the people writing the code and the people watching the bill.
This isn’t a criticism. It’s structural. Engineering teams are rewarded for shipping, not for cost efficiency. When a developer provisions a database cluster for a new feature, they’re optimizing for availability and performance, exactly what their job requires. The bill that arrives six weeks later is someone else’s problem. Except in 2026, “someone else” is increasingly the engineering leader themselves.
The FinOps Foundation’s State of FinOps 2026 report shows that 78% of FinOps practices now report into the CTO or CIO organization, up 18% from 2023. The discipline has left the finance department and moved into engineering’s house. That’s not a coincidence. It’s where the decisions that create cloud spend actually live.
“An important trend is the shift toward developer-facing FinOps. More teams are integrating cost accountability into engineering workflows so they can address waste early in the development process.”
Jay Litkey, SVP Cloud and FinOps, Flexera; Governing Board Member, FinOps Foundation. Source: TechTarget, March 2026
“Shift left” in cost is the same principle as shift left in security: the earlier you catch the problem in the development cycle, the cheaper it is to fix. A rightsizing recommendation caught during a sprint review costs an engineer 20 minutes. The same problem caught six months into production costs an ops team two weeks of negotiation and a production risk window.
The 7 Cloud Budget Killers FinOps Found First
What follows is synthesized from Flexera 2025 and 2026, Harness 2025, SpendArk’s State of Cloud Waste 2026, and Datadog’s 2024 infrastructure reports. These aren’t theoretical categories. They’re ranked by observed frequency and dollar impact across enterprise cloud environments.
Budget Killer 1: Idle Compute (15 to 20% of total cloud spend)
This is the single largest category of cloud waste. Instances running at near-zero utilization: development servers left on over weekends, staging environments that were provisioned last quarter and never stood down, database nodes built for projected load that never materialized. Flexera and Harness together estimate that idle compute and overprovisioned instances account for 60% of all cloud waste combined.
A real case from a mid-market company running a $450,000 per month cloud bill: an audit identified over $100,000 per month in three line items. Idle deprecated resources were burning $40,000. Dev and test environments running 24/7 cost $35,000. Overprovisioned databases added $28,000. Six months after the fix, the bill was $270,000. The customer base kept growing. The bill didn’t.
The fix: AWS Compute Optimizer uses machine learning to generate rightsizing recommendations per instance. AWS Instance Scheduler automates stop and start routines for non-production environments. Neither requires an engineering sprint to implement. Collect two to four weeks of utilization baselines before making changes to production workloads.
Budget Killer 2: Overprovisioned Resources (10 to 12% of total waste)
Most infrastructure teams provision based on peak theoretical demand, not observed usage. The result is compute running at 5% CPU utilization at 3am and 85% CPU at 2pm, with billing based on the capacity reserved for the peak. Memory overprovisioning is harder to catch because it doesn’t show up in standard cloud billing dashboards. A Kubernetes pod requesting 4GB of RAM but using 400MB won’t trigger any default alert.
The fix: Rightsizing is the highest-impact single optimization for most organizations at cloud cost maturity Stage 1. AWS Compute Optimizer and Azure Advisor both generate per-instance recommendations based on observed usage patterns. Pair with autoscaling groups for workloads that have genuine demand spikes. The savings: typically 15 to 25% of compute spend within 60 days.
Budget Killer 3: Orphaned “Zombie” Resources (5 to 15% of total spend)
A developer runs a load test on a temporary server and forgets to de-provision it. An admin terminates an EC2 instance but leaves the attached EBS volume. A project wraps up. The associated load balancer, Elastic IPs, and snapshots keep running. This accumulates invisibly over months and years in every large cloud environment.
The math is less dramatic per unit than idle compute, but it’s relentless. At $0.08 to $0.10 per GB per month for SSD storage, a single 500GB orphaned volume costs $40 to $50 per month indefinitely. Multiply that across hundreds of terminated instances over two to three years and you have a significant liability that shows up on no one’s performance review.
Flexera 2025 found unattached disks in the top three waste items across all organization sizes.
The fix: Automated resource lifecycle management. Tag everything with owner, environment, and project fields at the point of provisioning. AWS Trusted Advisor flags idle resources automatically. AWS Storage Lens provides organization-wide storage visibility. Set up weekly cleanup automation that flags anything untagged and older than 30 days for review before deletion.
Development, staging, and QA environments account for 30 to 50% of cloud spend at many organizations. They run around the clock even when no engineer has logged in since 6pm Friday. This is the most immediately fixable item on this list, and the one with the least production risk.
The fix: Automated shutdown schedules with self-service “start now” buttons for engineers who need weekend access. The implementation timeline is days, not sprints. Typical outcome: 20 to 25% reduction in non-production spend within 90 days. If your organization has a $500,000 per month cloud bill with 35% in non-production, that’s a $35,000 to $43,000 per month opportunity you can close in a two-week sprint.
Budget Killer 5: Missing or Underused Commitment Discounts (largest single rate optimization)
Reserved Instances and Savings Plans offer 40 to 72% savings versus on-demand pricing for steady-state workloads. Yet fewer than half of organizations fully utilize commitment instruments with any single cloud provider, according to Flexera 2026. Some over-commit and pay penalties. Most under-commit and overpay.
A 10% coverage shortfall on a $5 million annual cloud bill is $500,000 in annualized overpayment. Not from waste. From rate arbitrage you didn’t take.
“Organizations need automation to make a dent on cloud inefficiencies, which continues to grow with increasing cloud spend. Some organizations do not have fully automated end-to-end rate optimization. Instead, they rely on human-mediated processes that are potentially error-prone, labor-intensive and fall short of maximizing value in the cloud.”
Jay Litkey, SVP Cloud and FinOps, Flexera. Source: TechTarget, March 2026
The fix: Start conservative. Commit in stages aligned to your finance team’s demand models. Review monthly. Target 70 to 80% commitment coverage on baseline workloads. AWS Compute Optimizer ESR benchmarks show the industry average improving from 21% to 26% between 2022 and 2023. The ceiling is much higher for organizations that treat this systematically.
Budget Killer 6: Storage Sprawl (6 to 10% of total waste)
Snapshots accumulated past any retention policy. Data parked in premium storage that could be archived. Logs from a service that was sunset in Q3 2024. Old backups that outlived their purpose by 18 months. This is the cloud’s attic problem: no single item looks expensive until someone adds them all up.
The fix: Lifecycle policies that automatically move data to cheaper storage tiers. S3 Intelligent-Tiering and Google Cloud Autoclass handle this automatically without requiring manual tagging per object. Azure Cool and Archive Blob Storage offer similar tiering. Delete snapshots that exceed your retention policy automatically. AWS Storage Lens provides organization-wide visibility across accounts and regions.
Budget Killer 7: Data Egress and Transfer Costs (3 to 6% of waste, but explosive and spiky)
Data transfer fees can turn into major budget killers from a single architectural decision made by one engineer on one afternoon. Egress costs, cross-region traffic, and NAT gateway charges are often invisible during initial design and catastrophic during rapid scaling. As of February 2024, AWS began charging $0.005 per hour for all public IPv4 addresses. Azure followed in July 2025. These structural charges are now permanent across all three major cloud providers.
One note for GCP users: Google eliminated some internet egress charges in 2025, creating the first real pricing asymmetry between providers worth actively factoring into multi-cloud architecture decisions.